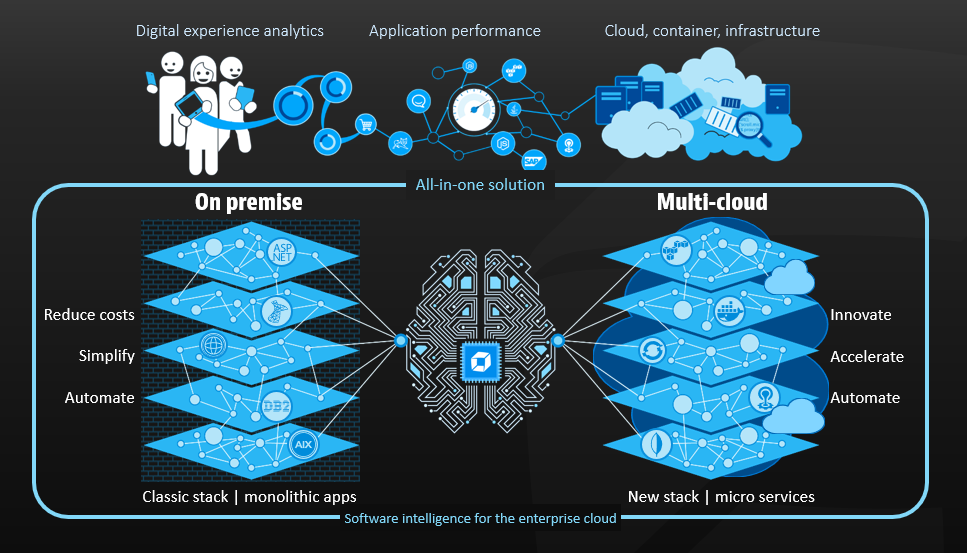
As organizations are building their new multi-cloud, microservice and container-based stack, we see some of them attempt a build-it-yourself monitoring approach. This may involve open source tools, commercial solutions, home-grown software, or some combination of the three. The goal is to get a single pane of glass into this complex and dynamic environment, but the reality usually falls far short of expectations.
There are a few common reasons organizations may take a build-it-yourself monitoring approach:
- With the growing availability of open source software, it seems inexpensive.
- Their environment is unique, so they believe it requires a unique solution.
- Engineers like to build stuff, so build-it-yourself may evolve from a grass roots effort or innovation team initiative.
- They don’t realize there is a single solution for monitoring the full stack and providing the analytics they need.
A brief example
We recently worked with a large retailer who went down the build-it-yourself monitoring road. They used a variety of tools for collecting data from various sources in their massive environment including Zipkin, Prometheus, Riverbed, and several others. This allowed them to collect tens of millions of metrics per minute.
But what to do with all that data? First, they set up a multi-node Cassandra cluster to store everything. Then they developed their own correlation engine to analyze the data and try to make sense of it. Lastly, they layered on Grafana for visualization to finally achieve that elusive single pane of glass.
Sounds great, right?
Well, not so much as it turned out.

Because of the vast amount of data they were generating and the number of resources required for instrumenting their apps, adoption became a challenge for this retailer. While their goal had been to monitor their entire environment, they ended up with visibility into only 5% of their apps and only one out of every thousand transactions. Their Cassandra cluster quickly grew to 250 nodes, requiring a significant hardware investment. And, because developers had to modify code to instrument their apps, it became a pain for them as well. Instead of innovating, they were spending time instrumenting and re-instrumenting for monitoring every time their code changed.
The result was a huge time and resource investment, limited visibility, and pockets of the organization ended up buying their own monitoring tools to fill the gaps, resulting in further tool proliferation.
Enter Dynatrace all-in-one
Because of these challenges, this retailer decided to look at commercial monitoring solutions, but they didn’t believe that any one solution could meet their needs. When they saw Dynatrace they were amazed that a single solution could:
- Monitor their entire stack. All their apps, from low level infrastructure and logs, code-level, up through the user experience.
- Automate the deployment process. Simple, host-based install with no configuration or manual instrumentation required, even for container-based environments.
- Provide answers. AI-assisted analytics that provide simple answers – what’s wrong, who is impacted, what is the root cause, and how did we come to that conclusion.
- Scale to their environment. Dynatrace was easily able to scale to their 100,000+ hosts, allowing them to cover all their apps.

The costs of build-it-yourself
When considering a build-it-yourself monitoring approach, it’s important to consider more than just the up-front software and hardware required. The chart below shows the five primary cost categories you should evaluate.
| Cost category | Build-it-yourself | Dynatrace all-in-one | Advantage |
| Upfront SW/HW costs
Software license and hardware costs |
|
|
Build-it-yourself IF using mostly open source software and hardware requirements aren’t too steep |
| Upfront deployment costs
Resources for instrumentation/configuration |
|
|
Dynatrace, and it’s not even close |
| Ongoing costs
Server/storage costs, administrative maintenance & support, development, re-instrumentation for code changes |
|
|
Dynatrace, and it’s not even close |
| Cost of outages and downtime
Due to production defects, MTTI and MTTR |
|
|
Dynatrace, and it’s not even close |
| Opportunity costs
What else could resources be doing? |
|
|
Dynatrace, and it’s not even close |

Still skeptical? Raise your expectations.
One of the great things about Dynatrace compared to build-it-yourself monitoring is that it’s super easy to try it out. So, if you don’t believe that a single solution can monitor your entire stack with a quick deployment and AI-powered answers, just start your free trial to see for yourself.


Looking for answers?
Start a new discussion or ask for help in our Q&A forum.
Go to forum