
Over the last few years we’ve talked a lot about how at Dynatrace we have changed our development processes in order to deploy new feature releases with every sprint, as well as providing a fast-lane to production that allows us to deploy important updates to our customers within an hour. Read our case study to learn more about it, or listen in to my podcasts with CTO Bernd Greifeneder and DevOps Lead Anita Engleder.
Besides organizations wanting to learn how they can replicate the improvement in speed and quality, we keep hearing more questions around how we include security into our processes. In order to answer this question, I went to the Lab in Linz and talked with our Security Engineers who are dedicated to constantly improving the security of our Dynatrace Software Intelligence Platform. They also find ways to bake security into our DNA and culture – just as we always had performance at the core of everything we do and deliver.
About six months ago, after we interviewed Pascal Schulz about his Bug Bounty program, I tried to find more security related stories within our lab to share with the public and ended up chatting with Barbara Schachner, Security Architect at Dynatrace. We talked about how we’re investing in better tooling to automatically scan code as part of the build process, e.g. using tools like Sonar and Barbara said, “Hey, what about this blog post you wanted to write? I have a new idea. Instead of starting with the tooling we should first focus on how we changed our process, which KPIs we introduced and how we steer our security efforts using a data driven approach!” As I love metrics and data driven decisions, I was all ears 😊
Now, I’ve done my best to relay what I’ve learnt from her and hope it can be an inspiration for your own advances to better integrate security into your development and operational processes and practices. Please note that all charts and numbers shown are just generated samples to visualize our process.
#1 Let’s track it with JIRA
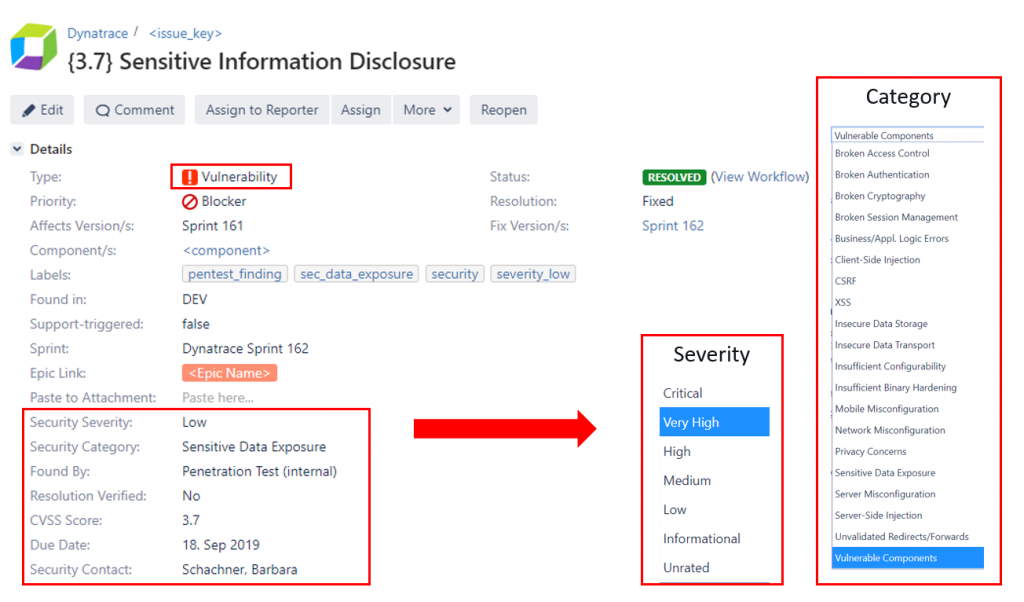
As far as I remember, Atlassian’s JIRA had already been used back when I started at Dynatrace in 2008. We track our epics, stories, tasks, bugs, plan our sprints, backlogs and probably much more that I’m not even aware of. Logical choice therefore to use Jira to track discovered security vulnerabilities as well. The Dynatrace Product Security team introduced a new “security” label for bugs and two additional fields that indicate the severity and category of the vulnerability. In a second step, Barbara and the team even replaced the label with a separate Jira issue type “vulnerability” and added a few more security-related fields:
#2 Clearly defined severities and SLA’s
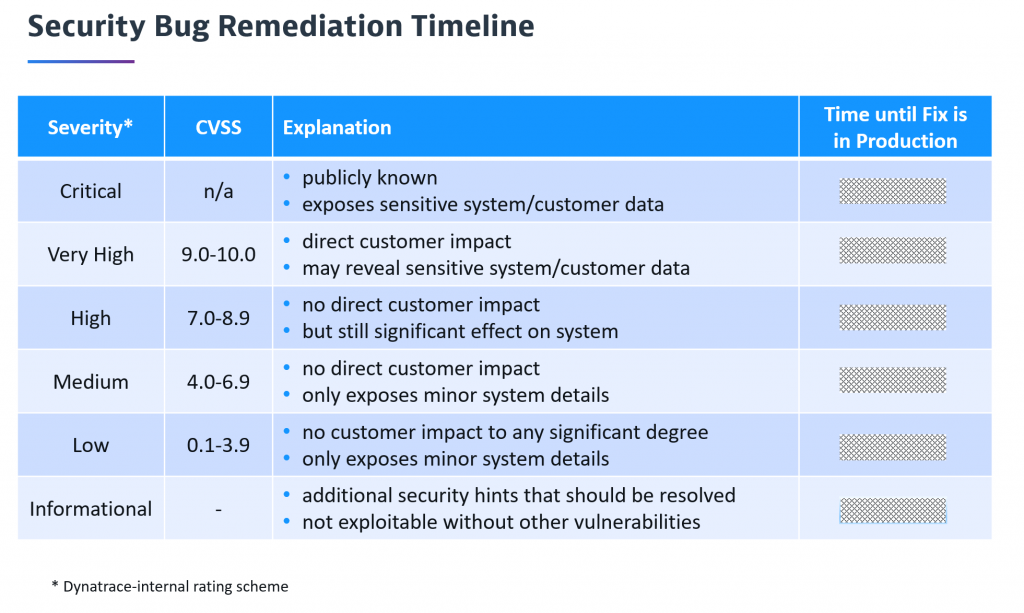
Severity is very important as it not only defines impact but also defines the priority and “Time until Fix is in Production”. You could also explain it as our internal Service Level Agreement (SLA) until the problem is remediated for the customer. The following shows the full remediation timeline table explaining every severity level including our SLA to remediate the problem:
#3 Easy tracking and handling for devs & security
As these Jira tickets get assigned to teams the same way as bugs do it doesn’t really change anything in the development process. With our bugs first strategy, both types of bugs (non-security & security) get addressed with the exception that developers must make sure to fix security issues within the defined SLA.
For the Product Security team, the process is also straight forward. New vulnerabilities entered are assessed and rated. After that the team tracks the timeline to make sure that no SLA is violated by reminding the developers and eventually the team leads about issues that need attention.
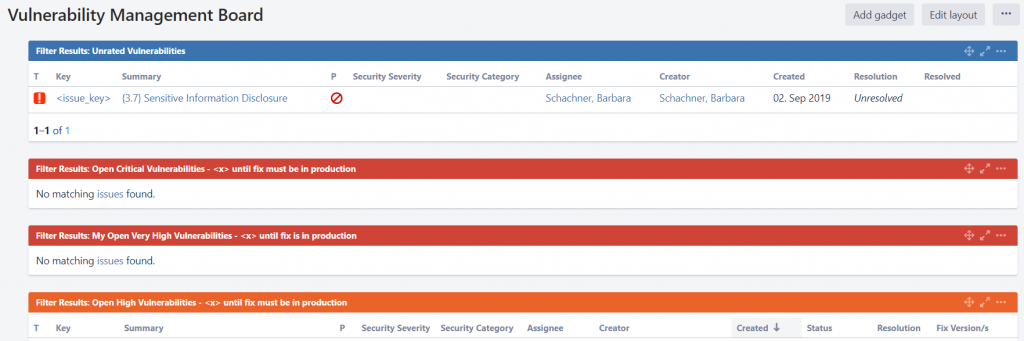
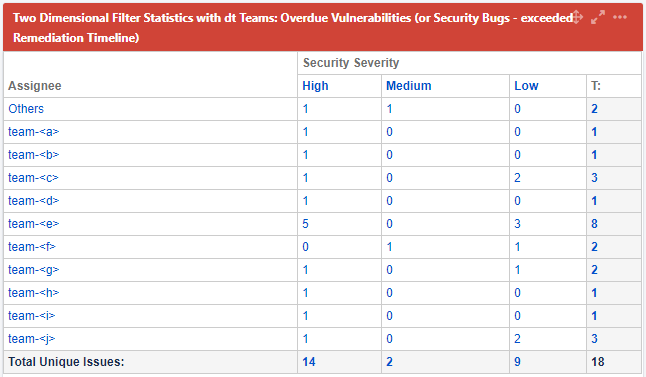
Barbara also created a couple of Jira dashboards that help both development and security teams get a status on open issues assigned to individuals or teams, as well as a dashboard that shows current security KPIs. Here some sample screenshots of these dashboards:
Product Security Team: Vulnerability Management board
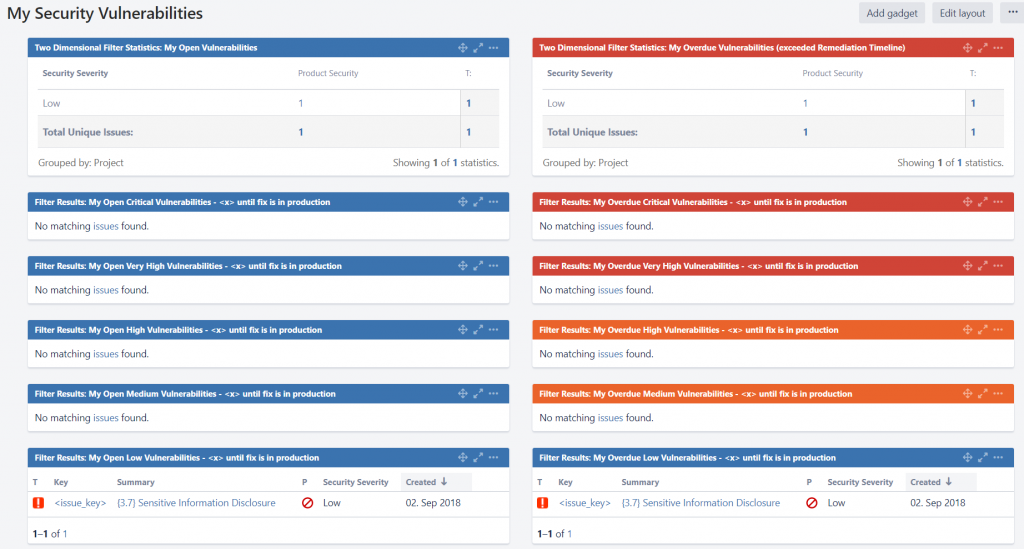
Developers: My security dashboard
Team Leads: Overdue bugs per team
There are a couple more dashboards, such as Created vs Resolved or Average Age charts, but those shown above should give you a good idea on what’s possible with reporting on Jira tickets.
#4 Steering efforts with data science
In the first part of the blog we wanted to highlight the process of how we are using Jira to manage security related tasks, how severities are defined and how developers, team leads, and the security team track the progress.
In the second part of this blog we show you a bit more data, so you see how the security related data allows us to successfully shift priorities towards problematic areas.
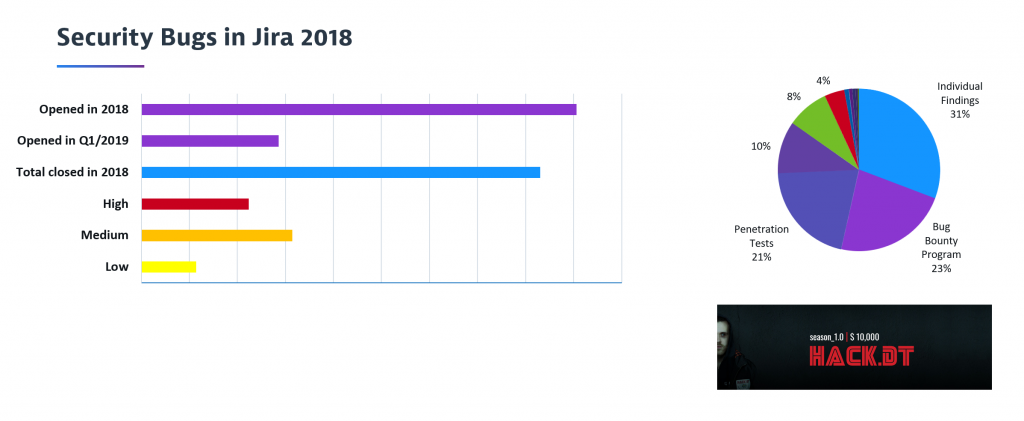
First, let me start with a number-obfuscated graph that shows how we have different sources of finding new vulnerabilities:
With the introduction of the new “Found By” field instead of labels, we even have an always up-to-date view on this in JIRA:
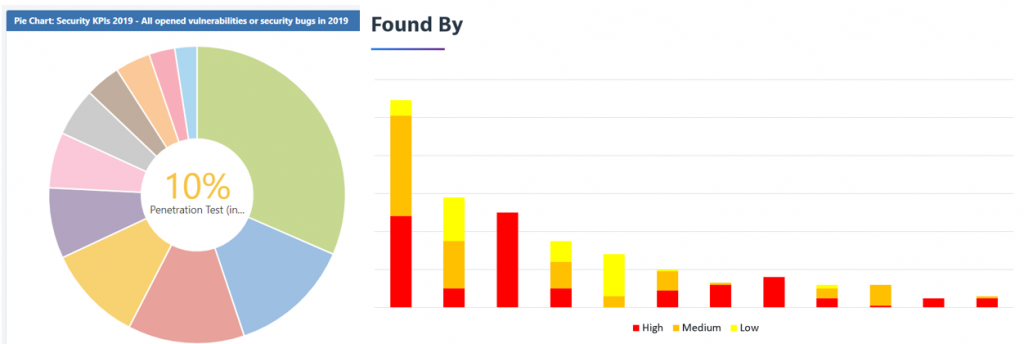
And now we can also easily combine the “Found By” field with the “Security Severity” and identify the vulnerability sources that bring the most valuable findings, which is very helpful to prioritize our efforts and investments.
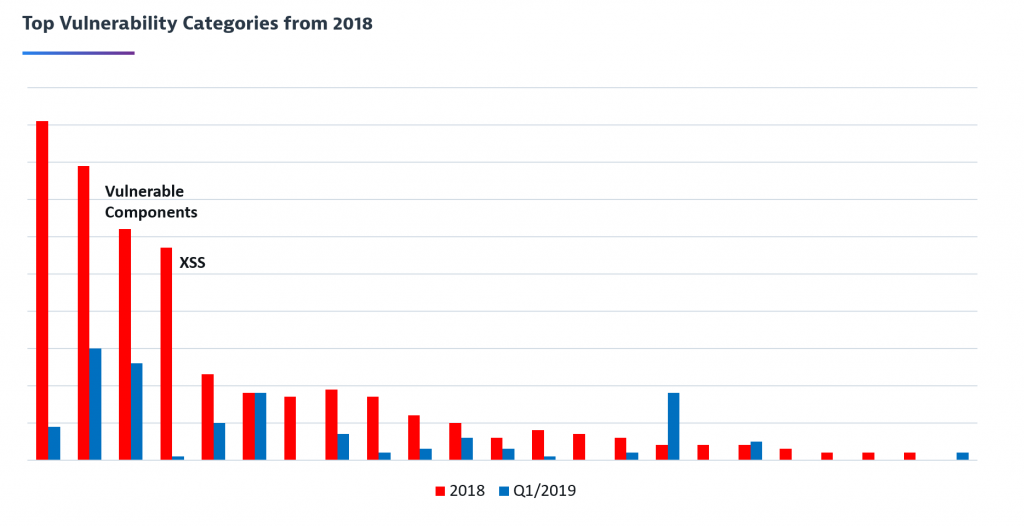
And, if you remember from the beginning, every issue not only gets a severity assigned but also a category. This means we can also identify our top vulnerability categories as well as the categories with the most severe findings. For example, analyzing all issues from 2018 based on the category highlighted that we had a couple of top vulnerability categories which we needed to pay special attention to, e.g. by specific research and education or a broader tool-based approach to fix a bigger amount of problems of a certain category.
The following graph shows that using this data driven approach has clearly already paid off. Comparing all issues from 2018 with Q1/2019 shows for example that we could nearly eliminate Cross-Site Scripting vulnerabilities by improving our SAST rules and build-breaking checks. On the other hand, it also shows that our investments in scanning tools resulted in a relative increase of our detection rate for example for Vulnerable Components.
Next: A blog focusing on tooling
Thanks again to Barbara Schachner for sharing all these details on how she and the Product Security team at Dynatrace strategically tackle security and help eliminate vulnerabilities. Security is something that concerns us all and that’s why sharing our practices hopefully helps you to become better with security as well.
Once you have established such a lightweight and working JIRA-based vulnerability workflow, the next challenge to tackle is the automated (or semi-automated) creation of Jira tickets for the results of all your different scanning tools. We have found that this is the best way to seamlessly integrate security into the development workflows and provide developers with fast feedback about their security issues.
We also hope that this strengthens your trust in our Dynatrace Software Intelligence Platform. In case you haven’t already, sign up for a trial and experience it yourself.


Looking for answers?
Start a new discussion or ask for help in our Q&A forum.
Go to forum