
Tired of your CI/CD pipeline keeping you in the dark? These questions probably sound all too familiar:
- Where is my pipeline right now?
- Why is my pipeline slow or unstable?
- Which tests are flaky and delaying releases?
- How fast can artifacts reach production?
- Which phase is slowing down my artifacts?
CI/CD pipelines can be complex, and a lack of visibility can create delays, instability, and inefficiency. The Dynatrace platform is like flipping a switch in a darkened room. You can see what’s actually happening, answer pressing questions, and gain insights that can improve performance. Let’s take a look at how Dynatrace can illuminate your pipelines.
Elevating CI/CD with observability: From code to confidence
Here’s how each question maps to a problem and its solution:
Where is my pipeline right now, and why is it slow or unstable?
Challenge: Pipelines can feel like black boxes—teams often don’t know whether they’re stuck during build, waiting on tests, or failing at deployment. Additionally, slow or unstable pipelines miss service-level agreements, frustrate teams, and delay releases due to bottlenecks or resource issues.
Insight: Dynatrace provides real-time visibility into each pipeline stage by using tracing and metrics. It pinpoints performance bottlenecks, detects anomalies, and triggers alerts to enable fast resolution. By analyzing stage durations and resource usage, such as CPU spikes during testing, it helps teams stabilize pipelines and meet deadlines.
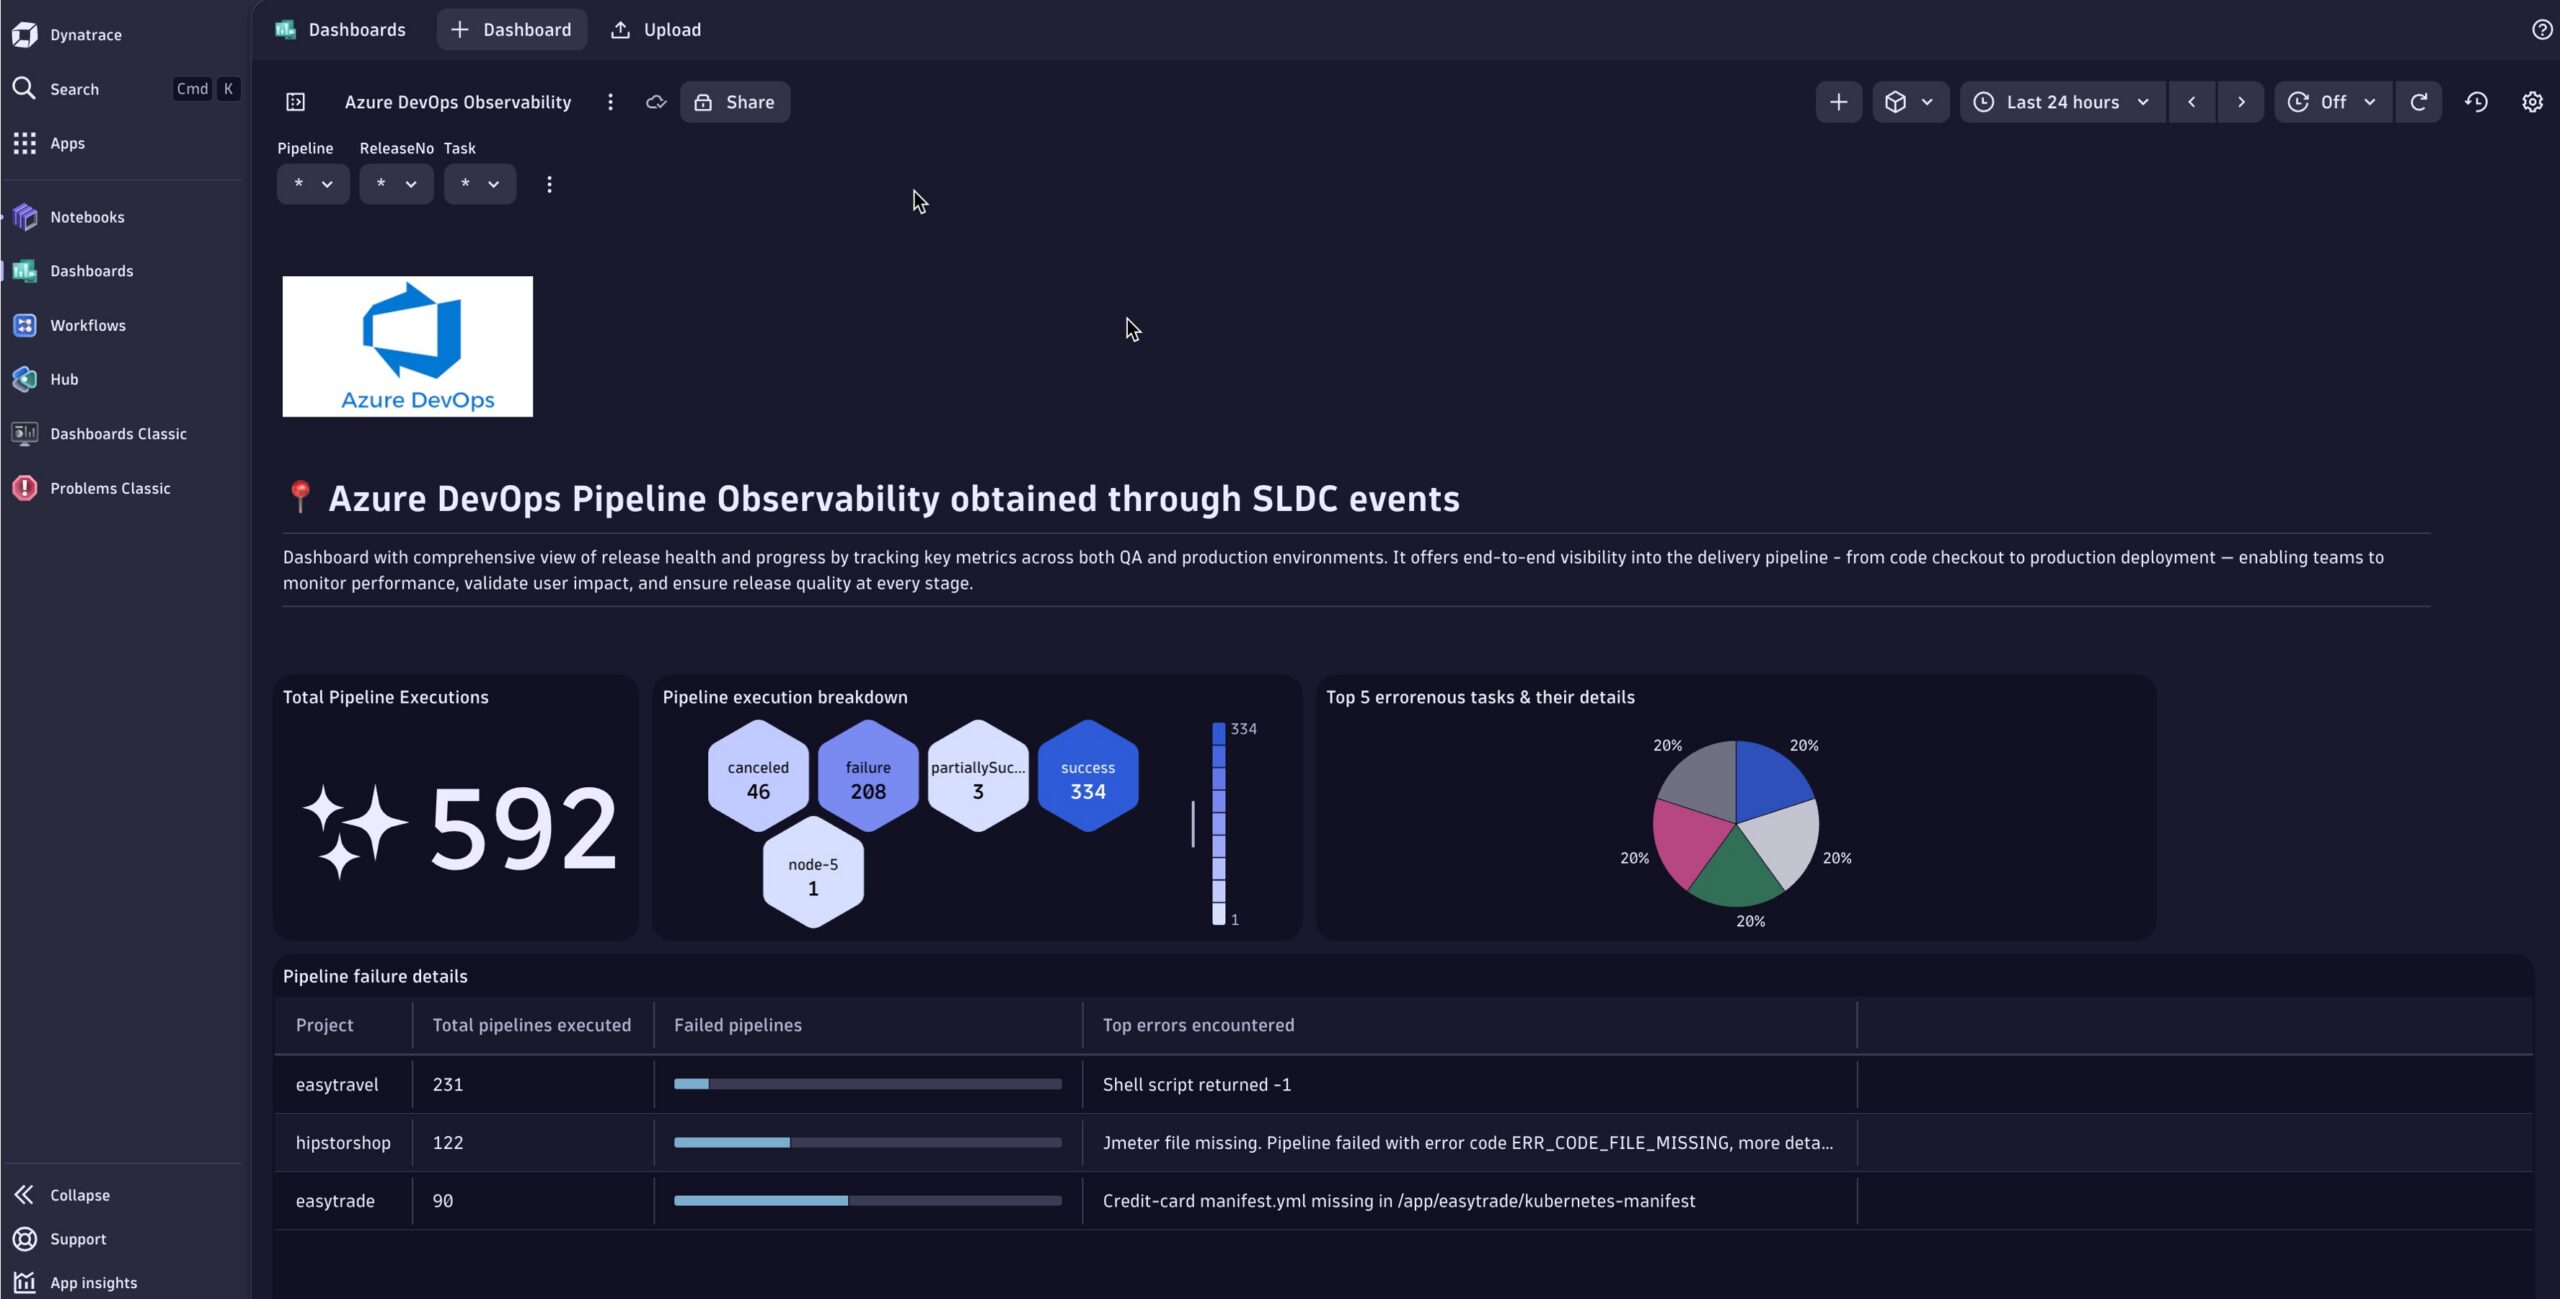
As shown in the screenshot below, ingesting SDLC events into an Azure DevOps pipeline helps teams identify issues early and maintain pipeline reliability by enabling visibility into pipeline, execution status, and error-prone tasks.
Which tests are flaky and delaying releases?
Challenge: Flaky, inconsistent tests erode trust and slow down releases as teams spend time debugging false failures.
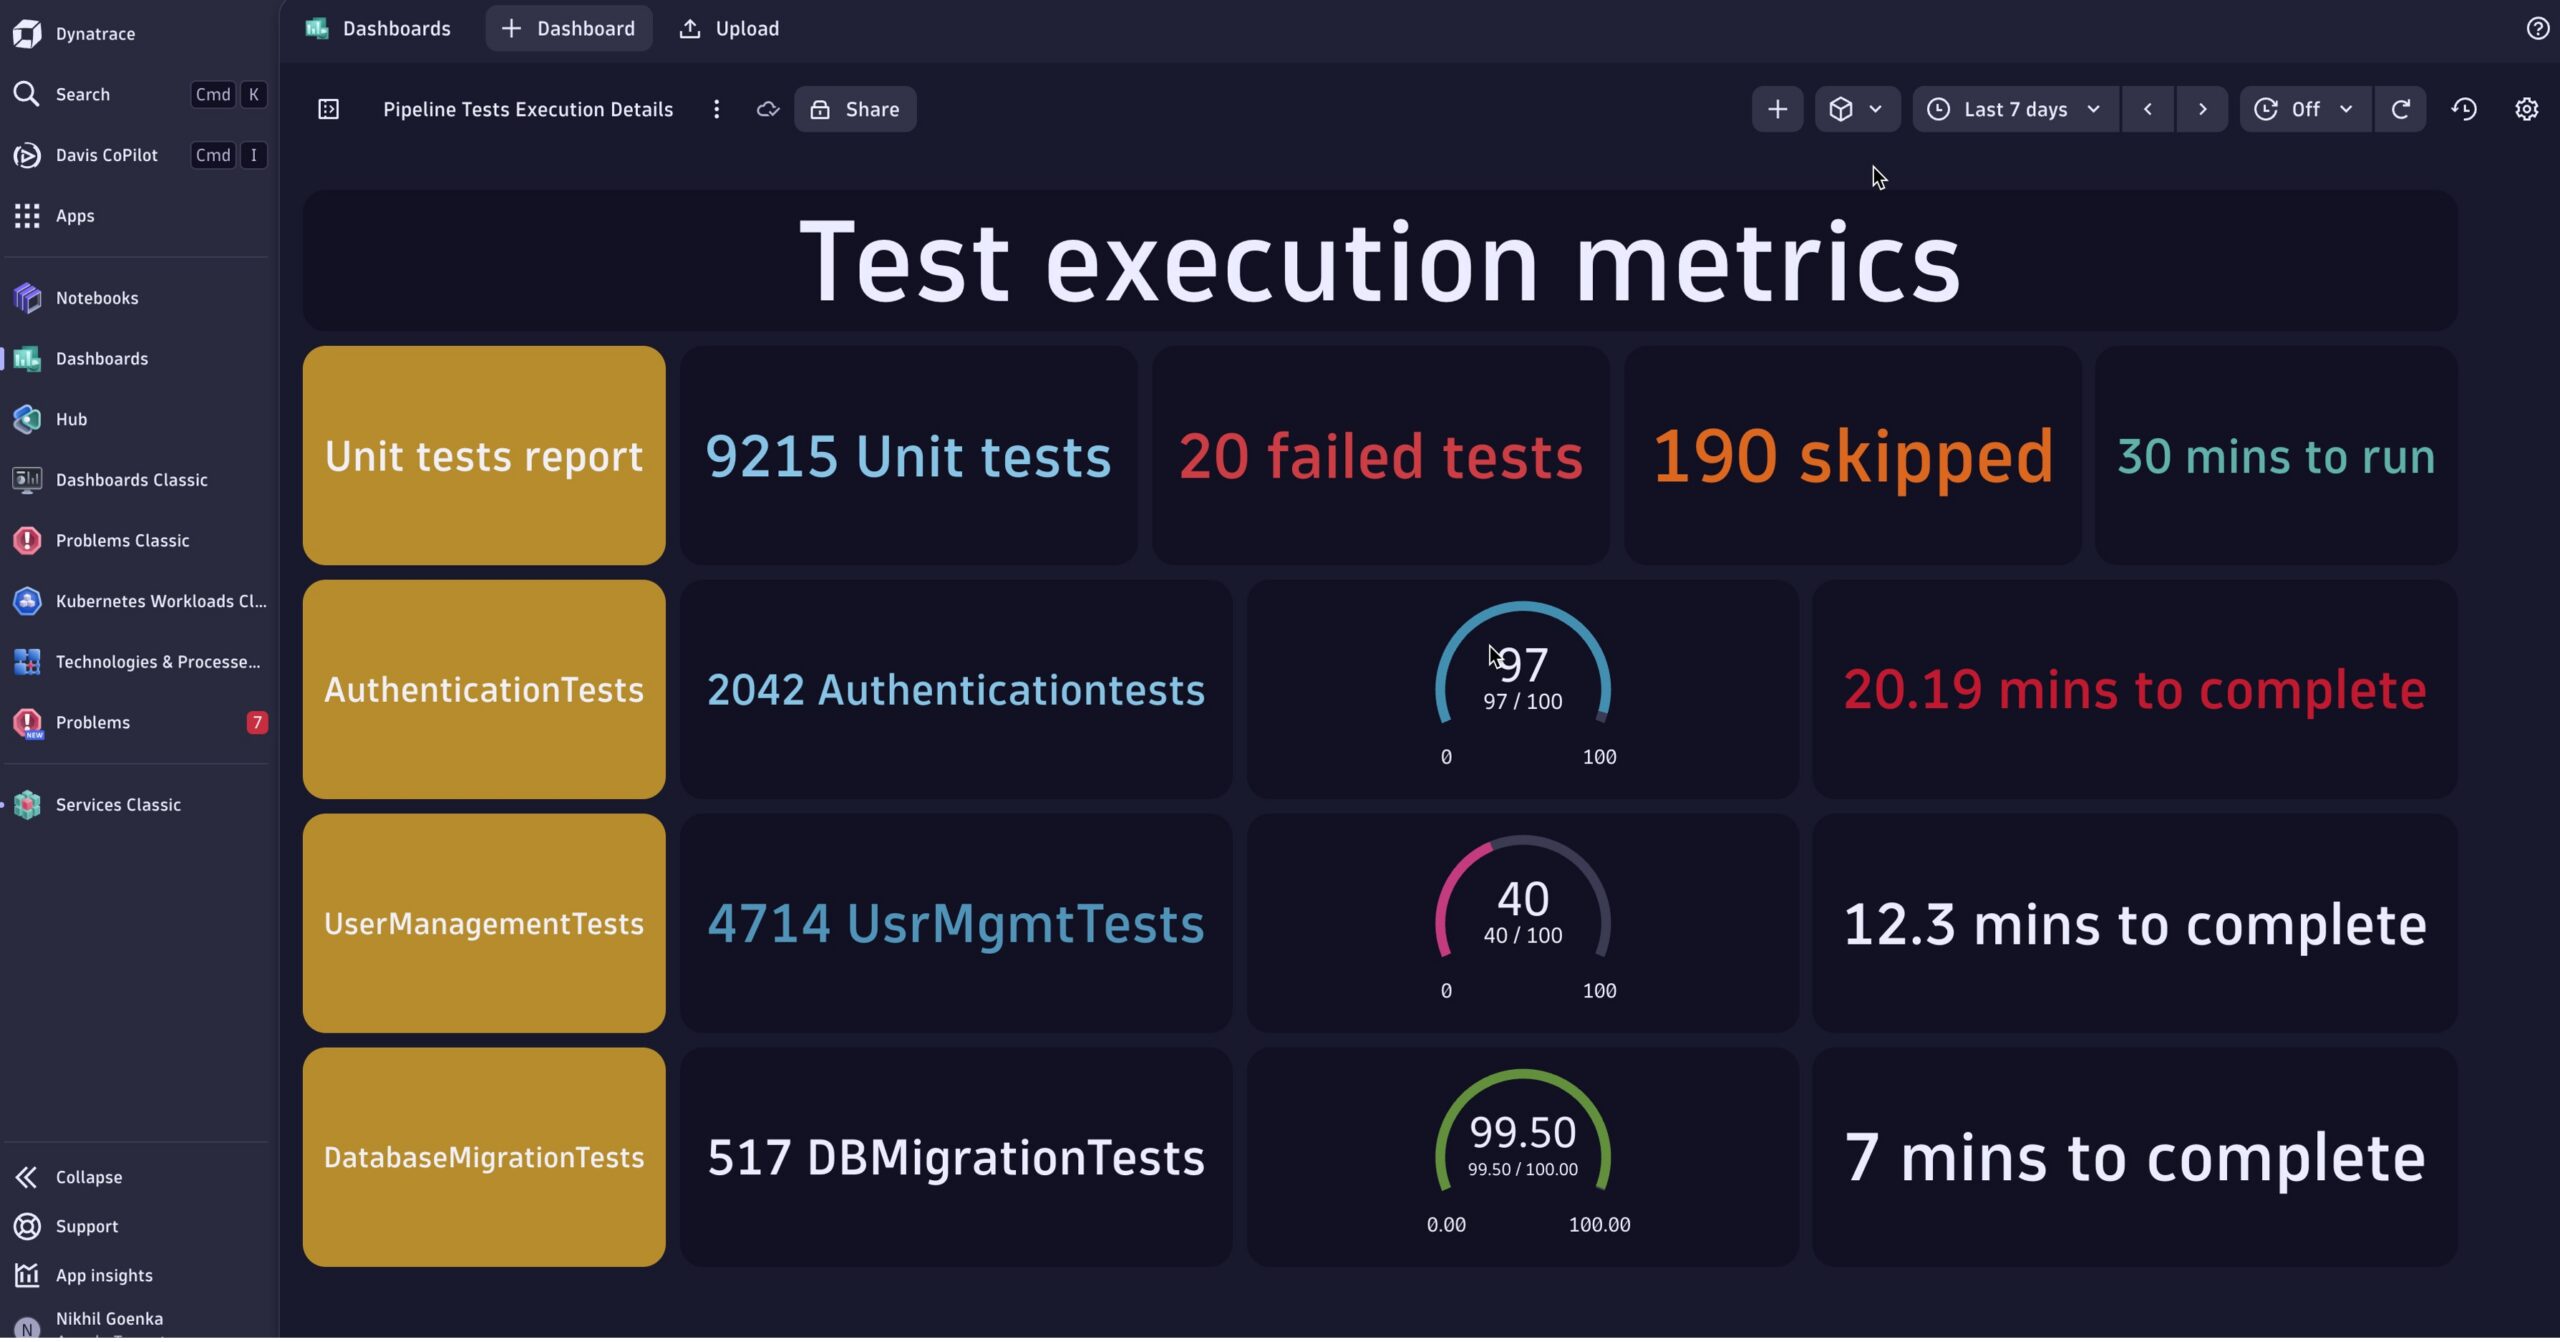
Insight: Dynatrace identifies flaky tests by tracking execution patterns and failure rates. By tagging test spans with metadata using OpenTelemetry, teams can quickly spot unreliable tests, isolate them, and keep delivery moving smoothly.
As illustrated in the screenshot below, integrating OpenTelemetry with a Jenkins pipeline enables the generation of metrics, logs, and traces. These are ingested via the Dynatrace Collector, providing a comprehensive view that helps teams pinpoint the test executions.
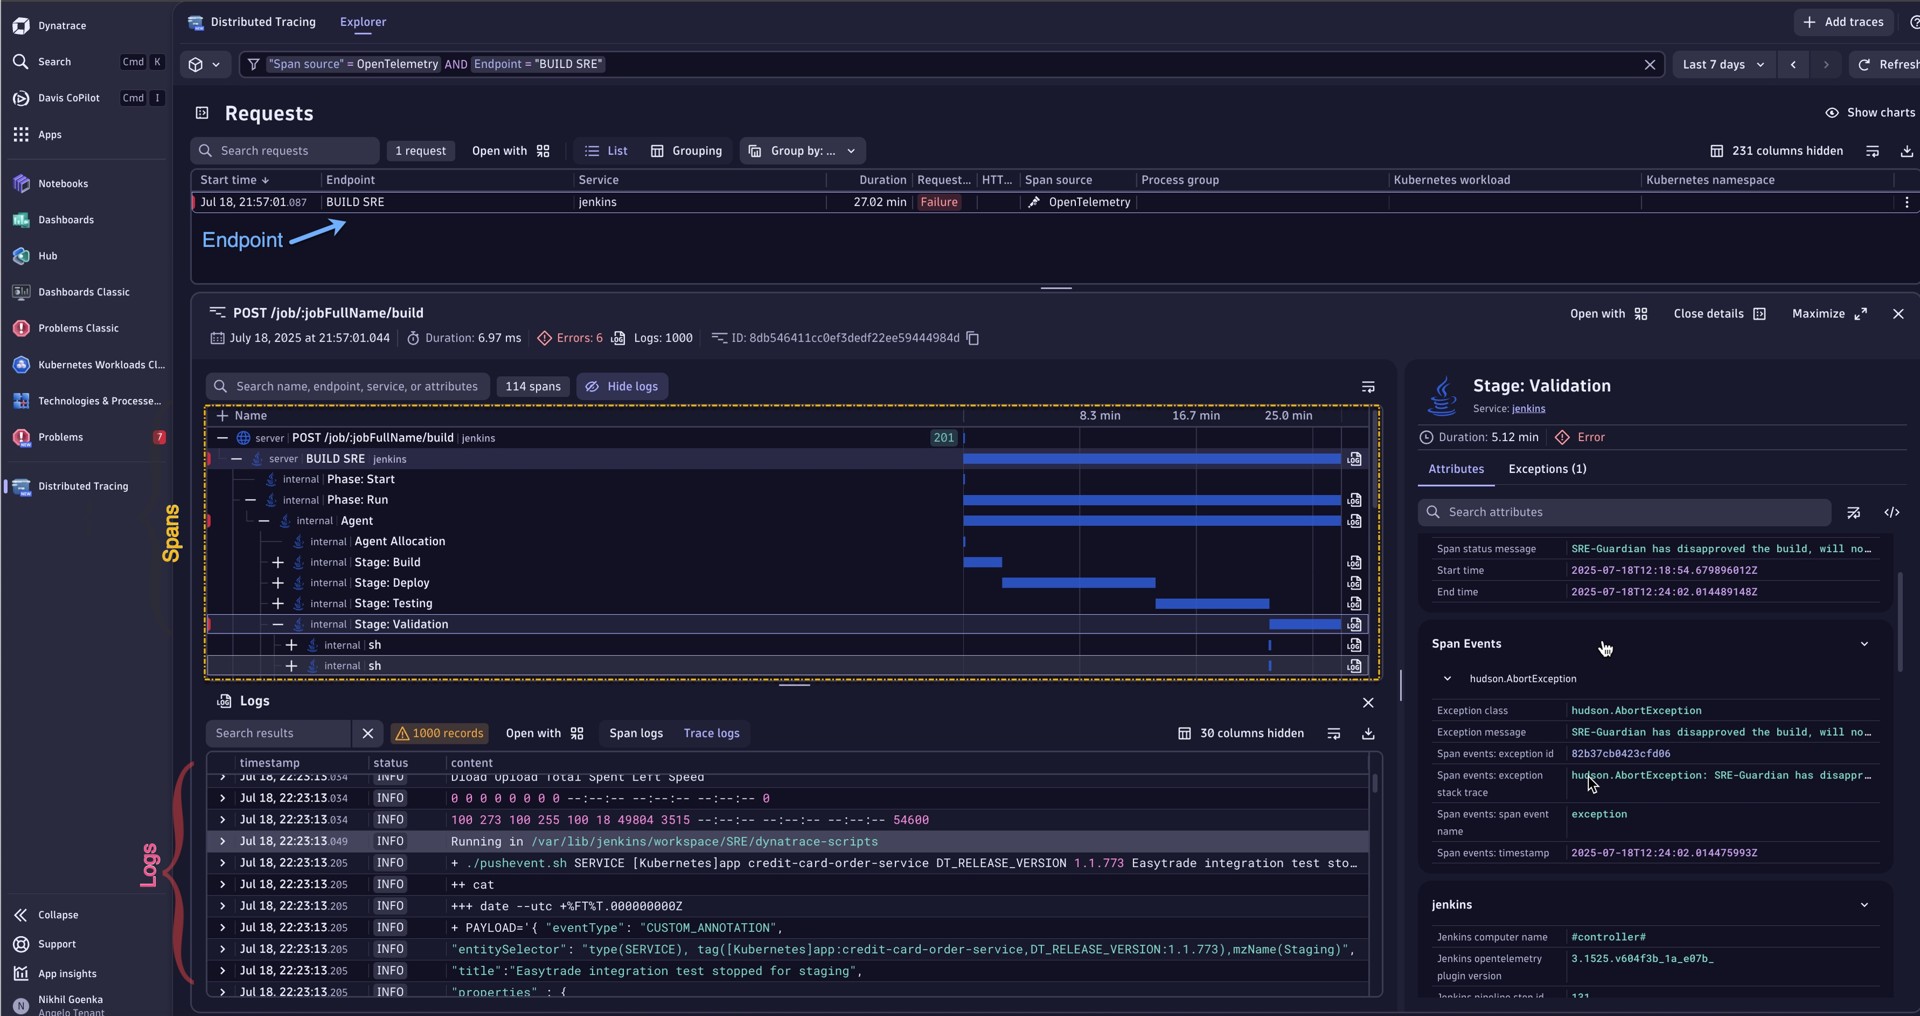
Furthermore, Dynatrace allows teams to drill into spans, logs, and exceptions using context-aware data, offering end-to-end visibility from the originating endpoint all the way to the underlying logs and exception traces, as seen in the example below.
How fast can artifacts reach production?
Challenge: Slow artifact promotion from development to production creates unpredictable release cycles, delaying value delivery.
Insight: Dynatrace measures end-to-end time from commit to deployment. Visualizing the pipeline’s flow with traces helps optimize stages, reduce wait times, and ensure predictable releases.
As seen below, leveraging the GitLab API in combination with Dynatrace Workflows, teams gain real-time visibility into pipeline behavior over time, eliminating uncertainty and improving confidence in delivery processes.
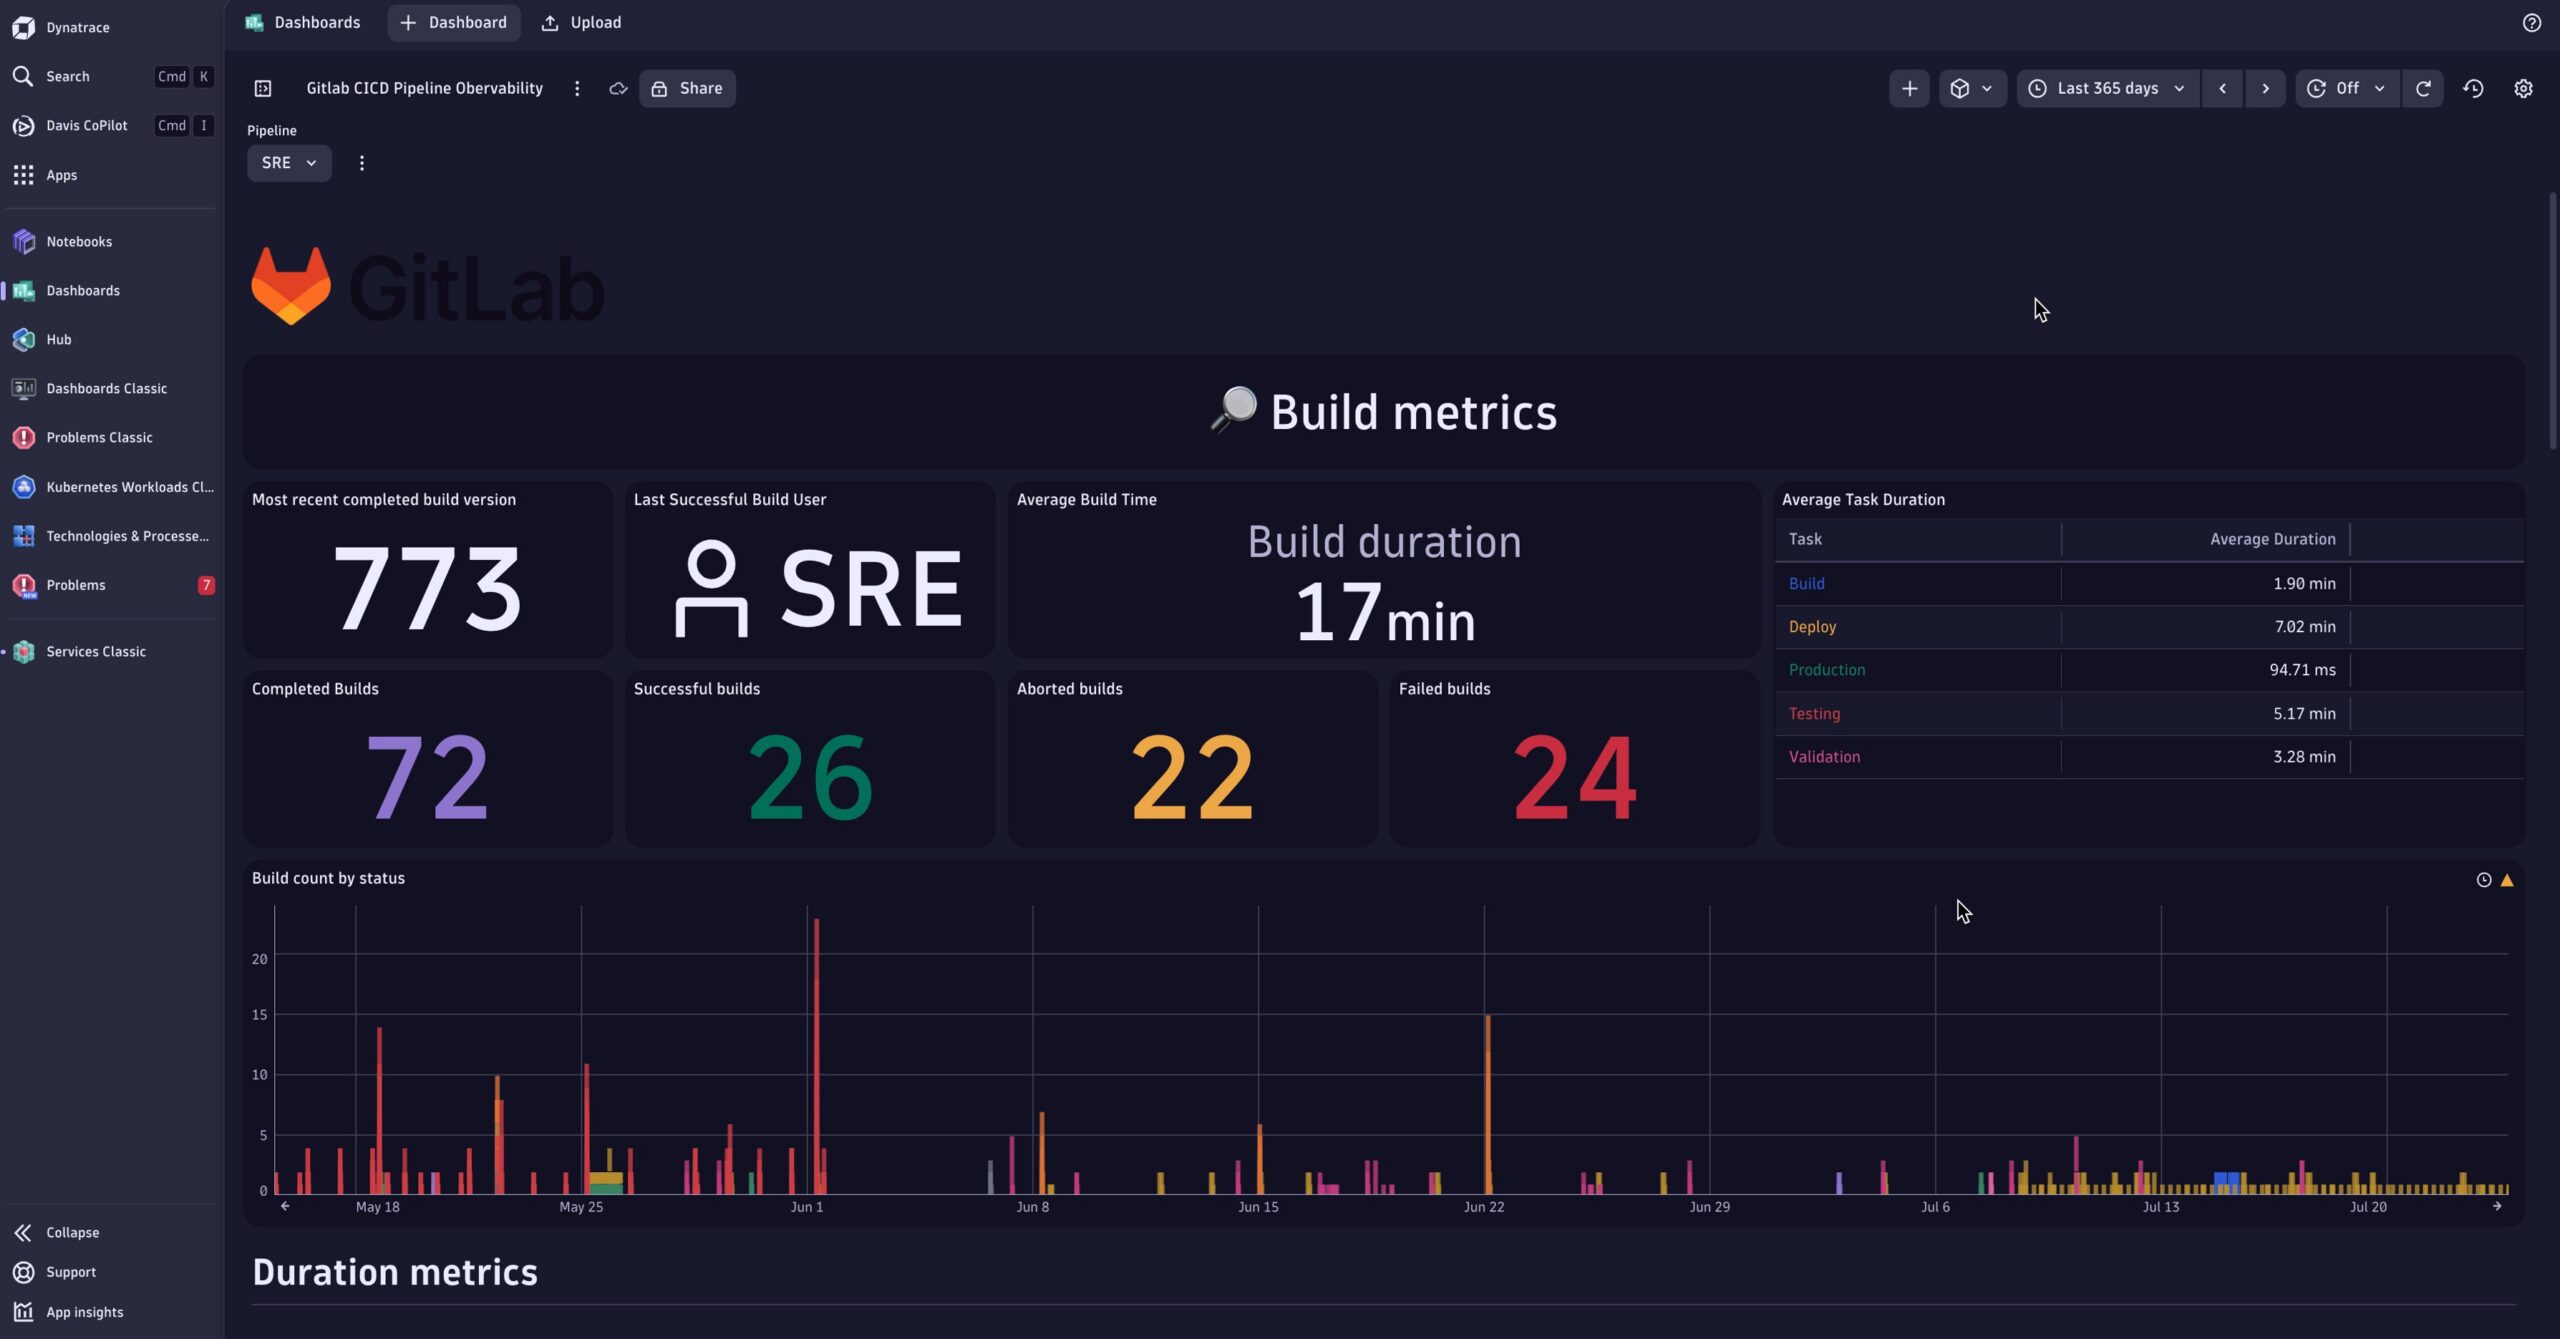
Additionally, Dynatrace predictive AI capabilities proactively inform teams of potential delays or anomalies, enabling earlier intervention and smoother release cycles.
Implement CI/CD pipeline observability with Dynatrace
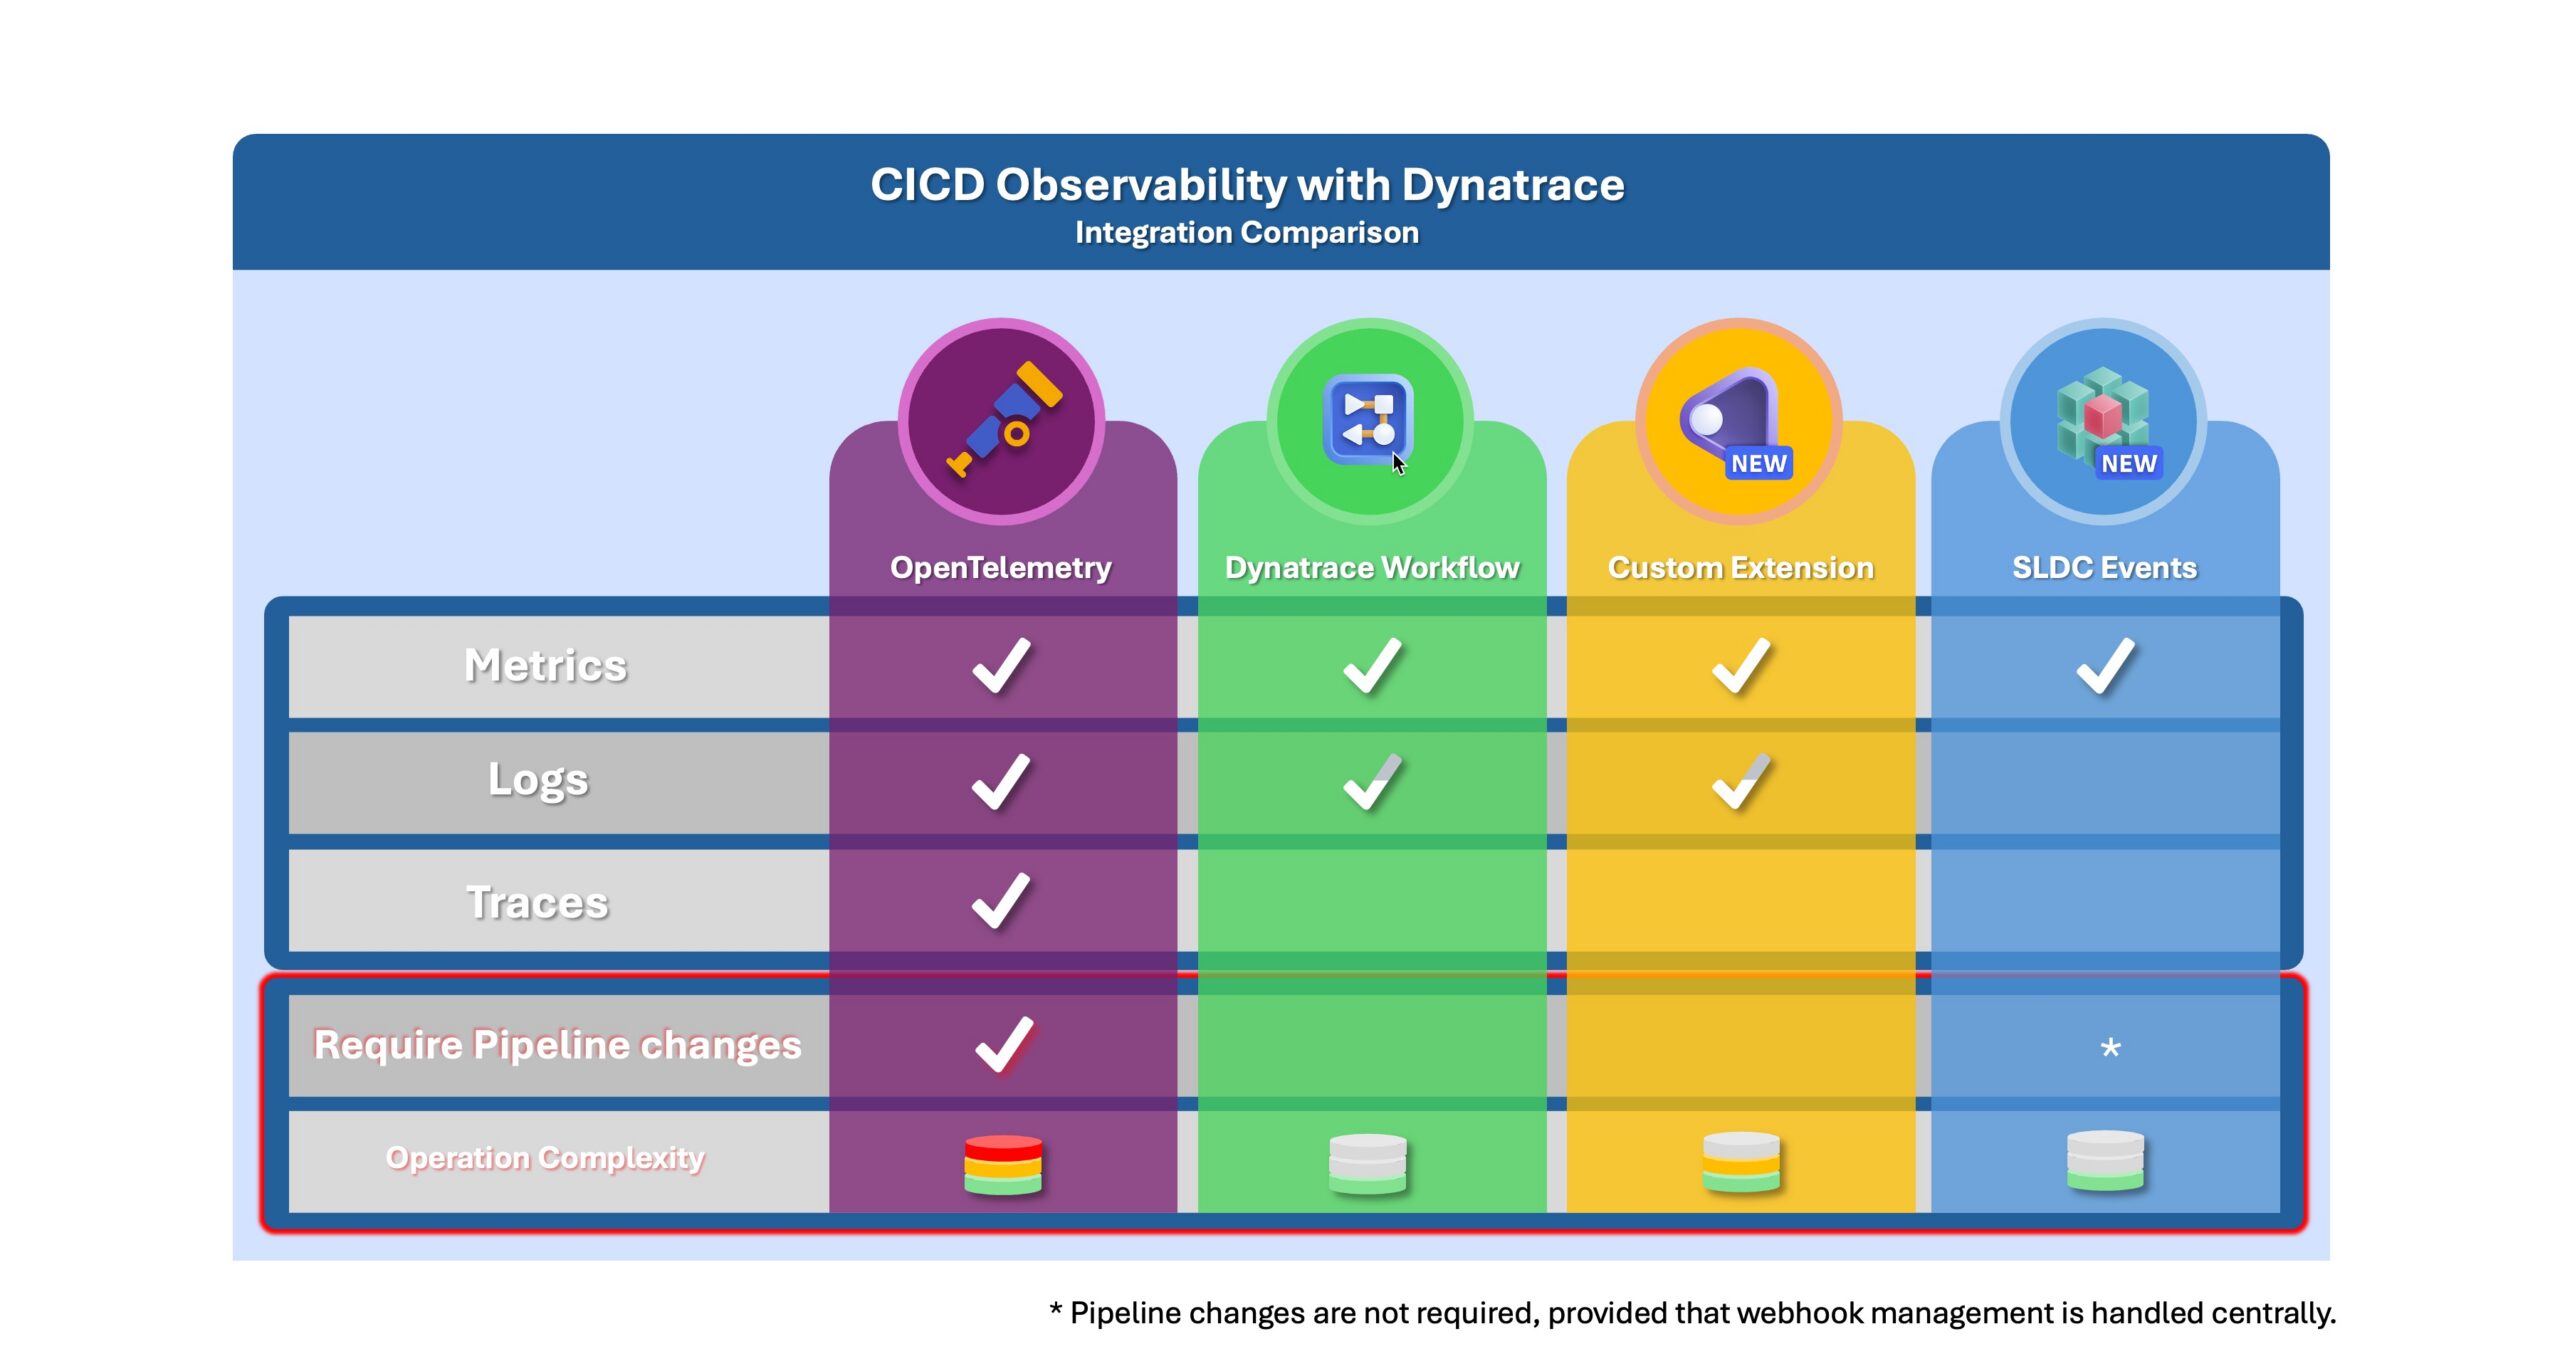
Consider the following practical techniques to unlock the full potential of Dynatrace within your CI/CD pipeline. Each approach enables visibility into different aspects of the software delivery lifecycle, helping teams monitor, analyze, and optimize their pipeline performance.
1. OpenTelemetry
Instrument your CI/CD pipeline with OpenTelemetry to stream real-time metrics, traces, and logs into Dynatrace. This approach provides comprehensive observability but may require setting up and maintaining collectors.
OpenTelemetry instrumentation examples:
- Jenkins OpenTelemetry example
- GitLab Observability with OpenTelemetry example
- GitHub Actions using OpenTelemetry example
2. Dynatrace Workflows
Dynatrace Workflows automate the periodic retrieval of build and deployment metrics from CI/CD tool APIs. This method is easy to set up and does not require changes to the pipeline itself.
Dynatrace workflow examples for Pipeline Observability
- Jenkins Dynatrace workflow and dashboard example
- Azure DevOps workflow and dashboard example
- Gitlab Dynatrace workflow and dashboard example
3. Custom extensions
Similar to workflows, extensions can query CI/CD APIs and ingest relevant metrics into Dynatrace. They avoid pipeline modifications but require development effort and ongoing maintenance.
4. Pushing SDLC Events
Configure the CI/CD tools to send Software Development Lifecycle (SDLC) events (e.g., build start, success, failure) directly to Dynatrace via the SDLC Events API. Once ingested, these events can be analyzed using Dynatrace Query Language (DQL) to detect patterns, trigger alerts, or correlate with other observability signals.
Alternatively, OpenPipeline can be setup to extract SDLC events from the pipeline logs in tools like Jenkins, ArgoCD, and Github. This enables out-of-the-box pipeline observability by capturing metadata such as application name, pipeline run details, and version, supporting CI/CD analytics, and root cause analysis enriched with lifecycle metadata.
The table below outlines the types of datasets accessible through each technique, helping you choose the right approach based on your observability goals.
Conclusion
Bringing observability into your CI/CD pipelines with Dynatrace helps teams deliver software faster and more reliably. By leveraging techniques like OpenTelemetry, Dynatrace Workflows, and SDLC events, teams gain the visibility needed to continuously improve their delivery process.
What’s next?
In the next post, we will explore how to integrate your CI/CD tools with Dynatrace using these techniques. In the meantime, here are a few examples that show how this works in practice:
- ArgoCD deployment observability
- Azure DevOps pipeline observability
- GitHub Actions pipeline observability
- GitLab pipeline observability clinic video


Looking for answers?
Start a new discussion or ask for help in our Q&A forum.
Go to forum