
To help you understand and optimize your users' journeys through your applications, we've introduced funnel charting–the ability to query and visualize conversion funnels using user session queries.
Whether you run a small food delivery company, a mid-sized movie streaming business, or a multinational hotel group, your applications are built with a well-defined business goal in mind (in these examples, respectively, to enable your users to order food, watch a movie, or book a hotel). To reach their goals, users generally must take a few steps in your application. In the case of a food delivery application, this might involve selecting desired food items, adding extra ketchup, entering credit card details, and paying. But what if out of 100 users, only 20 arrive at the payment details stage and only 5 of them actually pay? How can you know the reasons for such a poor conversion rate? A poorly laid out home page, confusing navigation, or a broken link can make the difference between you or your competitor completing such transactions.
As an application owner, you want to understand where exactly your users are stuck in their journeys so that you can remove any obstacles and implement strategies that help your customers complete transactions with your application. Or, you might want to compare two different journeys that share the same goal to see which one is more effective and then implement changes accordingly.
Dynatrace now provides a powerful tool for understanding and optimizing your users’ journeys through your application: Funnel charting gives you the ability to query and visualize conversion funnels in user session queries.
How Dynatrace uses funnel charts to optimize USQL usage
At Dynatrace, we use funnel charting to see how our internal users are making use of user session queries. By tracking our internal users’ steps using Dynatrace USQL, we can see where most users stop their journeys. This helps us quickly implement changes to improve the use of USQL. See the example funnel chart below:
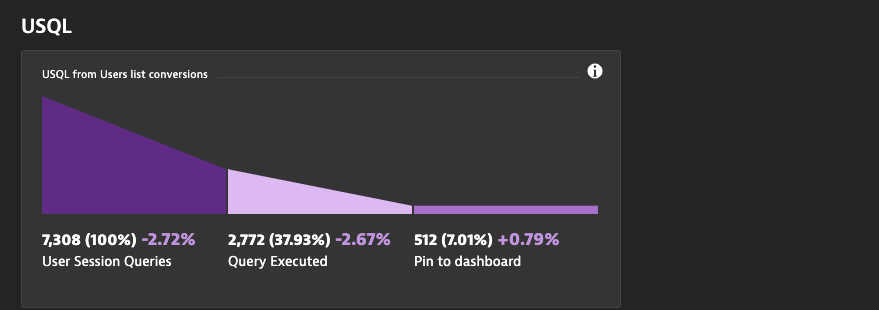
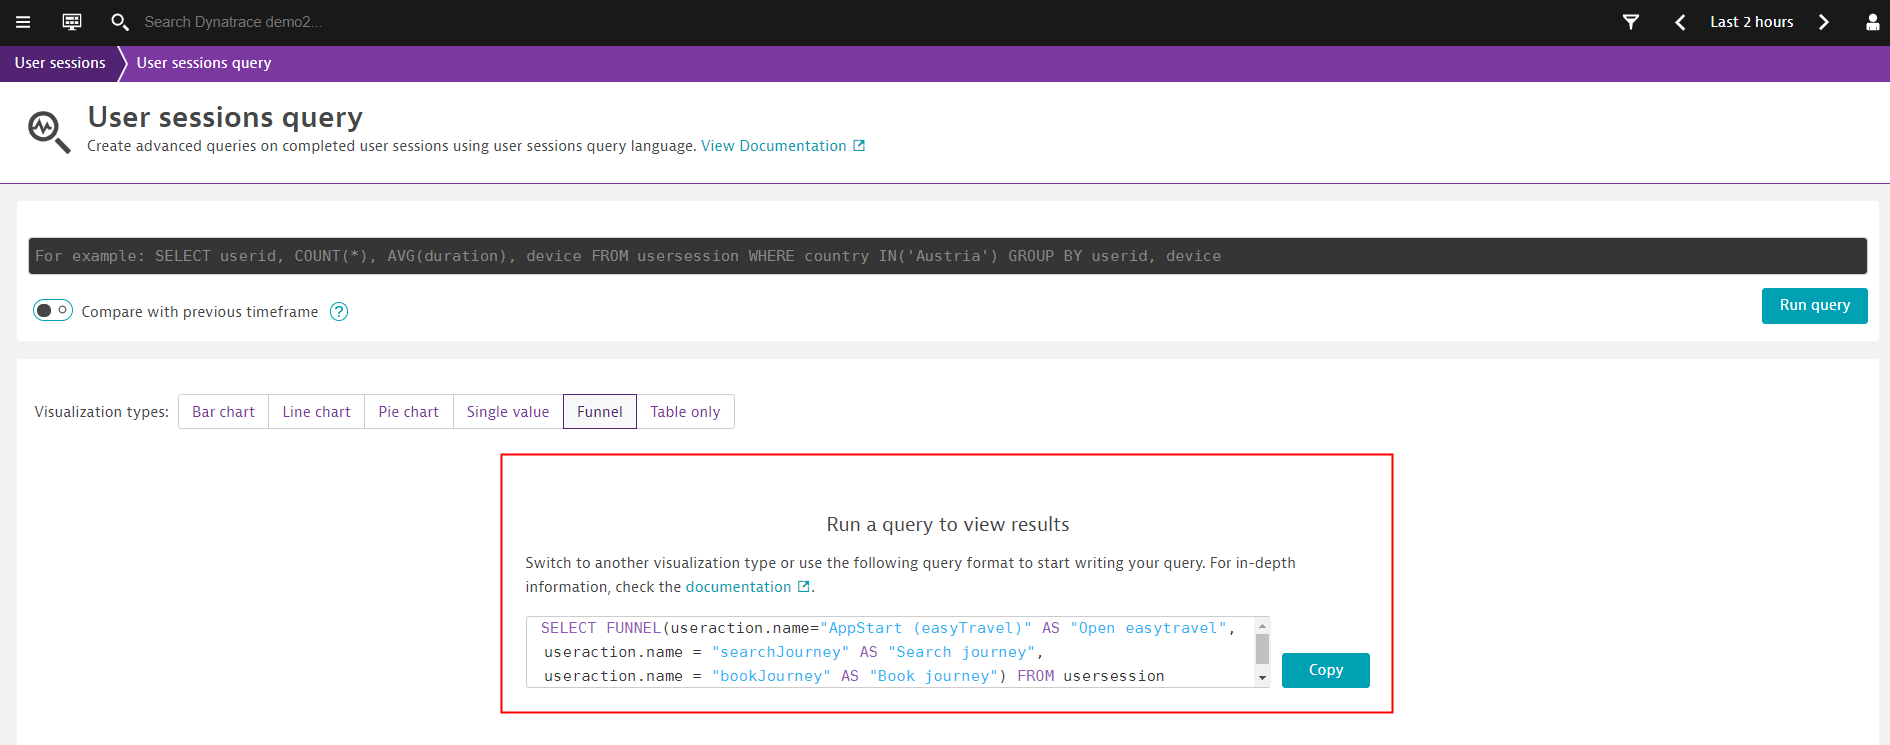
As you can see, many users begin using the USQL feature, but there’s a relatively large drop-off when it comes to them actually executing an USQL query. Once we realized that the USQL page wasn’t intuitive enough, we decided to provide a quick example query on the page so that users can easily try out USQL following a simple copy and paste approach.
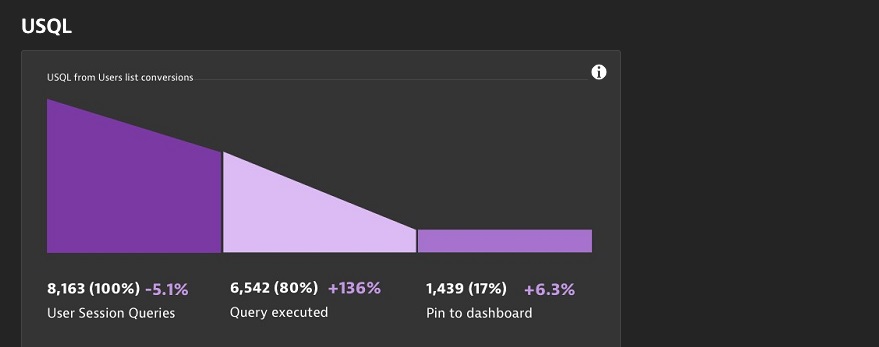
Just a few weeks after this small UI improvement, rerunning the same funnel chart revealed a greater number of users executing queries. See the screenshot below:
Customer use cases: Proactively finding issues and ensuring better user journeys
Let’s examine some customer use cases and see how you can use funnel charting to proactively find issues in your application.
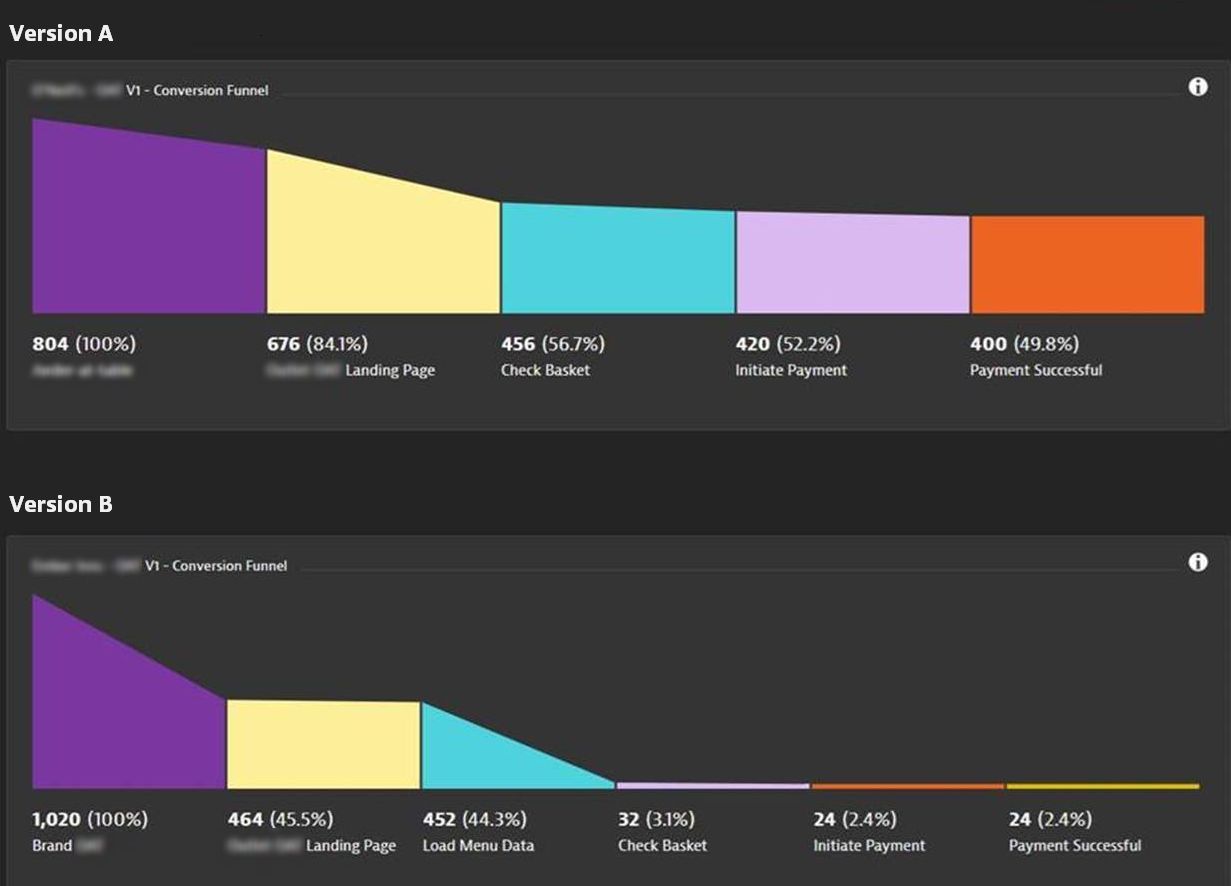
One of our customers from the hospitality industry provides an order-at-the-table app to help their customers order food. Usability of their app is crucial to their business success. To ensure ease of use and maximum convenience, the company uses funnel charting to track the health of their users’ journeys through their app.
To order at their table, the user journey consists of the following steps: Open the app > Load the landing page > Load the menu > Check the shopping basket > Initiate payment > Pay.
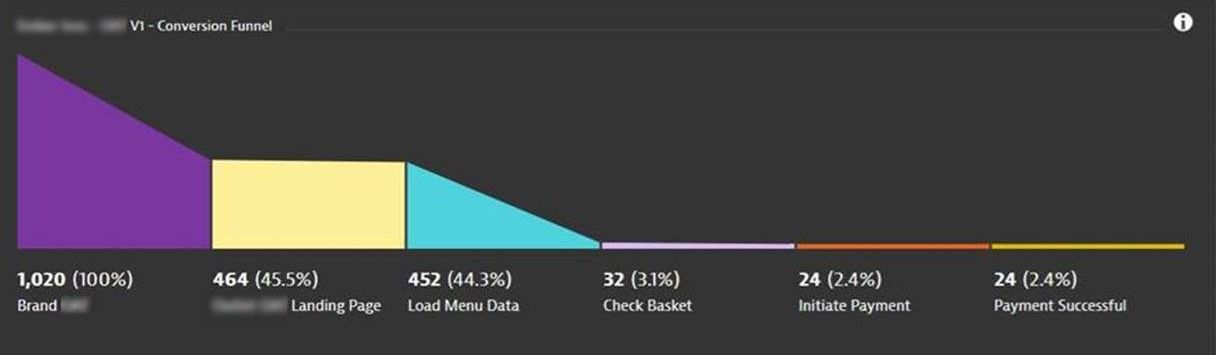
As you can see from the funnel chart above, there is a relatively healthy flow from opening the app through loading the menu. But for some reason, there’s is a big drop-off when it comes to checking the shopping basket. As this can have an impact on the bottom line of their business, the company of course needs to understand what the issue is behind this drop-off.
This hospitality company uses Dynatrace Digital Experience Monitoring to find the exact user sessions where their user journeys drop off between steps 3 and 4. They drill into those user sessions and analyze if there were any errors or outages. Further, with Dynatrace Session Replay, they can see exactly what their users were doing at the moment of the drop-offs and thereby hopefully understand why they’re struggling.
Understand which strategy works best by comparing different app versions
By running two app versions at the same time, our customers can leverage funnel charting for A/B testing. A/B testing enables Dynatrace customers to compare different journeys to see which one is more effective and then implement improvements accordingly.
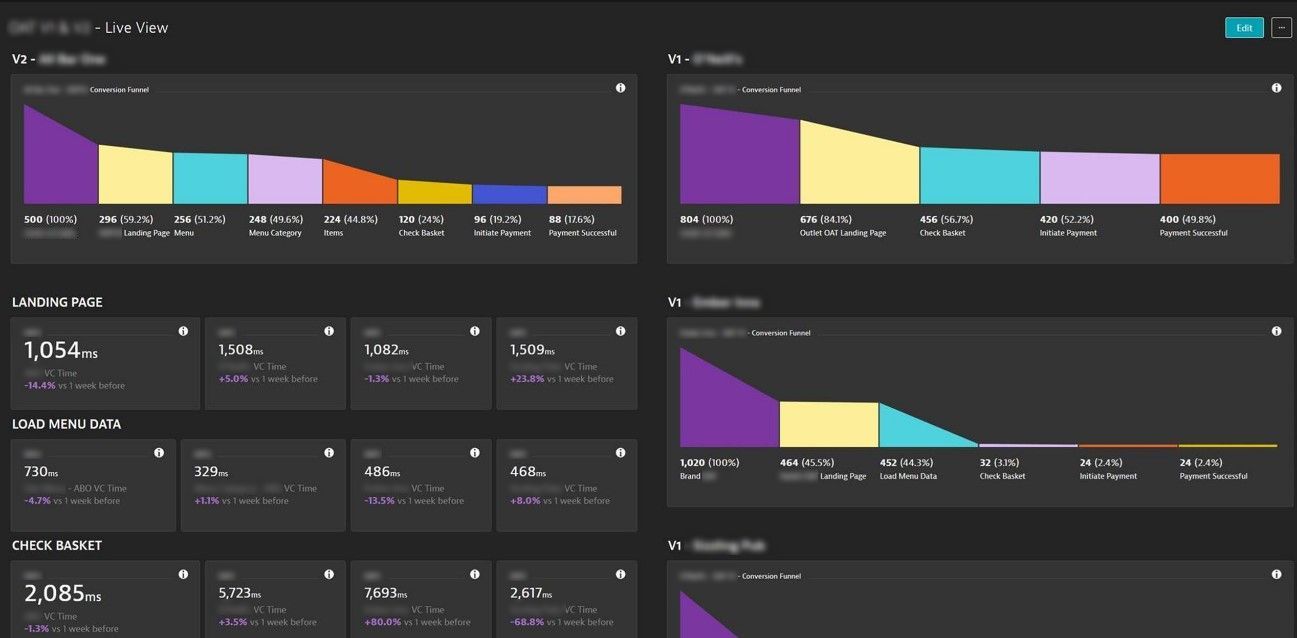
Understand the health your users’ journeys by pinning funnel charts to your dashboard
By pinning funnel charts to your dashboard, you can gather all the visualizations of your customers’ journeys in one place.
But wait… there’s more!
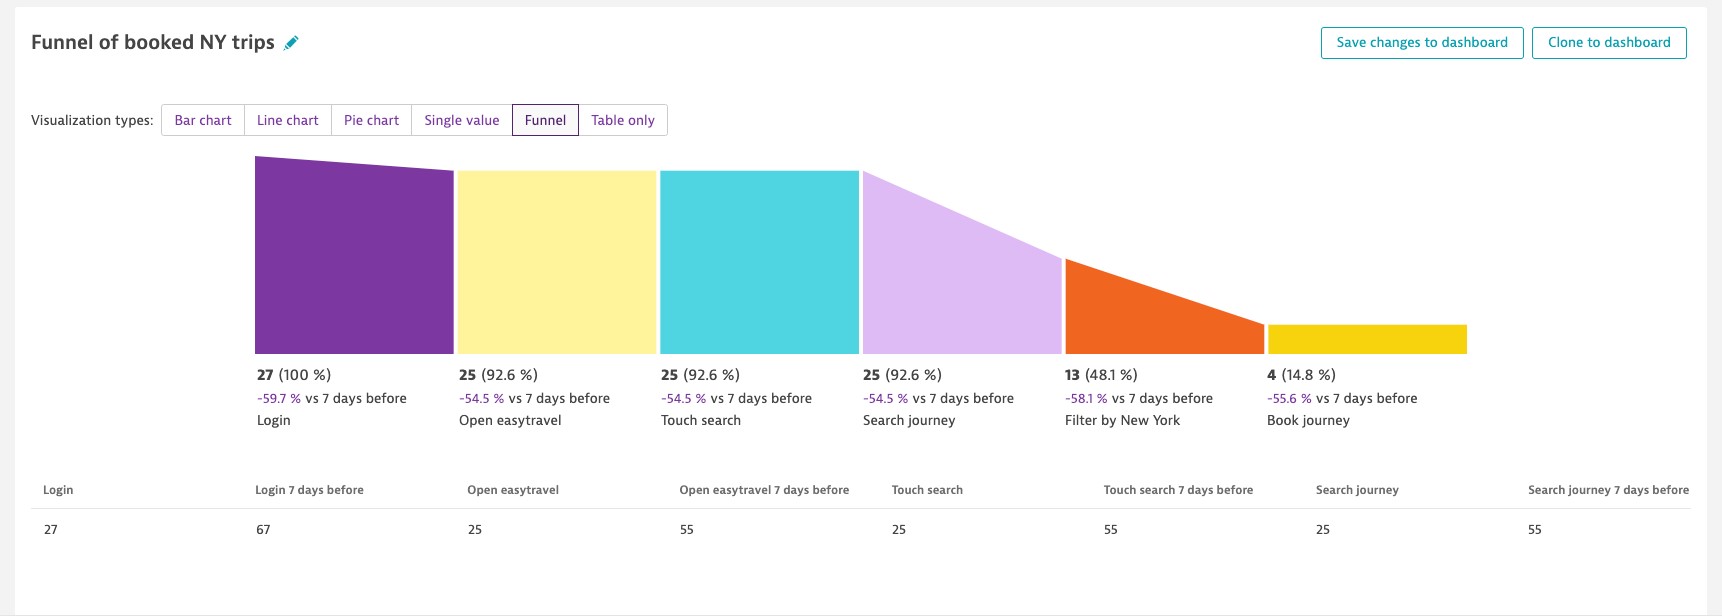
Discover patterns by comparing funnels from different time periods
Funnel charts don’t merely show you where most of your users stop their journeys in your app. By comparing funnels from different time periods, you can see if these drop-offs are consistent or just a temporary anomaly. Also, by making a quick comparison across time periods, you can see how your improvements affect user journeys over time.
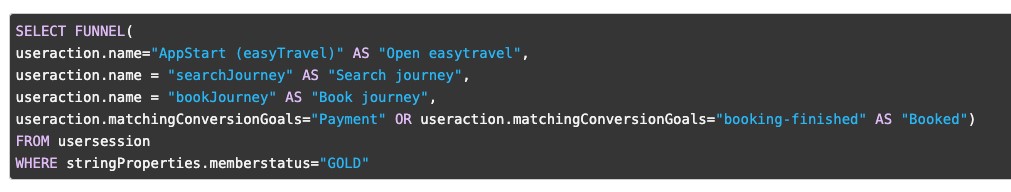
Filter by member status to ensure that your premium members have a perfect software experience
To optimize the experience of your customers that have premium member status, you may be interested in seeing how they experience your app. To find this out, just filter for that specific segment using session properties.
Summary
A poorly laid-out home page, confusing navigation, or a broken link in your application can make the difference between you or your competitor getting a sale. With funnel charts, you can understand exactly where your users are stuck in their journeys through your application. Based on this analysis, you can then remove obstacles and implement the right strategies to help them move forward and successfully complete transactions, and thereby ensure your digital business success.
Start a free trial!
Dynatrace is free to use for 15 days! The trial stops automatically, no credit card is required. Just enter your email address, choose your cloud location and install our agent.


Looking for answers?
Start a new discussion or ask for help in our Q&A forum.
Go to forum