
Java enterprise performance

Start your free trial now!

About this eBook
Performance is a topic of increasing importance for anyone who uses applications to support their business activities. Today performance engineers and architects as well as operations people have to ensure that complex application landscapes work seamlessly and problems are resolved fast and with minimal effort.
This book contains over 70 years of application performance knowledge. We, the authors have worked in this field building large scale applications and more recently application performance solutions. In addition we have developed numerous training courses, work closely with IT practitioners implementing application performance monitoring (APM) solutions and processes, and we are regular speakers at software conference on performance-related topics.
Our goal is to provide a reference book for people like us, who are passionate about application performance and work daily on improving it. We found that while there are a lot of books about performance, a definitive reference text for day-to-day performance management is not available. We want to provide exactly this reference, where you can lookup information and quickly find the answers to your problems.
Java enterprise performance is split into four sections so you can easily find the material you are looking for.
Table of Contents
Application Performance Concepts
Memory Management
How Java Garbage Collection Works
The Impact of Garbage Collection on application performance
Reducing Garbage Collection Pause time
Making Garbage Collection faster
Not all JVMS are created equal
Analyzing the Performance impact of Memory Utilization and Garbage Collection
The different kinds of Java memory leaks and how to analyze them
High Memory utilization and their root causes
Classloader-releated Memory Issues
Performance Engineering
Virtualization and Cloud Performance
The authors
 Chief Technology Strategist
Alois Reitbauer
Alois is Chief Technology Strategist of Dynatrace. He is fanatic about monitoring, DevOps and application performance. He spent most of his professional career in building monitoring tools and speeding up applications. He is a regular conference speaker, blogger, book author and Sushi maniac.
 Sr. Technical Product Manager
Michael Kopp
Michael is passionate about three things: Rock climbing, physics, and performance. He has worked in performance monitoring and optimizations in enterprise environments for the best part of the 10 years. Now, as a Product Manager, Michael is doing his best to build his previous experience into Dynatrace.


 Director Technology Strategist
Klaus Enzenhofer
Klaus is a Senior Technology Strategist in the Innovation Lab at Dynatrace. Klaus influences the strategic direction and development of digital experience management solutions. He has deep experience gleaned from years of developing and running large scale web and mobile applications for online businesses.
 DevOps Activist
Andreas Grabner
Andi Grabner has over 15 years’ experience as an architect and developer in the Java and .NET space. In his current role, Andi works as an advocate for high performing applications in both the development and operations areas. He is a regular expert and contributor to large performance and DevOps communities, a frequent speaker at technology conferences and regularly publishes articles on the Dynatrace blog.


Check out other e-books
We offer several premium e-books on aspects of modern observability.
 EBOOKDeveloping an AIOps strategy for cloud observability
 EBOOKState of SRE Report
 eBookThe next generation of cloud application security
 eBookUnpacking DevOps and platform engineering in a cloud-native world
 eBookPlan, execute and monitor your cloud migration for sustained success
 eBookAIOps done right: Automating the Next Generation of Enterprise Software
 eBook5 Key considerations for monitoring Google Cloud
 eBookUpgrade to advanced observability for answers in cloud-native environments
 eBook5 Key considerations for monitoring VMware Tanzu
 eBookFive Key Considerations for Cloud Monitoring
 eBook: Understanding Node.js performance
 eBookFive Key Considerations for AWS Cloud Monitoring
 eBook5 Key Considerations for Monitoring Microsoft Azure
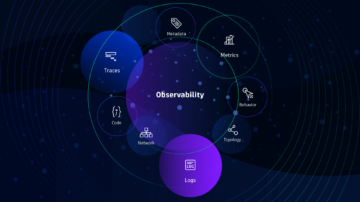 eBookExtending the pillars needed to achieve advanced observability
 eBook: Five Key Considerations for Monitoring OpenShift
 EbookOpenTelemetry and the opportunity for intelligent observability
OpenTelemetry is an open source observability framework for cloud-native software that was created from the merger of the OpenTracing and OpenCensus projects.


