
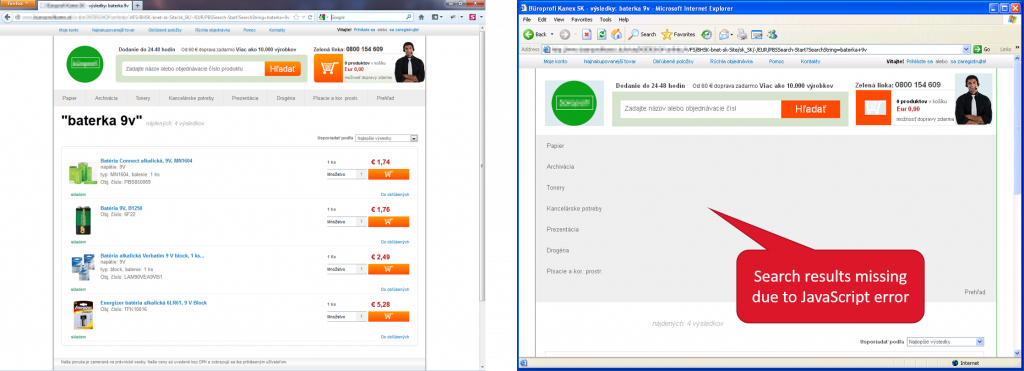
These days we are moving more and more logic towards the user into the browser to achieve higher performance and better user experience. There are Single Page Application frameworks like AngularJS, React, Ember and others supporting this trend. If it works, everything is fine. But with this trend a JavaScript error can become a website killer. What does this mean? Below you can see the same page twice, but depending on the browser used, you get a product list from which you can make a selection…or NOT! The difference is the result of a simple JavaScript error!
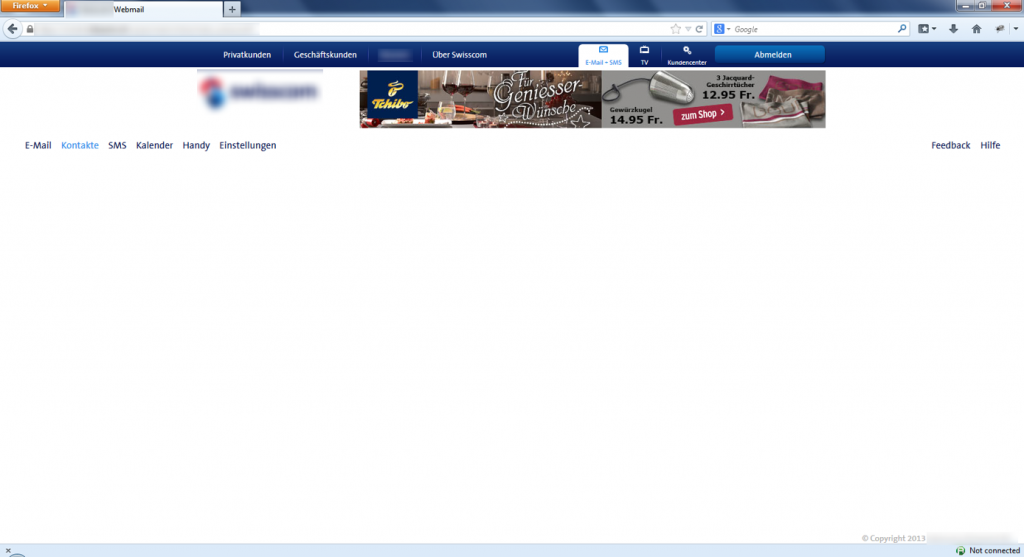
Here is another example of an online email interface showing a list of contacts, or in this case NONE, due again to a simple JavaScript error. JavaScript errors today can ruin the user experience of a web applications.
But having found the page showing the problem is is a significant step toward solving a JavaScript error. What happened before would be a long investigation triggered by the occasional customer complaint actually received. Why a long investigation? Because the input obtained from support often looks like this:
“Customer XYZ is not able to click on the product in the search list. He is using his Android phone”
This information is not useful in finding the problem and fixing the JavaScript error. This will probably lead to another ticket that will close with “Cannot reproduce!” after the team tries the most common browsers, some click combinations, and maybe different search terms. It is frustrating and neither you nor the customer ever get a solution. So how can you get out of this frustrating “JavaScript error” cycle?
Step 1: Get visibility into JavaScript errors
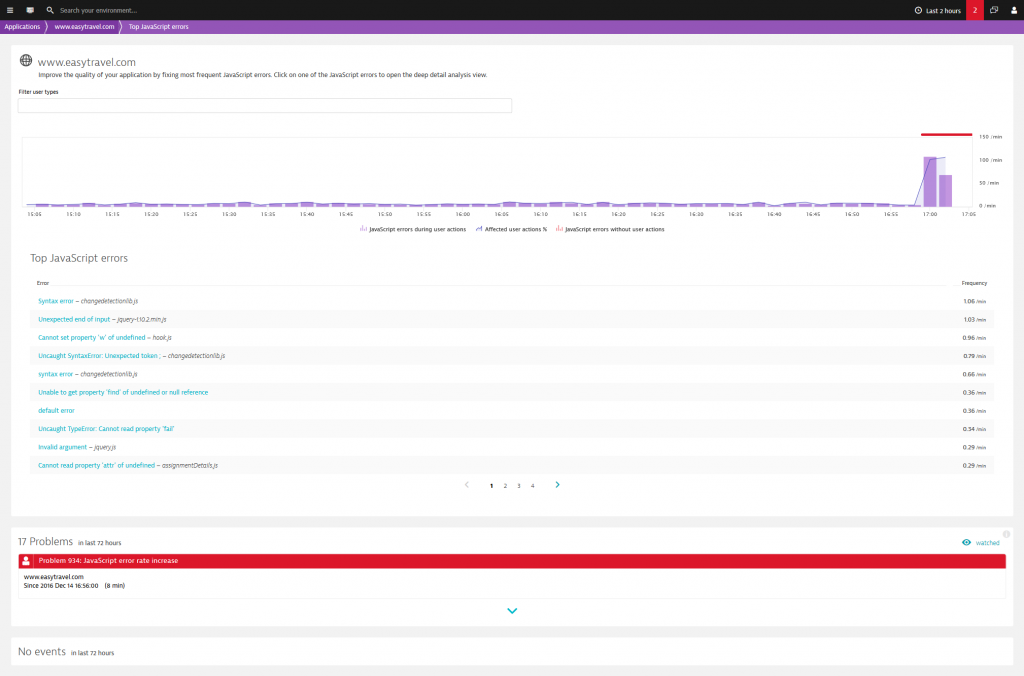
Real User Monitoring solutions like Dynatrace today can capture all users and all their interactions on a page. They can also capture JavaScript errors, providing an overview of all errors occurring on a web application. With the impact today’s JavaScript errors have, this insight is mandatory for operating modern web applications. It allows you to see the impact of new app version deployments and if changes to third-party JavaScript libraries are causing issues. In screenshot below, we can see that the application is massively impacted with ~100 JavaScript errors/min after a new version of the app was deployed.
Step 2: Narrow down the JavaScript error play ground
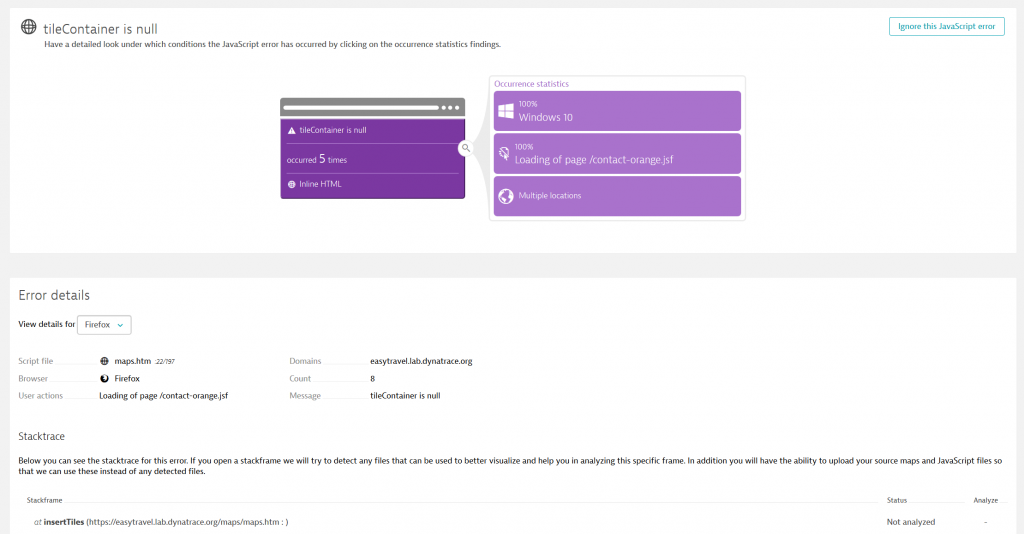
Even better than simply having the JavaScript error count helping us to prioritize which issue to fix first, is automatically obtaining a narrowed down environment for the JavaScript errors. This allows us to immediately determine on exactly which page the error occurs, if there is a specific location, or a specific operating system impacted as seen in the example below.
This is already a great insight that would have made my day years ago, but now let’s get super fancy in the year 2017!
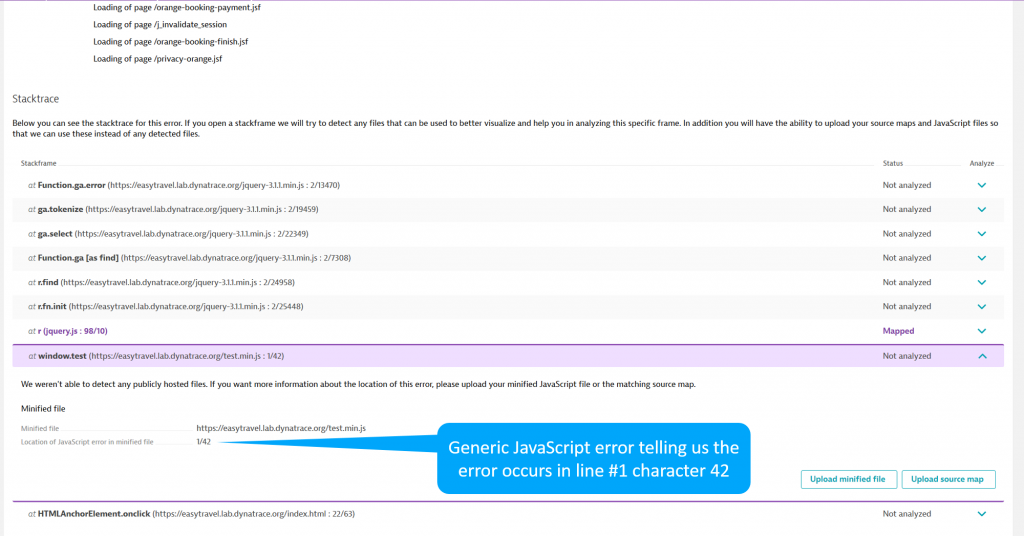
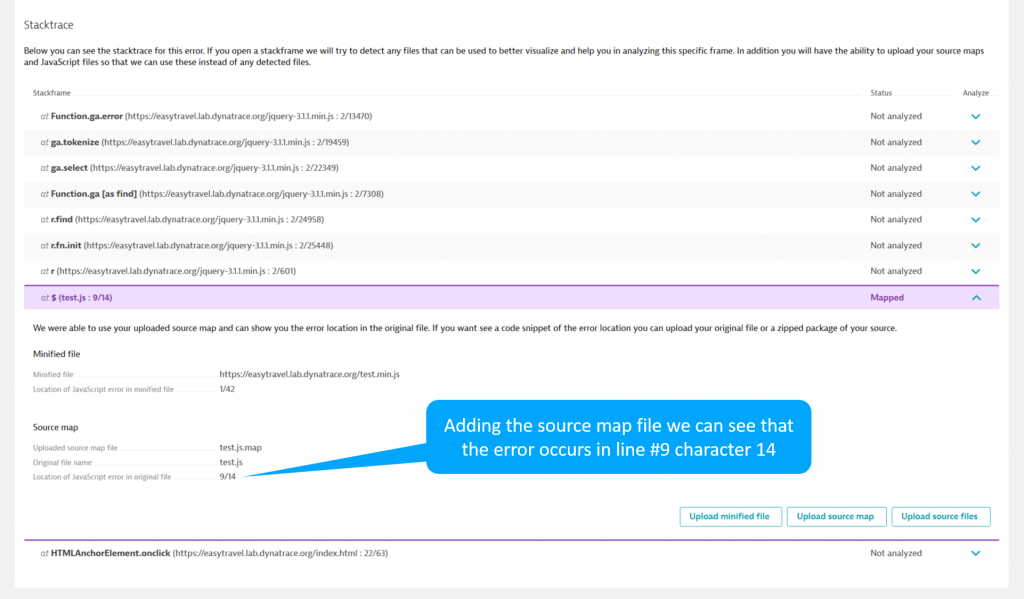
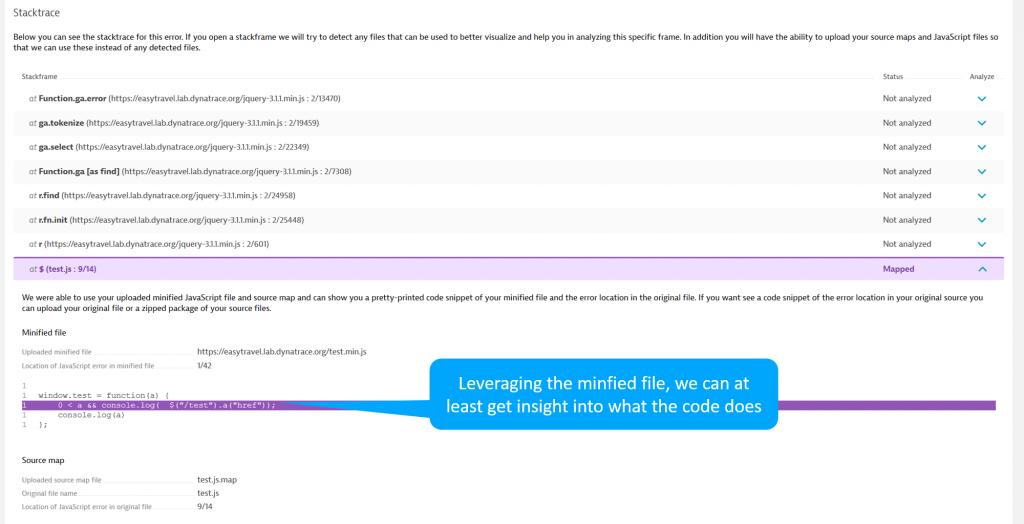
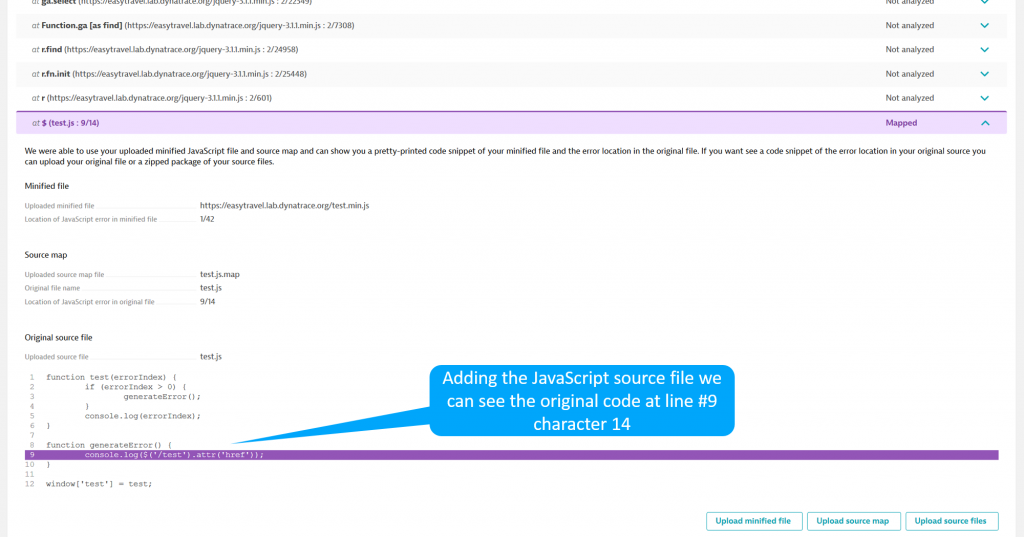
Step 3: Make the JavaScript Stack trace human readable (Source Maps)
Since we are minifying for better performance, our JavaScript files become unreadable once deployed. Source map files help developers figure out what the original code looked like. For more information about source map files review this blog. To help developers leverage those capabilities for Real User Monitoring (RUM) and fix errors faster, Dynatrace allows you to upload the source map files, automatically generating a human readable JavaScript file. The below example shows how this looks in the product where step by step we are getting more visibility depending on availability of Source Maps, minfied JavaScript files or the original source file.
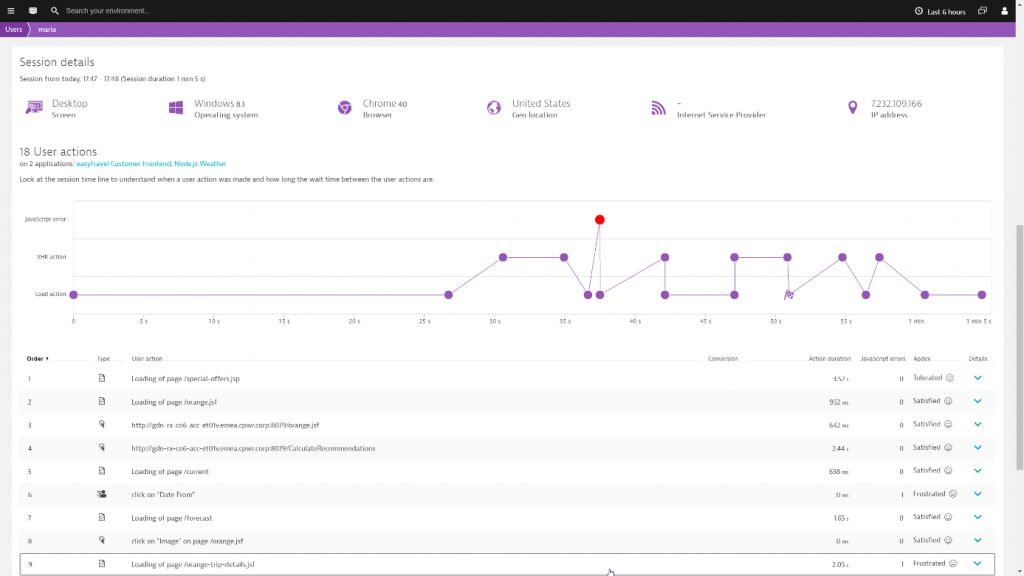
Step 5: Reproducing the JavaScript error leveraging the user’s clickpath
The final step to get to the bottom of a JavaScript error is to reproduce the error. This can be tricky, and is where Dynatrace user session tracking supports excels. In addition to the specific JavaScript error instance, it allows you to obtain the user journey with the click steps leading up to the error. The screenshot below shows such a journey where, after the first five steps, the user had a JavaScript error.
Conclusion
Today JavaScript errors are impacting web applications more than ever. The good news is that being proactive and reducing the number of JavaScript errors is easier through improvements to real-user monitoring. By reducing the number of JavaScript errors, you can improve the user experience and make your day easier by not having to chase JavaScript errors without context. This will hopefully free up enough time for you to do fun things like develop cool new capabilities into your web applications. As always, if you want to get started check out Dynatrace Real User Monitoring today.


Looking for answers?
Start a new discussion or ask for help in our Q&A forum.
Go to forum