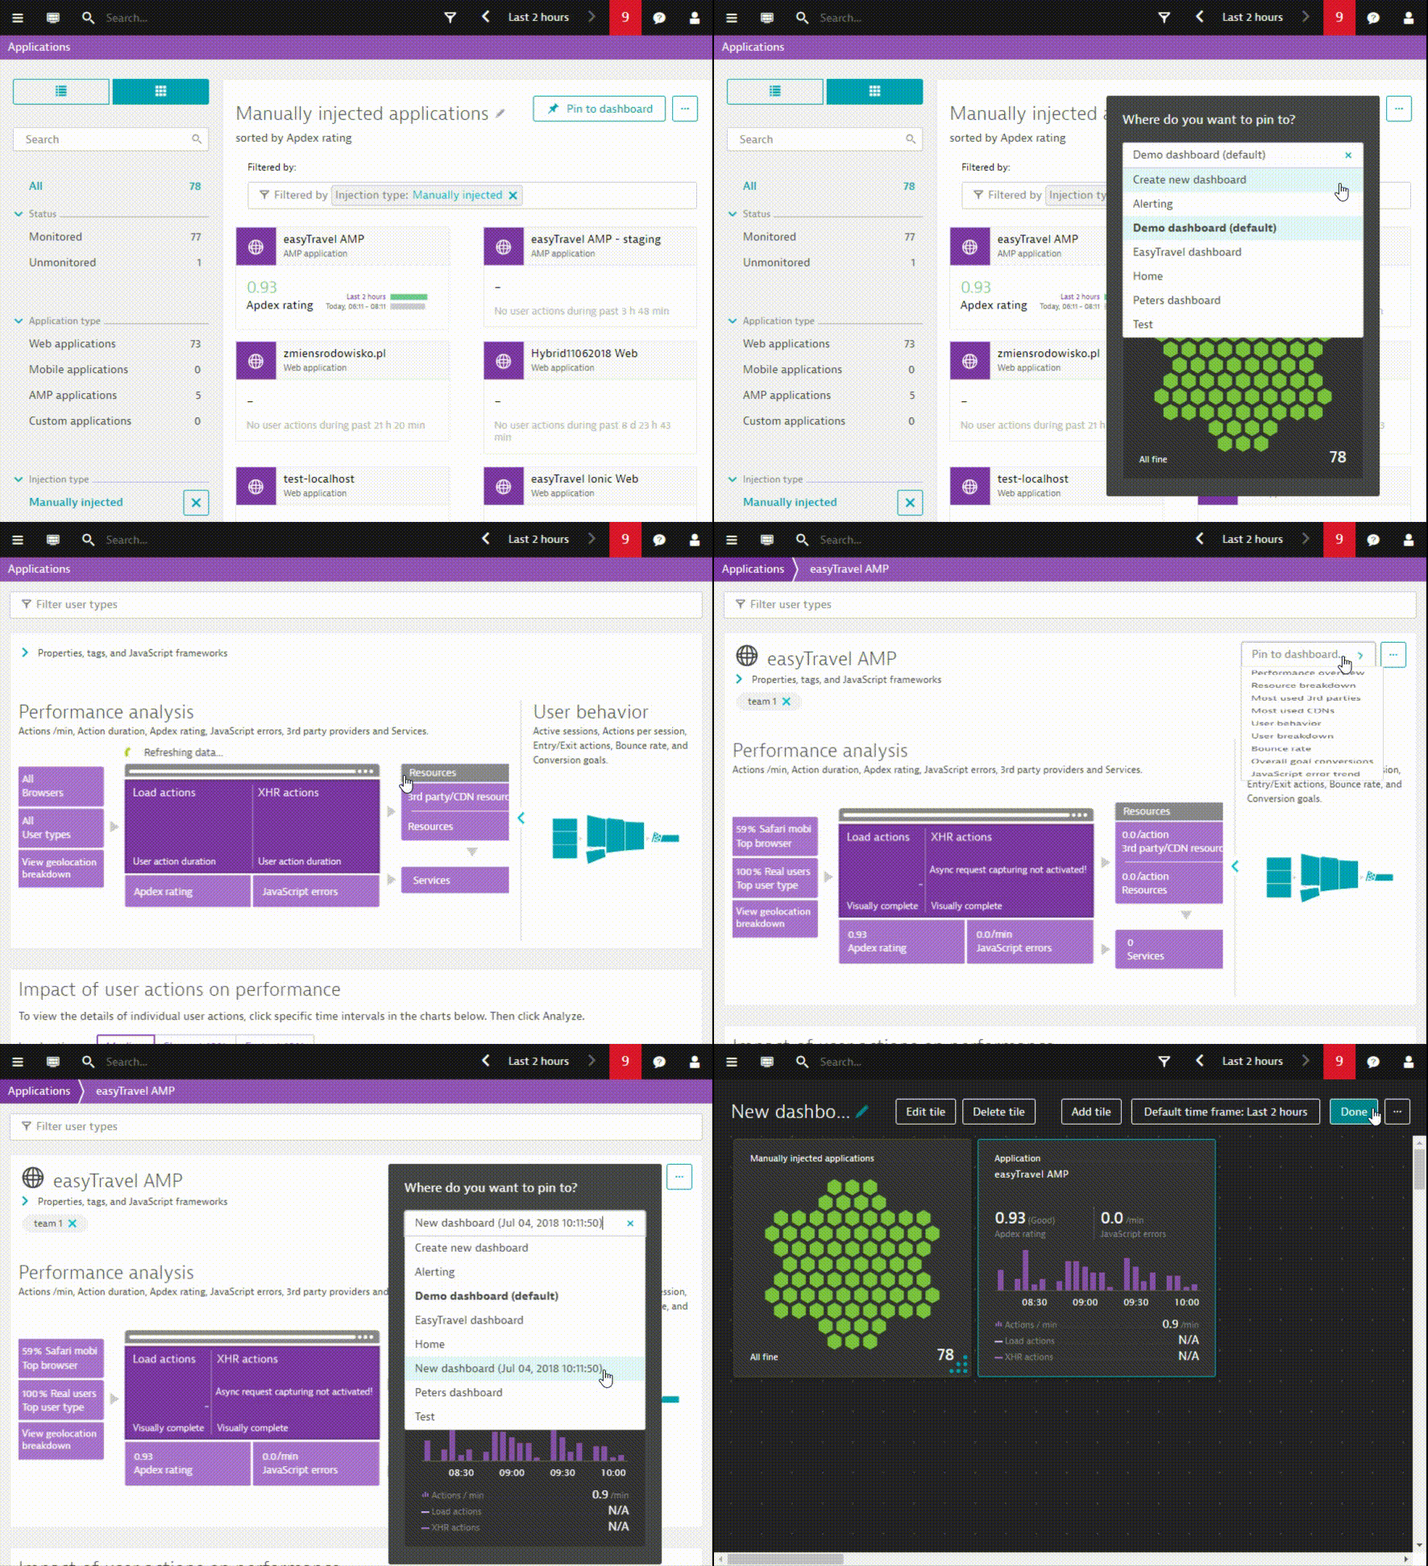
While the dashboarding team’s primary focus at the moment is improving charting capabilities, we haven’t stopped investing in new dashboarding features. In this latest post in our blog series on dashboarding enhancements, we’re happy to announce newly enhanced “pin to dashboard” functionality.
Pin charts & tiles to specific dashboards
To date, charts and tiles were automatically pinned to the most recently viewed dashboard, with no way for the user to intervene. This significant limitation has now been fixed. With Dynatrace SaaS version 1.150, you can get a flexible overlay wherever you can pin a chart or other visualization to a dashboard. This overlay provides three new features:
- When pinning a new chart or tile, you can select an existing dashboard or create a new one.
- Preview the tile before effectively pinning it to a dashboard, to ease the transition from in-product visualization to dashboard tiles.
- Once a tile has been pinned, you can opt to remain in the same context or open the dashboard for further editing.
We’ll keep working to further integrate the “pin to dashboard” feature to at some point being able to pin all charts across screens in Dynatrace to dashboards. While accomplishing this entirely may take a while, we’ll continue to provide you with greater degrees of dashboarding flexibility.
What’s next
Be sure to check out our forum post that explains additional planned enhancements for custom dashboards.
Here are upcoming highlights that we plan to add to our charts in the near future:
- Default management zone
- Pie charts
- Custom colors for charts


Looking for answers?
Start a new discussion or ask for help in our Q&A forum.
Go to forum