
Whether it’s your TV, audio system, digital home assistant, or refrigerator chances are those devices run an operating system such as Android allowing you access to the device’s features through apps. Hubi is one of those SmartTV boxes from DNA, one of Finland’s telecom providers. DNA is currently working on the next generation called Hubi 2.0 and, just like other software or hardware products, DNA runs internal testing groups where employees can beta test new devices and give feedback so that any annoying usability issues are addressed before hitting the mass market.
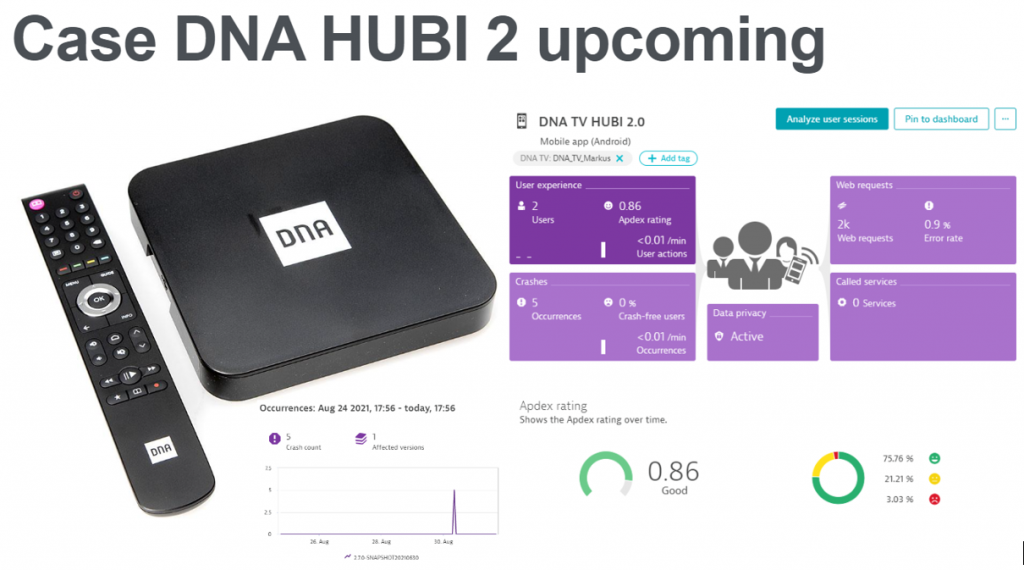
Markus Leiman, Development Manager at DNA, is one of those beta testers who identified a crash of Hubi when navigating through the TV Channels in a certain order. I was lucky to meet Markus at our recent AIOps Forum in Helsinki, where he talked about how DNA is transforming their IT by investing in the observability of their complex IT systems and leveraging automation to bring the right data to the right people to make better and faster decisions. During his presentation, he also talked about how he transformed the feedback process for Hubi 2.0 using the process shown in the image below which triggered my desire to write this blog post about observability for smart devices and how Dynatrace helps.
So – what’s the full story behind this and what can we learn from the power of observability for smart devices? I sat down with Markus to walk through his full story so I could show you all how easy it is to bring observability to your apps.
Modern mobile observability optimizes feedback loops to app developers
Markus could have just started a conversation with his developers saying “My Hubi is crashing when I click through the channels in the following order”. But instead, he decided to instrument Hubi’s TV android app with the Dynatrace Mobile Agent because he wanted to capture actionable crash details to present to the developers.
To instrument the app, he reached out to one of the app developers and pointed him to the Dynatrace Mobile app instrumentation documentation. Within ten minutes he had an instrumented version of the app ready to be installed on his Hubi 2.0.
Walking through his channel and switching test scenario resulted in the same crash he experienced before, however now Dynatrace was capturing all the details of his user session and each user interaction, including the full crash details as you can see in the following sections:
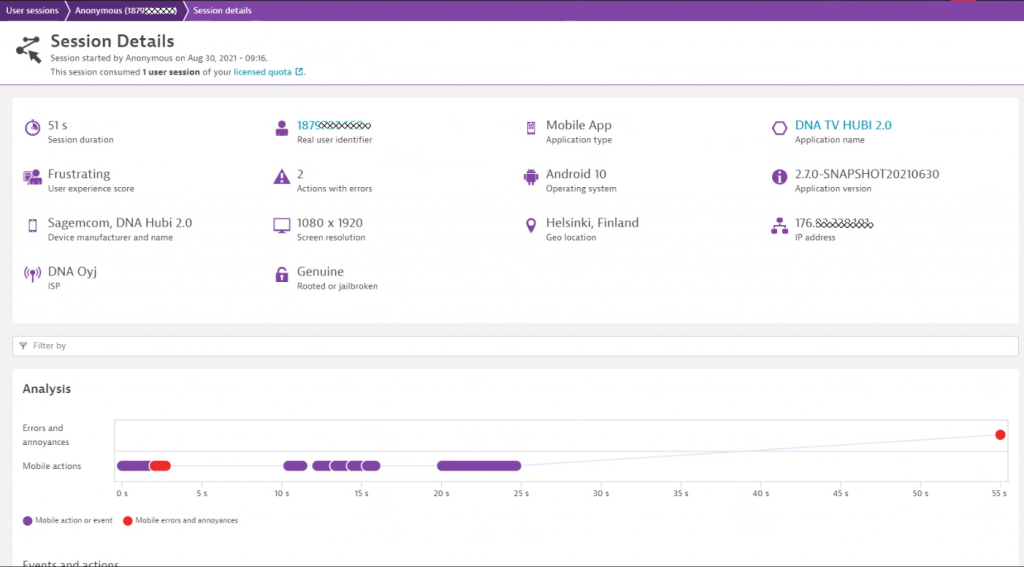
1. Details about the device and end-user
Crashes sometimes happen because of a specific combination of hardware, software and the environment (e.g., network connectivity). Dynatrace captures user session details that include all this relevant information to better understand the context.
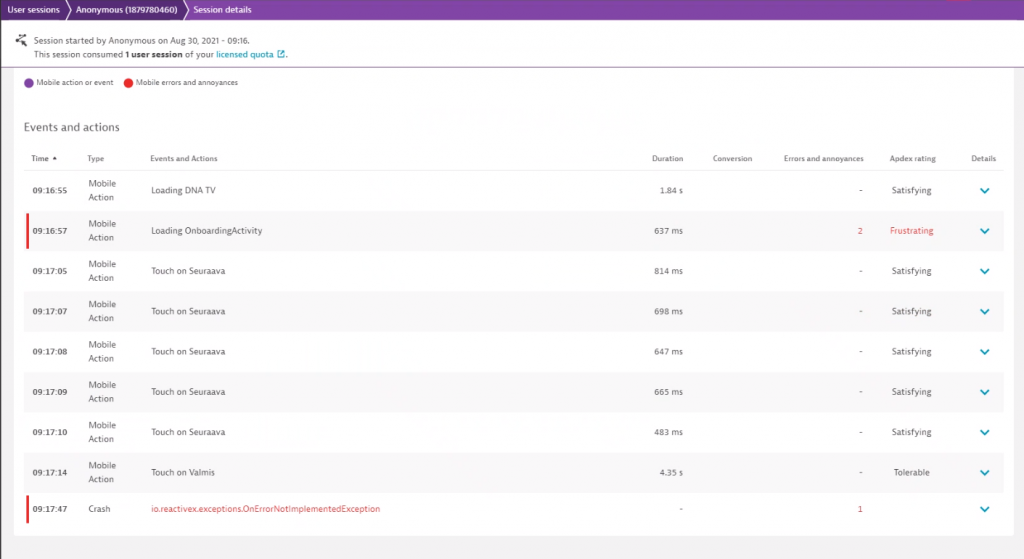
2: Details about every action taken until the crash
There are many ways to navigate through an app, and Dynatrace automatically captures every user (inter)action which makes it easy to understand how the user ended up at a certain state in the application.
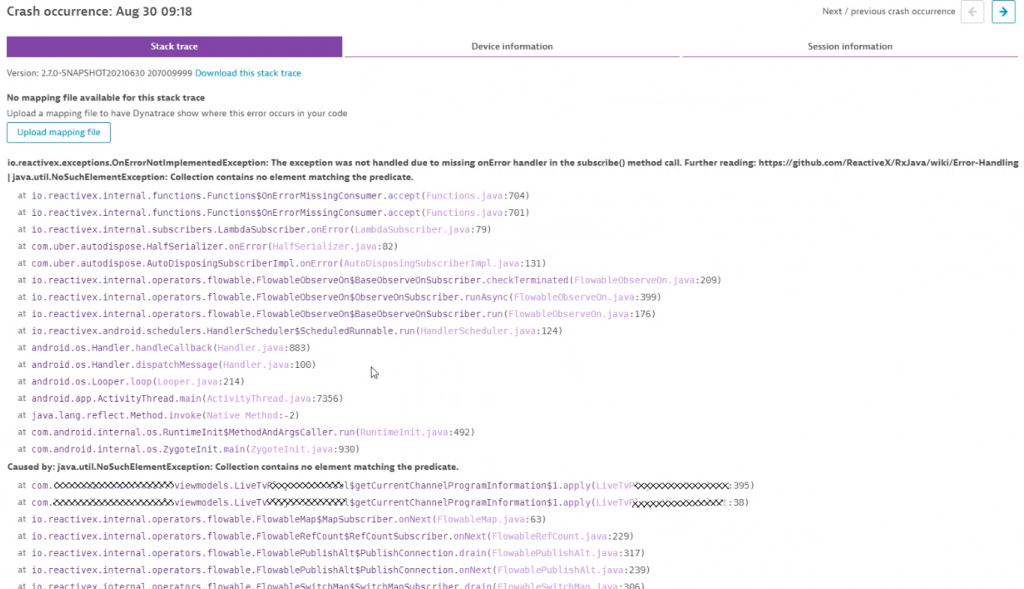
3. Crash details with full-stack trace
When it comes to crashes, Dynatrace captures full-stack traces as shown in the following screenshot. This information is what allowed the developers at DNA to immediately understand that Markus hit a “blind spot” in their implementation.
Saving precious time for developers
Instead of saying “My Hubi crashed” Markus was now able to say “My Hubi crashed and the root cause is a missing error handler in your app code because when navigating through the channels the preview information for channel 250 is missing. It’s on line 395 as you can see from the following stack trace”. Now that’s AMAZING DETAILS developers love as it avoids lots of back-and-forth chat messages like “Can you try this or that?”, “What if you do this?”, or “Are you sure this is the way you ended up here?”
The screenshot below displays the conversation Markus had with his team, and is proof that he really shared the Dynatrace captured stack trace:
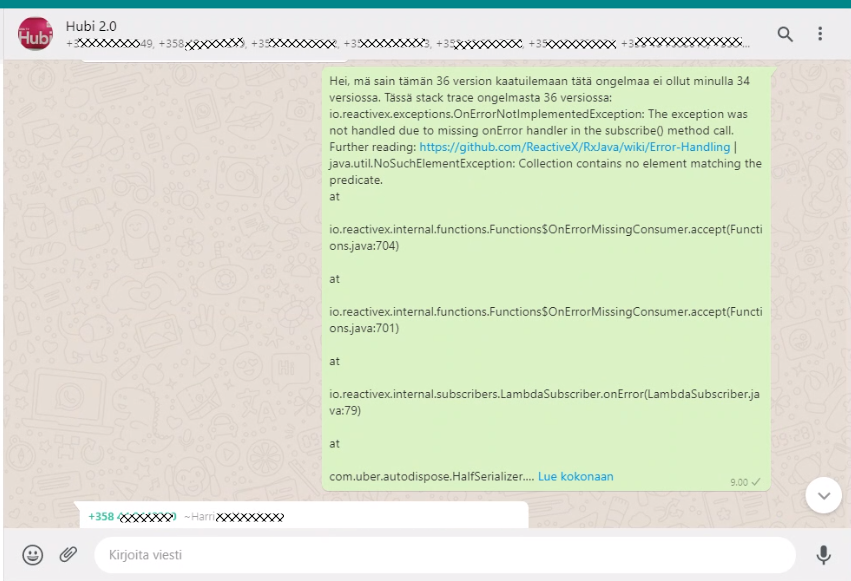
The crash details showed the developers that Markus indeed identified a regression that was introduced in the latest app version. To continue his testing immediately they suggested rolling back to a previous version until they could fix the issue identified.
Proactive optimization and not just bug fixing
Besides fixing obvious crashes, Dynatrace captured more important data allowing developers to proactively optimize user actions. Markus showed me the screenshot below where requests to the backend Media API endpoint were aborted as the backend system actively closed connections when downloading that content. Not downloading those media files doesn’t result in a crash, but it does result in end-users not seeing all the content they expected to see when navigating through the Smart TV App, which is not what developers want to happen:
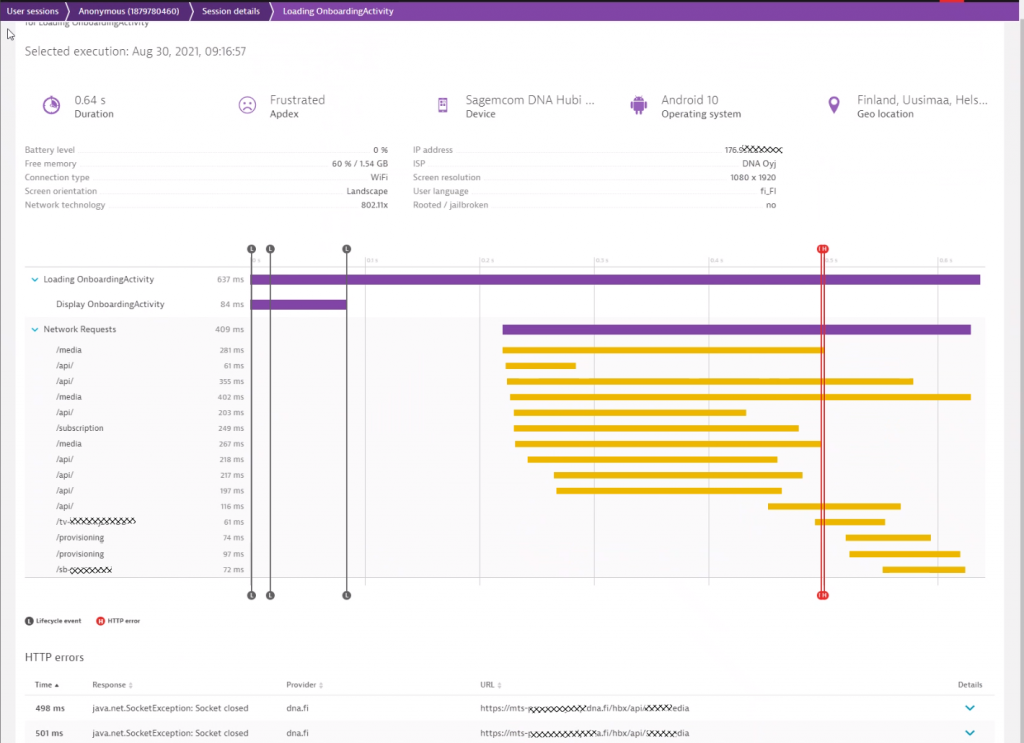
Insights as shown above presented to developers or the teams responsible for the backend systems allow all teams responsible for delivering great user experience to optimize their respective systems under control.
You are next: Transform “your DNA”
When Markus talked about DNA transforming the way they operate in IT, this example is proof that this transformation truly pays off. And, while Dynatrace is a great platform that enables this transformation it takes people like Markus and their initiatives to drive this change.
If you want to experience Dynatrace yourself, just sign up for our Dynatrace Free Trial. If you also deal with mobile applications – whether they run on a mobile phone or smart device – then also check out my performance clinic on Instrumenting Mobile Apps with Dynatrace.


Looking for answers?
Start a new discussion or ask for help in our Q&A forum.
Go to forum