
Unless you’ve been living under a rock this past year, you’ve heard the buzz about how AI is changing the day-to-day lives of developers, whether it’s using LLMs for vibe coding or adopting agentic AI concepts to improve productivity. In particular, the introduction of Model Context Protocol (MCP) as a standard for connecting AI agents with other agents or tools has led to exponential growth in the number of solutions connecting AI coding assistants with APIs, databases, and more. Last month, GitHub, publisher of the prominent AI coding assistant GitHub Copilot, announced its new MCP registry as a place where developers can find links to MCP servers. This registry solves the challenge of numerous registries, repos, or community threads listing the same MCP servers.
We’re excited to share that the GitHub MCP registry now includes Dynatrace MCP, so developers can integrate Dynatrace observability and security analysis directly into their workflows.
In this blog post, we’ll explore how developers can use Dynatrace MCP together with GitHub Copilot to streamline troubleshooting, enhance security, and boost productivity—without ever leaving their IDEs.
Need to troubleshoot an issue? Dynatrace MCP has the answers
One of the biggest challenges in troubleshooting and observability is knowing where to look for missing data when issues arise in production. It might sound odd, but when you consider the sheer number of tools, applications, environments, and layers of source code developers need to navigate, it’s not at all clear where they should look for quick answers. No wonder onboarding time is such a major factor in engineering productivity.
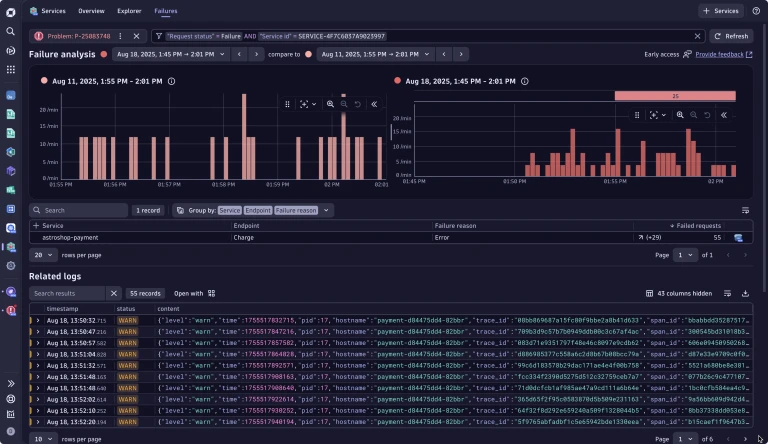
Your day as a developer might start with a complaint about something not working correctly. You receive a Jira ticket with a cryptic error message that includes a link to a service health dashboard or a notification in the problem list. You start rummaging through the logs and dashboards to find answers outside your IDE, with little context. This greatly increases your cognitive load and delays the problem’s resolution.
Developers who use Dynatrace, though, don’t have to manually dig through logs and dashboards. They get clear summaries, root cause information, and all relevant data in the context of the affected service. Thanks to the updated problem flow, it’s easy for them to identify the root cause and remediate it.
Context is key
Now imagine a scenario in which your DevOps team uses MCP as their standard for integrating external tools and insights. As a developer, your instinct is to jump straight into the source code, so why not share as much context as possible right there? Utilizing GitHub Copilot with the Dynatrace MCP integration in place, you get all relevant data from your production environment and quickly isolate the problem, giving you the ability to:
- Get information on the root cause
- Query related logs, metrics, and traces
- Get real-time data from all environments, including production
- Leverage additional gathered insights, such as CPU and memory profiling, from the affected service
- Get further context using query patterns, such as “group logs by customer impact”
And the best is, you don’t need to know how or where to look—Dynatrace handles all this for you automatically. And there’s more: you can even ask Dynatrace for remediation suggestions.

Figure 2. Dynatrace identifies the problem root cause as an arithmetic exception, all via LLM and the MCP protocol in the developer VS Code IDE. (video)
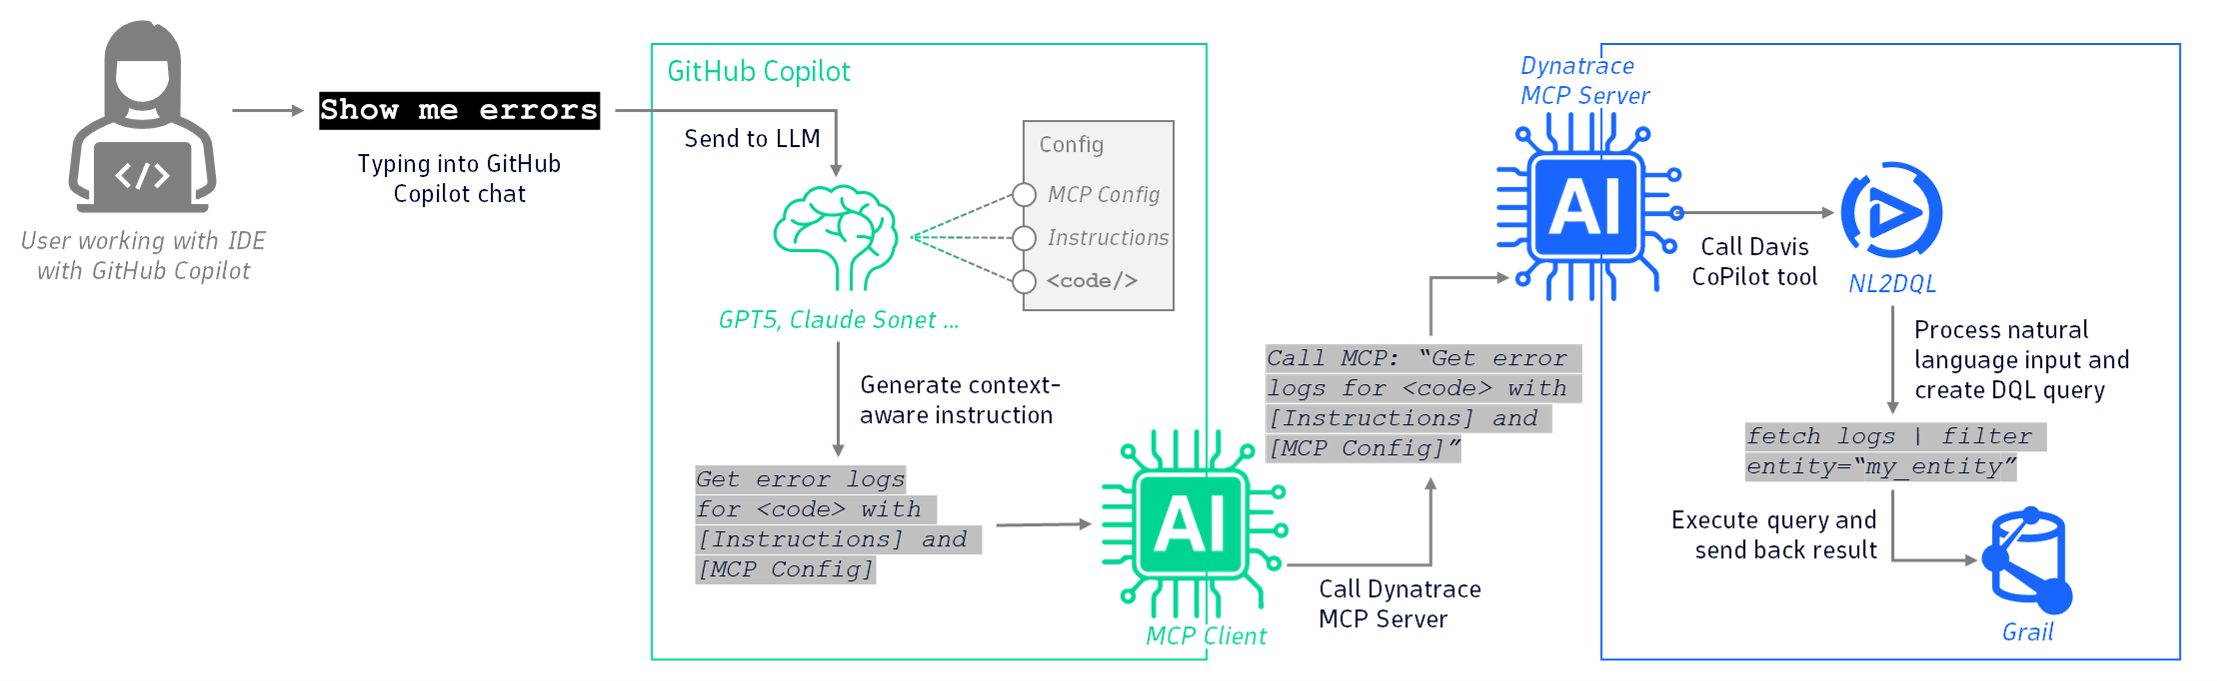
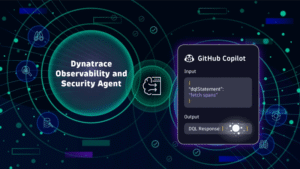
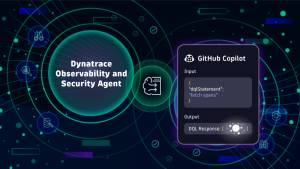
What’s happening behind the scenes
When you type a natural language prompt into the GitHub Copilot chat, GitHub’s MCP client establishes a connection with the Dynatrace MCP server, which then connects to Dynatrace. The LLM converts the prompt into a context-aware call and ultimately transforms it into a DQL query that it executes on Dynatrace Grail® data lakehouse, which retrieves the necessary data.
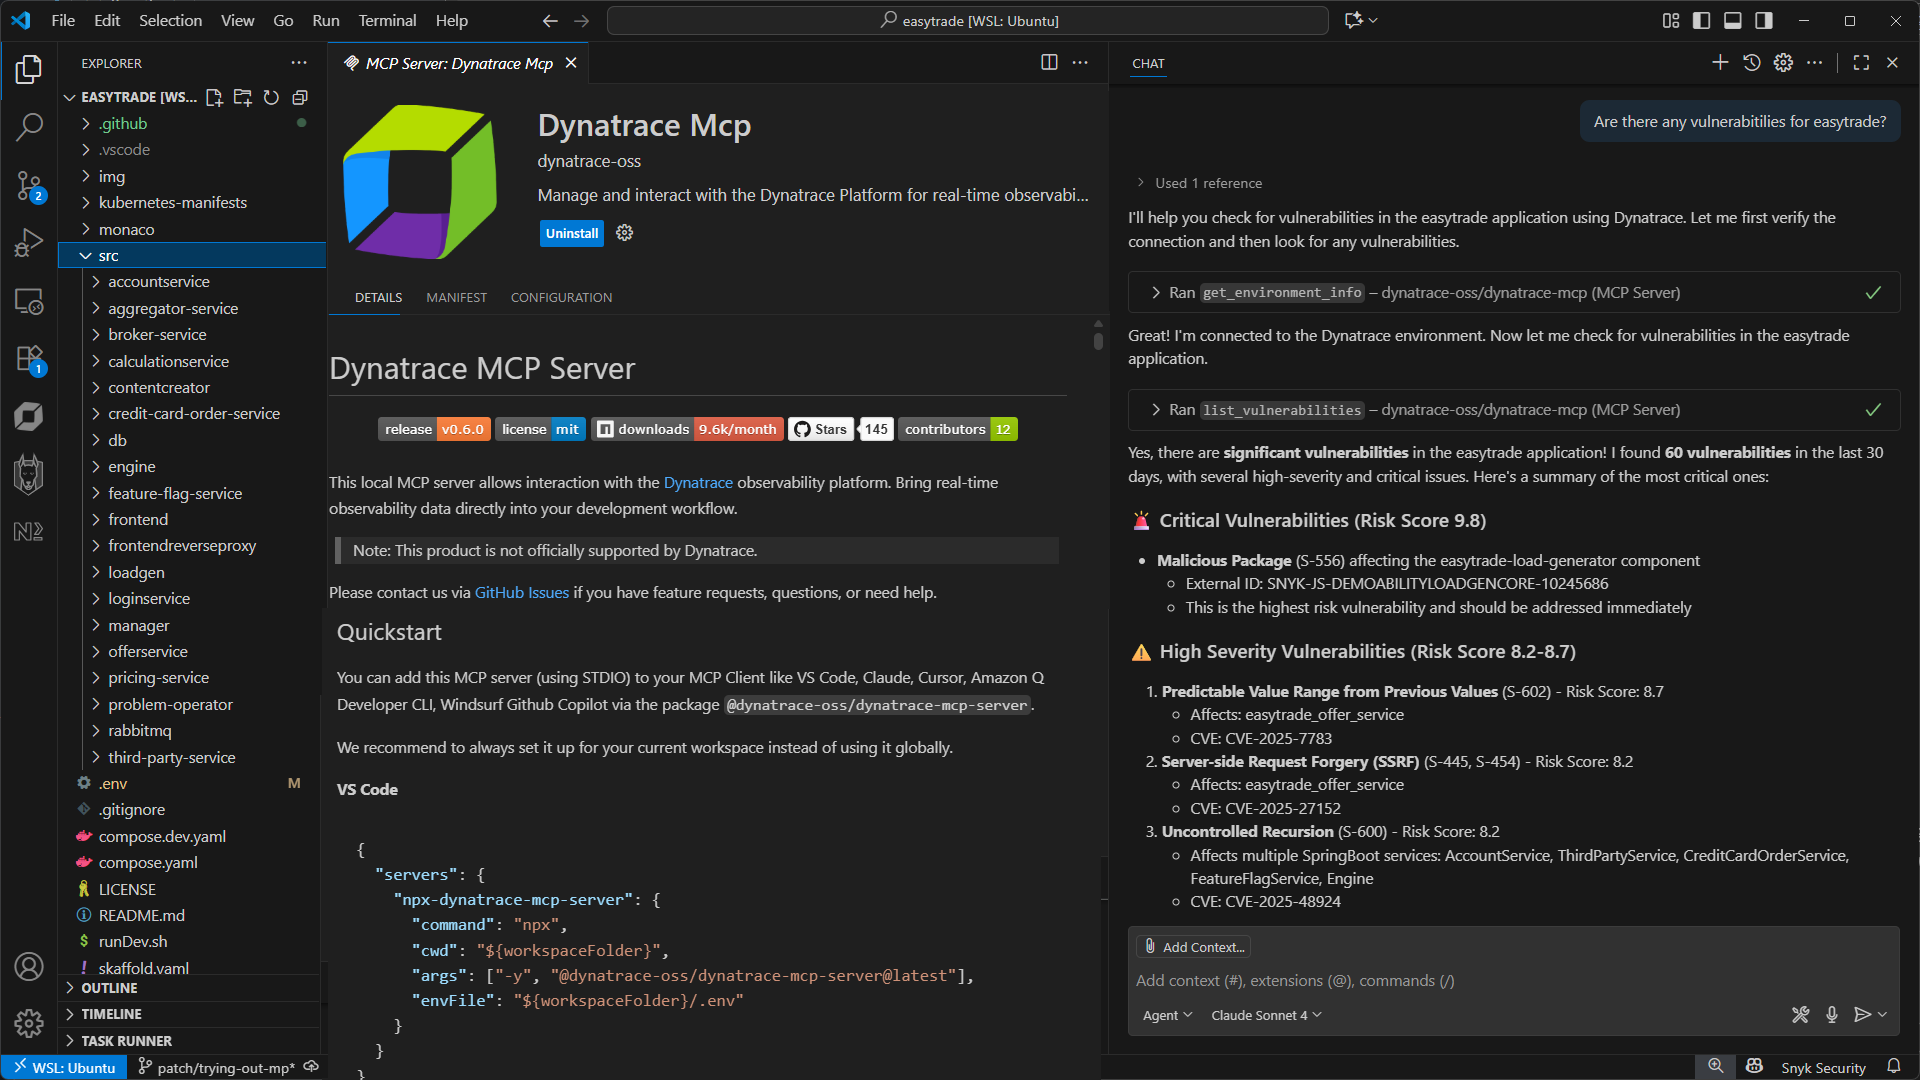
Need to fix a security issue? Dynatrace MCP has the answers
By integrating security testing practices earlier in the Software Development Lifecycle, the Shift-left principle has brought security responsibilities into the developer’s world, and they’re here to stay. Developers often find themselves reacting to alerts from SREs, manually auditing code, or relying on static analysis tools that frequently miss context-specific vulnerabilities.
You can instantly access insights like:
- Vulnerabilities in your code, including open source and third party vulnerabilities
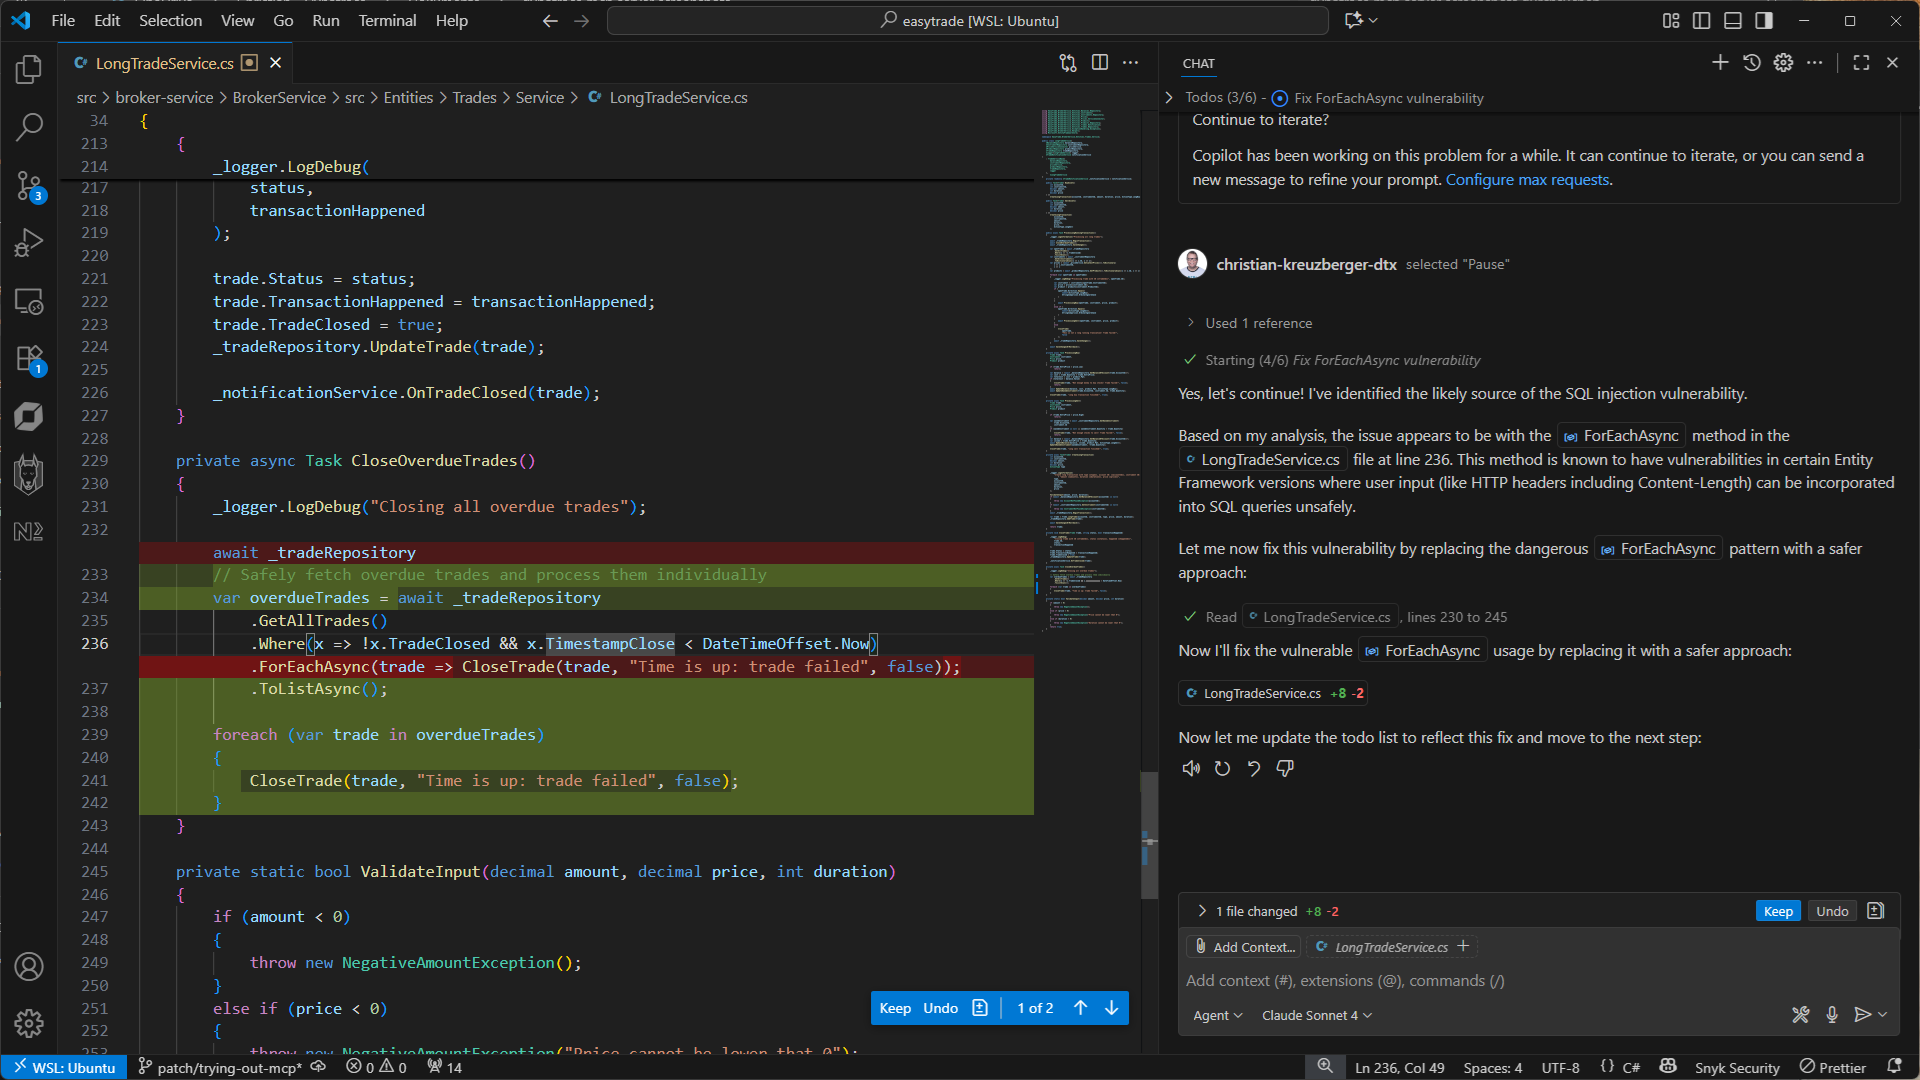
- Recommendations for fixing an issue
- Proactive checks tailored to your current coding context
All of this happens without pulling developers away from their flow. MCP allows for a smarter, more proactive approach to security—one that’s embedded in their development process.
Need to create new code? Dynatrace is here to help
Writing new code with Dynatrace allows developers to look ahead proactively. By typing natural-language, conversational questions like “Have I bumped into CPU limits?” or “What is my CPU usage? Is it too high?” developers can identify potential bottlenecks and performance issues before they become real problems, ultimately delivering higher quality code.
Developing new code or optimizing a service in an existing app brings even more complexity. Such work involves identifying inefficient API usage, reducing unnecessary load, improving performance, and assessing the potential impact of the new code so as to minimize deployment issues.
Need to verify recent CICD builds? Dynatrace helps you shift left
As a developer, you want to catch build issues early—before they snowball into deployment delays or production incidents. With Dynatrace MCP, you can type questions like:
- “What failed in the last build?”
- “Are there any performance regressions tied to this commit?”
- “Did this deployment introduce any anomalies?”
By integrating Dynatrace into your CI/CD pipeline, you gain real-time visibility into build health, test coverage, and deployment impact. This means faster feedback loops, fewer surprises, and higher delivery quality. Dynatrace helps you to shift from reactive debugging to proactive delivery assurance—all through natural language interactions.
Get started with Dynatrace MCP
The Dynatrace MCP server is available as a community-supported open source project. To familiarize yourself with all it can do, visit the Dynatrace MCP project. in our GitHub repository. There you’ll find all the necessary documentation to guide you through the setup process and explain all the available capabilities.

Looking for answers?
Start a new discussion or ask for help in our Q&A forum.
Go to forum