
Monitoring as Code is a concept to define what metrics (functional, performance, architecture) are relevant for applications, services, process, containers or infrastructure. One implementation of Monitoring as Code is what my colleague Thomas Steinmaurer and my friends Matthias Fichtner and Raphael Pionke, from T-Systems MMS, have coined “Performance Signature”. The Performance Signature is a list of metrics including important thresholds stored in a JSON or YAML file. This file gets checked in with your source code and gets automatically validated as your code moves through your Continuous Delivery Pipeline. The signature acts as an automated quality gate between your different stages (dev, test, prod) as well as allows you to validate your production deployments (blue/green, canaries, …).
Matthias and Raphael recently released their implementation of the Performance Signature for Dynatrace as a Jenkins Plugin (free for everyone to download in your Jenkins). I invited both to showcase their integration and the key use cases in one of my recent Performance Clinics. Watch it on YouTube, or simply hit the play button on the following video:
Benefits of Performance Signature
During the recording, I chimed into the conversation a couple of times, re-iterating the benefits of integrating monitoring into your delivery pipeline. At Dynatrace we have been doing it for years and we have seen this approach being implemented by many organizations that are re-platforming or re-architecting towards cloud native delivery pipelines. The key benefits from my perspective are:
#1: Monitoring data capturing de-coupled from analysis
Developers can write a simple JSON file that gets automatically validated without having to worry about how the data gets collected. This basically means “Monitoring as a Pipeline Service” or better “Monitoring as a Self-Service” through the concept of “Monitoring as Code”
#2: Performance Signature for all stages of the delivery pipeline
Developers can use it in the Dev Environment to get feedback on every code change. It can be integrated into the Pull Request Approval process before merging to master. It can act as Quality Gates between staging and production after executing your load tests. And finally, it can be used to get Real-Time Production Feedback on e.g: Blue/Green, Canary of Feature Flag releases!
#3: Versioning of approved performance signature per build/release
When a build is pushed through the pipeline the actual values captured while validating your Performance Signature can be committed back to your source code repo. This not only allows you to historically see the trend of your performance – but also allows you to push these accepted values as your new production baselines. In Dynatrace we provide REST APIs to define your thresholds for your service endpoints or even for resource consumption. We can make this part of the production deployment by applying the thresholds as defined in your source code repo to your production monitoring environment!
Implementation Guide for your Jenkins Performance Signature
While the performance clinic video, as well as the documentation on the Plugins GitHub page, should give you all the information you need to implement the Performance Signature for Jenkins yourself, I thought I would write a quick step-by-step guide to better understand the use cases & benefits.
Step 0: Understand the End-to-End Continuous Delivery Workflow, Integrations & Use Cases
I created the following animation based on what Raphael & Matthias showed in their tutorial. I additionally highlighted the individual workflow steps, integrations and when which use case comes into play:
While Raphael & Matthias used a Kubernetes Cluster in their demo this also works for any other platform such as OpenShift, CloudFoundry, ECS, Fargate, Docker and even your more “classical” Java & .NET stacks! Now let’s get through all of this step-by-step
Step 1a: Install Dynatrace OneAgents in your Environment
First step is to rollout the Dynatrace OneAgent in your environment. If you don’t yet have a Dynatrace installation, simply sign up for our SaaS-based Trial and follow the instructions to deploy the OneAgent on your Linux, Windows, Solaris or AIX machines. If you run on Kubernetes, OpenShift, CloudFoundry, Azure, AWS, GCP … simply follow the instructions in the Deploy Dynatrace OneAgent section. The OneAgent will automatically take care of FullStack Monitoring.
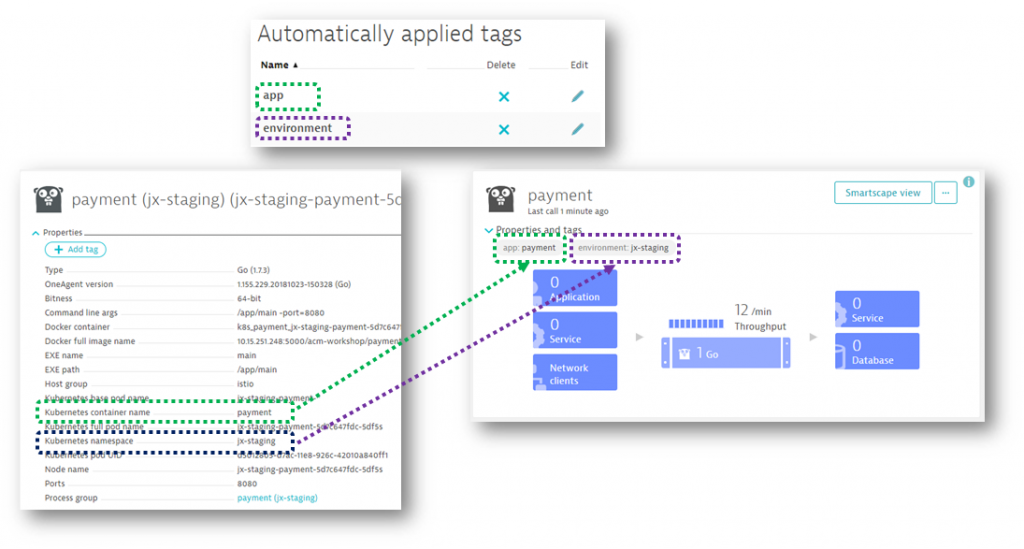
Recommendation: Dynatrace can automatically pick up tags & metadata from the underlying PaaS or SaaS platforms, e.g: Kubernetes Namespace, Container Names, CloudFoundry Organizations, … – If you need to pass more metadata or define your own tag rules check out my session on 101 Tagging Essentials with Dynatrace and the blogs from my colleague Michael Kopp on Tagging & Naming. In my personal environment I run k8s on GCP and I have configured automated tagging to create tag for environment (from the k8s namespace) and the app (from the container name). Following screenshot shows my payment app-service deployed in the jx-staging space – fully automatically tagged through the automated tagging rules:
Step 1b: Install the Jenkins Performance Signature Plugin
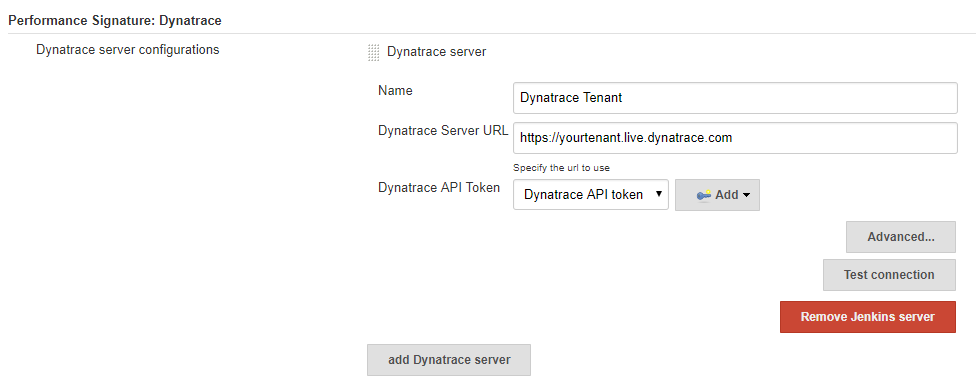
Install the Performance Signature: Dynatrace plugin it via the Jenkins Plugin Manager. In the global system configuration section in Jenkins configure the endpoint to your Dynatrace Tenant. This can either be a SaaS or Managed Tenant. All you need is your Dynatrace Tenant URL, e.g: https://YOURTENANT.live.dynatrace.com and a Dynatrace API Token which you can create in Dynatrace via Settings -> Integration -> Dynatrace API.
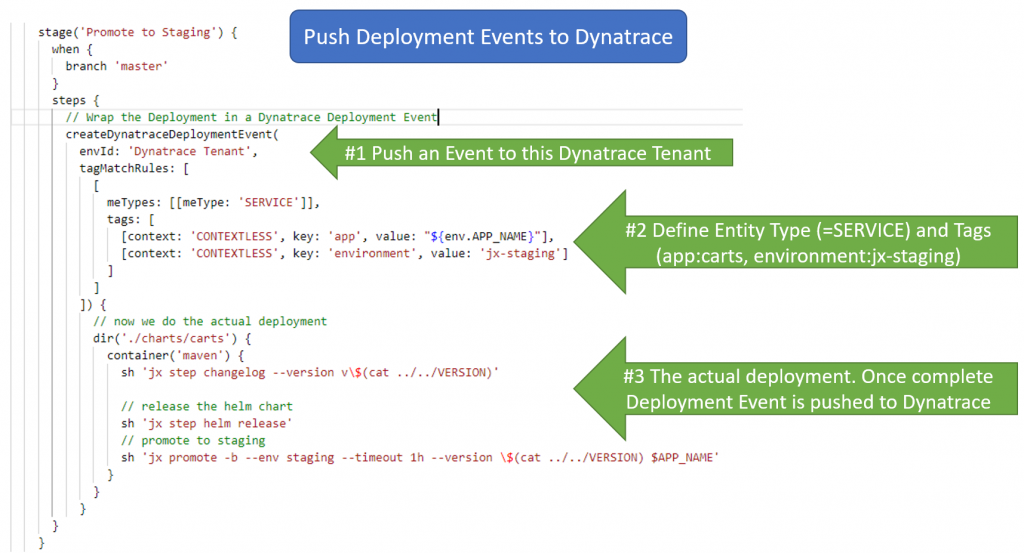
Step 2: Push Deployment Information to Dynatrace
In the Jenkinsfile find the stage where you deploy into a certain stage, e.g: Staging. Now simply wrap this deployment with a call to createDynatraceDeploymentEvent. This Jenkins pipeline step is provided by the Performance Signature plugin. It will measure the time it takes for the deployment and upon success will push a Dynatrace Deployment Event via the Dynatrace REST API. The event will be pushed to those entities that match the tagMatchRules. Therefore, it is important to have proper tagging setup as described in Step 1a. In the following example I deploy the carts app-service into the environment jx-staging. Here is the modified Jenkinsfile:
Once the pipeline runs, we see Dynatrace not only picking up Monitoring of the deployed services, we also see the deployment events on those service entities that are tagged with app:carts & environment:jx-staging:
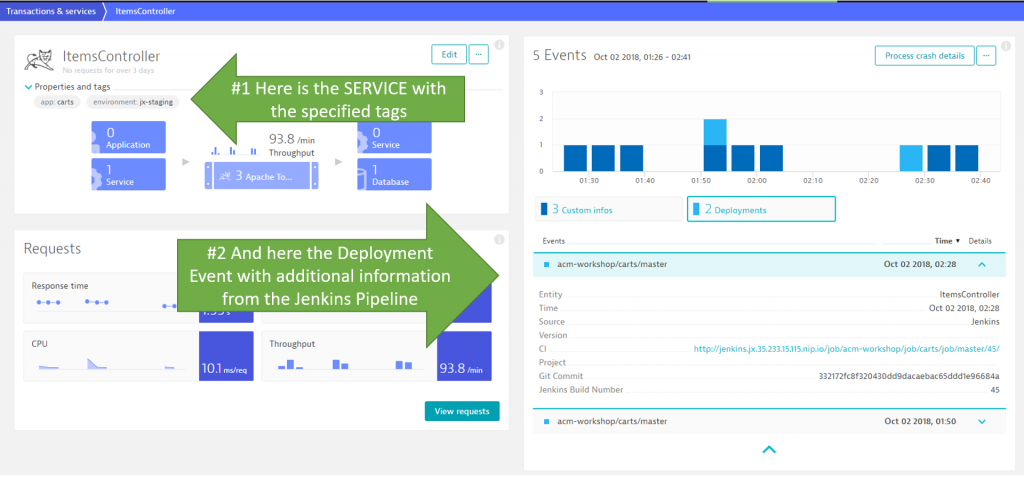
I believe this is the first game changer. Why? Because every time somebody runs the pipeline, either on the master or a dev branch, Dynatrace and Jenkins are automatically linked. When analyzing data in Dynatrace you immediately know which Jenkins job deployed at which time, what the Git Commit was, how long the deployment lasted, and which services were impacted by that deployment.
Step 3: Execute your Integration, API, Load or Performance Tests
This step now is straight forward. Simply execute your Selenium, JMeter, Neotys, Gatling, … tests that you normally execute in your pipeline. We do recommend that you tag your HTTP-based tests through the x-dynatrace-test HTTP Header as explained in How to I integrate Dynatrace into my load testing processes? This will make it easier to analyze, diagnose and compare individual test runs.
The following shows my modified Jenkinsfile for the Performance Testing stage. Just as we wrapped the deployment of the application in the previous step we are now wrapping the execution of the performance test into a call to recordDynatraceSession – another pipeline step that comes with the Performance Signature Jenkins Plugin. It will push a load testing event to those entities in Dynatrace once the test is complete. It also allows us to define the testCase name which is how data is grouped later on in the Jenkins Result view. You could run different tests, e.g: Load Test, Functional Test, API Test, … – and use that wrapping to pull in different metrics for different types of tests you execute.
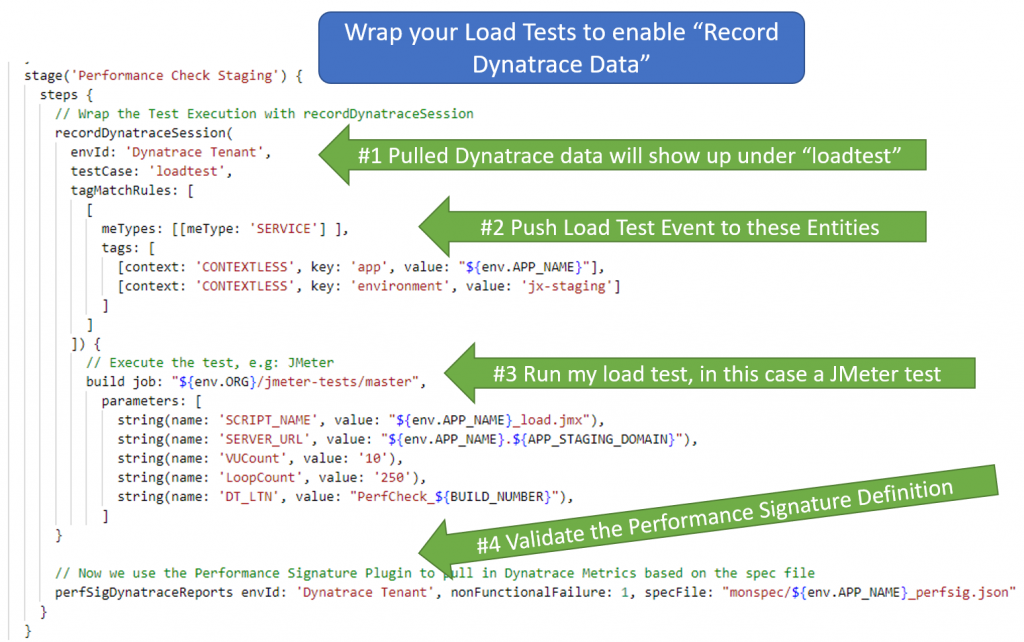
recordDynatraceSession goes hand in hand with perfSigDynatraceReports. This is where the “real magic” behind the Performance Signature evaluation happens. Let me show you all the details about this in Step 4!
Step 4a: Understand and define your Performance Signature
Let’s have a quick look at the Performance Signature – the JSON file that we will define as an engineer for automated evaluated in our pipeline. The file is an array of timeseries definitions:
- a timeseriesId, e.g: response time, CPU, memory, failure rate …
- an aggregation: avg, min, max, count, percentile
- tags: pull metrics from those entities with these tags
- entityId: instead of tags you can also specify a specific EntityId
- upperLimit & lowerLimit: both must be specified and actually define a SEVERE and WARNING threshold. Depending on whether upperLimit > lowerLimit or lowerLimit > upperLimit the limits are validated against the upper or lower value range. See below screenshot for an example
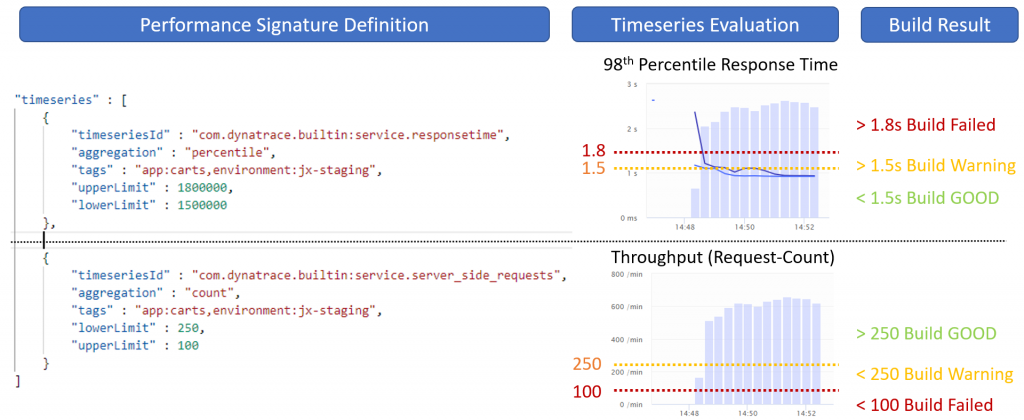
The next screenshot shows a Performance Signature that contains two metrics: service.responsetime and service.server_side_requests (=throughput). Please not the different boundaries:
- Response Time validates against upper boundaries: We want to fail the build if the 98th percentile of response time exceeds 1.8s and mark the build unstable if we are higher than 1.5s
- Throughput validates against lower boundaries: We want to fail the build if we have less than 100 requests / min and mark as unstable the build if we have less than 250
I hope this explains how to use upperLimit and lowerLimit. We might want to rename these though in the future to something like warningLimit and severeLimit as it makes a bit more sense.
Now let’s have a look how this gets evaluated and where we actually see the data.
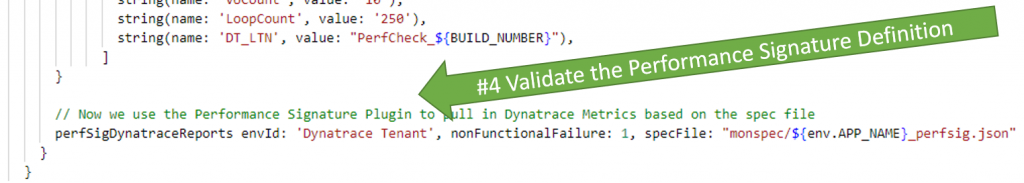
Step 4a: Validating Performance Signature
In Step 3 we already saw the call to perfSigDynatraceReports. It was executed right after the performance test was executed. As a parameter it takes the references to the Performance Signature specfile:
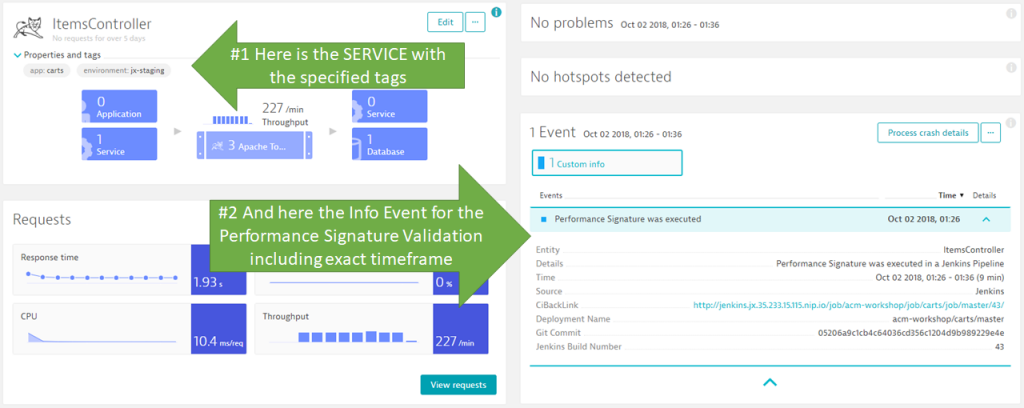
Now – here is what happens in Dynatrace when the evaluation happens – we see the event on those entities referenced in the recordDynatraceSession step:
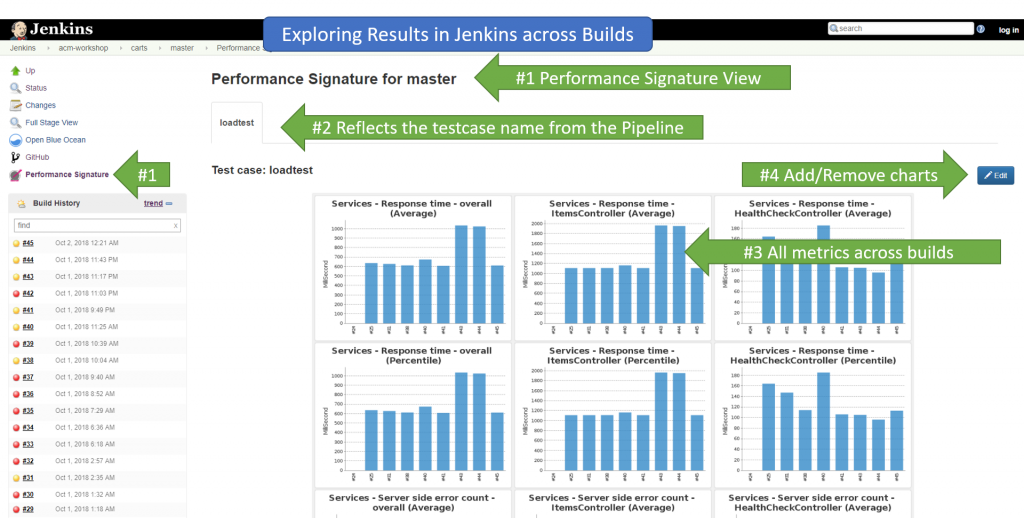
More important to this information are the actual performance signature results in Jenkins. We see them build over build in the Job overview:
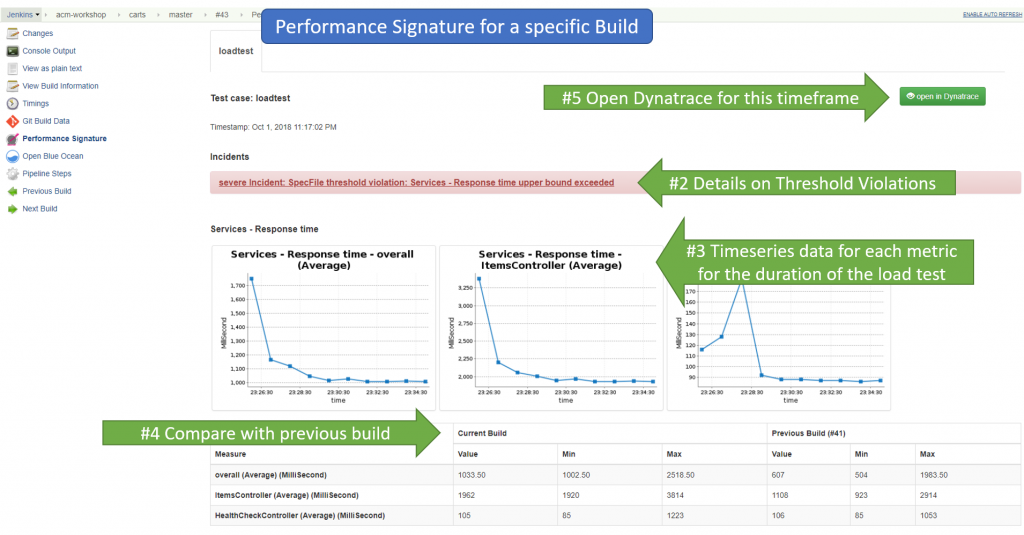
For each individual build we see every metrics for every entity that matched and all data points for the timeframe of the test run. We also see if there were any violations to the defined thresholds (upperLimit, lowerLimit). This either creates a severe or warning incident as shown in the screen below with details about the violation: actual value vs thresholds.In case of a violation the build status would also change to either failed or unstable. Last bonus item is that the view also shows a comparison of the current to the previous build:
I believe this is a game change. WHY? Because it provides Monitoring Feedback as a Service automated into my continuous integration pipeline. As a developer I only have to define the list of metrics I want in a JSON file and everything else happens “auto-magically”. I get notified about performance, resource consumption or architectural regressions (e.g: too many unwanted dependencies) and can then easily drill down to the root cause. Which is what we are going to see next! Yeah – you heard me right – we can also extend this to architectural validations as we can also pull in Smartscape metrics such as incoming or outgoing dependencies!
Step 5: Comparing two builds and find the difference
Once we have a failed build due to the performance signature violation, we want to know what the root cause is. For HTTP-based applications & services I favor the following approach:
#1: Open the Top Web Requests View
I start in the Top Web Requests View and filter it down to those requests that came in from my load testing script. This works if you are following the Load Testing Integration for Dynatrace best practice and have request attributes configured to filter on your load tests executed from Jenkins:
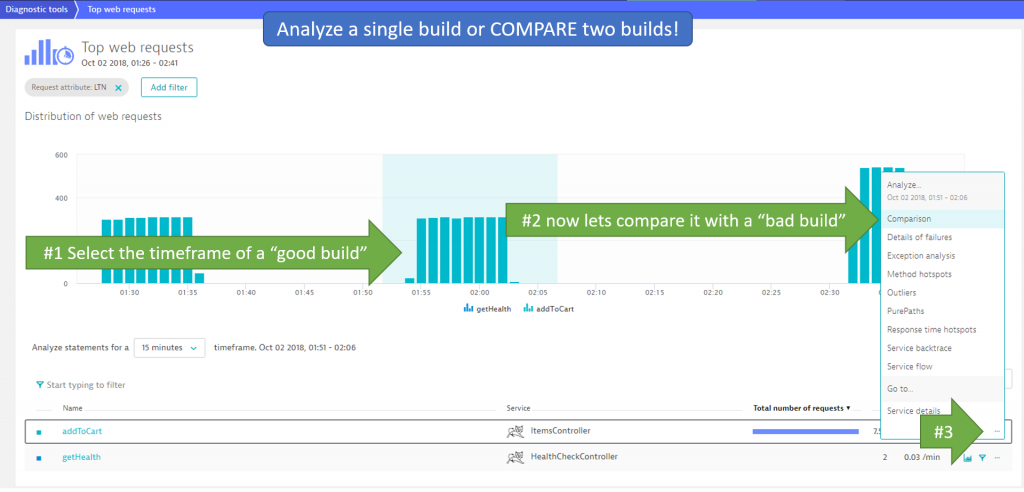
In the screenshot above also see that I have filtered on the request attributed called LTN (=Load Test Name). I am only looking at those requests that come in from my specific Load Test. Now I can select one of the tests that was executed between 1:51 and 2:06 and click on Comparison of one of the tested endpoints!
In the following Comparison View I select the timeframe of the previous or next build as compare timeframe: 2:26 – 2:41. Then I open the Response Time Hotspot comparison:
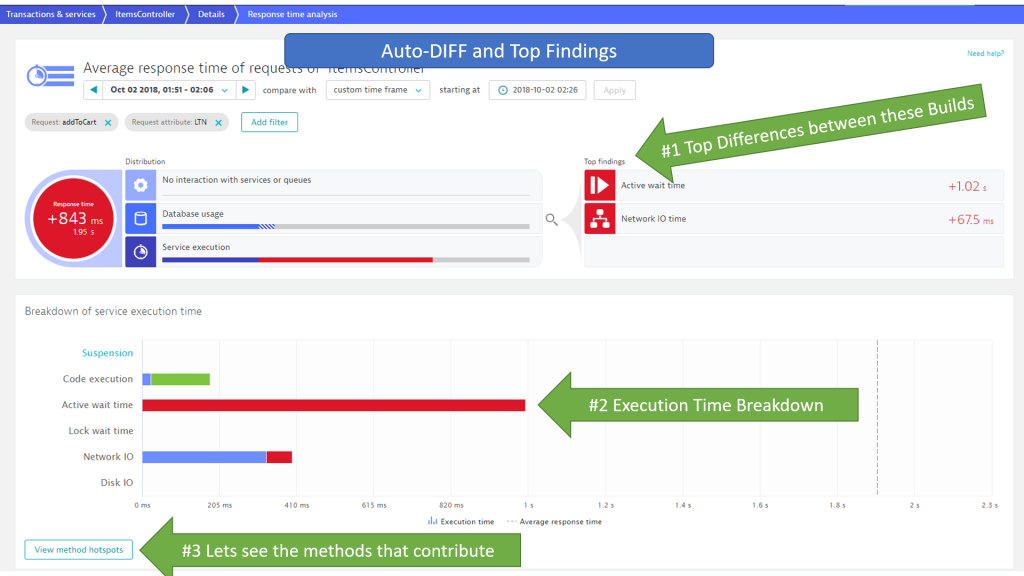
In case of a code execution issue I can go directly into Method Hotspots to see which methods consumed all this wait time that wasn’t there in the previous build:
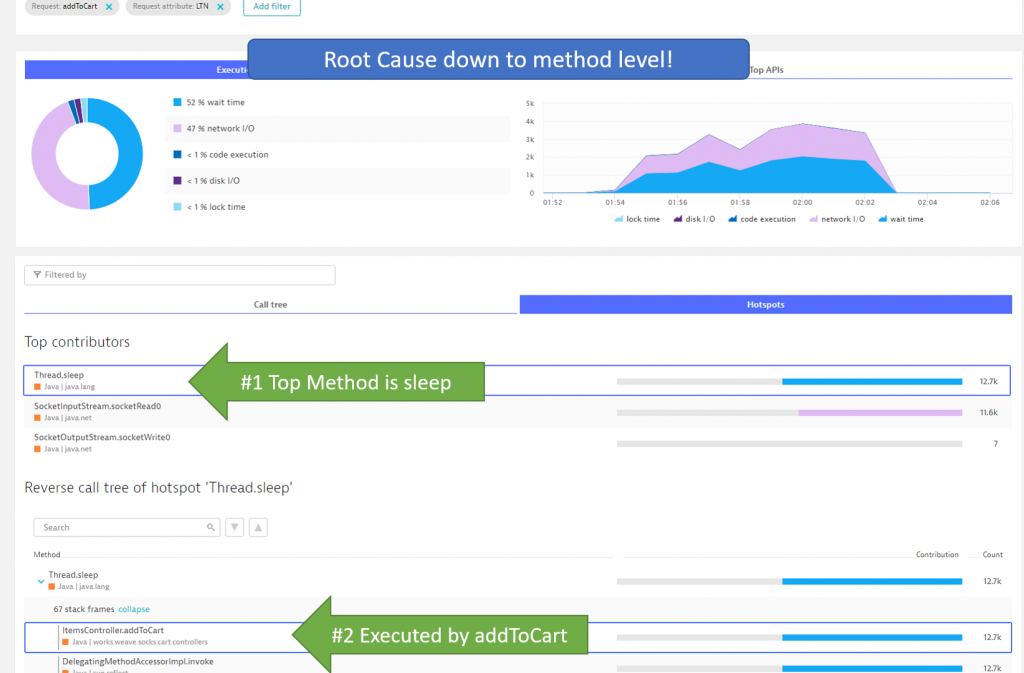
Depending on what the hotspot analysis tells us we can go off different routes of diagnosing the issue. For more details on diagnostics make sure to check out my Basic Diagnostics and Advanced Diagnostics with Dynatrace Online Tutorial.
Give us feedback on Performance Signature for Jenkins
I want to start to give feedback to Matthias and Raphael by saying: THANK YOU for implementing Monitoring as Code in such an elegant way and making it available through the Performance Signature for Jenkins plugin.
In discussion with them we already came up with a list of future improvements, e.g:
- Thresholds based on deviation of previous build vs hard coded upper & lower bounds
- Heatmap Visualization in Jenkins Build to Build Comparison Table
- Allow validating ANY percentile and not just the 98th which is default
- Architectural validation using Smartscape data
- Promote a good performance signature as baseline for production alerting
If you have more feedback for them either leave a comment on the blog, contribute or post on the Performance Signature GitHub project or reach out via email.


Looking for answers?
Start a new discussion or ask for help in our Q&A forum.
Go to forum