In today’s world of observability and reporting, my experience in capturing the end-user-experience (EUE) with web and mobile application technologies is easy to achieve. But not all applications are created equally when it comes to obtaining users’ experience. In fact, one of the most challenging areas is the use of thick client presentation layers, such as SAP’s Graphical User Interface (SAPGUI).
SAP provides SAPGUI, known as one of the presentation layers to access ECC and S/4HANA applications. Although SAP provides a modern web interface framework for its applications (Fiori UI), which is great for newly developed applications, SAPGUI remains the primary view into application workflows of users, where they conduct the everyday company business. Just like other application technology stacks, the application and support teams are always looking for ways to improve visibility into the end-user experience and what’s impacting SAPGUI users.
Over the years, I’ve heard many different kinds of questions related to SAPGUI performance. The questions always seem to be the same when it comes to performance and user experience:
- Which users and locations are having performance problems?
- What functional areas are contributing to user slowdowns?
- What happens to user performance during close cycles?
Understanding the SAPGUI user experience enables more productivity for those users heavily involved in mission-critical revenue impacting or business processes, by quickly solving problems impacted by system performance.
The SAPGUI observability challenge
SAPGUI is a technology that makes understanding the user experience a challenging task to achieve, as it’s different from traditional web interfaces. You can get this via Solution Manager (SolMan), but it’s not the same when it comes to visibility of the end-user experience and historical record. SolMan is an excellent tool and at Dynatrace our goal is to provide the fault domain isolation for problems impacting users and leverage SolMan for a deeper dive into a problem.
Dynatrace, on the other hand, has a smart way to achieve end-user experience monitoring for SAPGUI, by building a focused solution to collect performance metrics and user experiences from SAP ECC and S/4HANA systems, remotely and non-intrusively. This extension enables the capturing of all this high-fidelity user and performance data and is quick and easy to setup. Learn more about the Dynatrace SAP Extension here.
But how could this new level of observability help with managing the performance for SAP ECC? The answer is simple: by providing a user-experience perspective on the SAP application. This perspective is often forgotten in the midst of managing the SAP applications, tasks, jobs, and infrastructures. But having a real user perspective, with automatic anomaly detection, dashboarding, and long-term reporting opens dialog and collaboration between SAP teams, IT Ops, and end-users. Now everyone can work on the same data, have factual evidence of how users behave and what they experience, and how SAP is supporting the business processes followed by human operators.
There are several areas where the use of the Dynatrace SAP extension will enable application and support teams to better support the SAP users, on the basis of insight into the real user experience. For example dashboarding, SAPGUI user experience analytics, and problem detection.
Let’s delve into how each of these works.
Dashboarding
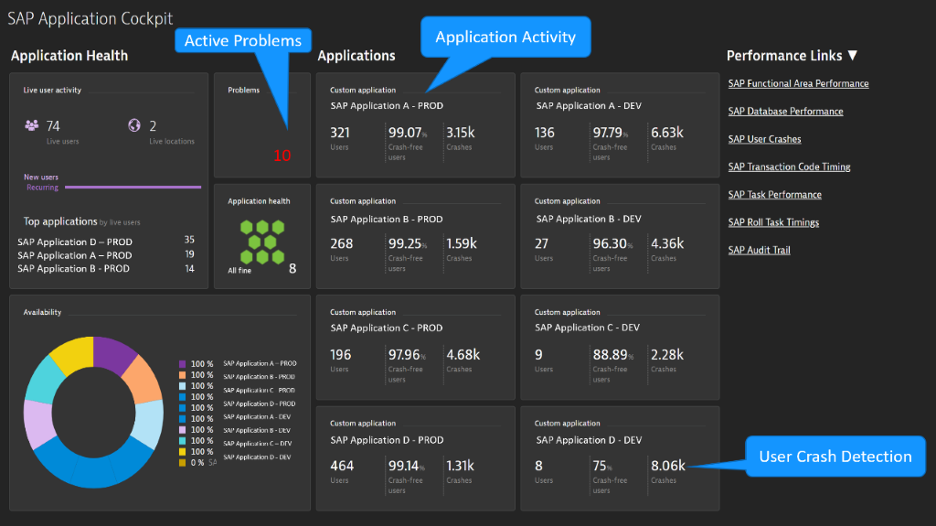
The SAP Application Cockpit is an overall view of performance for all deployed SAP ECC applications. Application health, availability, problems, and user crashes offer a quick view of performance, which enables support teams to quickly understand where applications are experiencing faults.
Dynatrace has created an SAP ECC dashboard pack that will be released after the SAP extension is deployed. Simply create a management zone for each SAP application and deploy the dashboards. It’s that easy and SAP ECC will be continuously monitored within minutes.
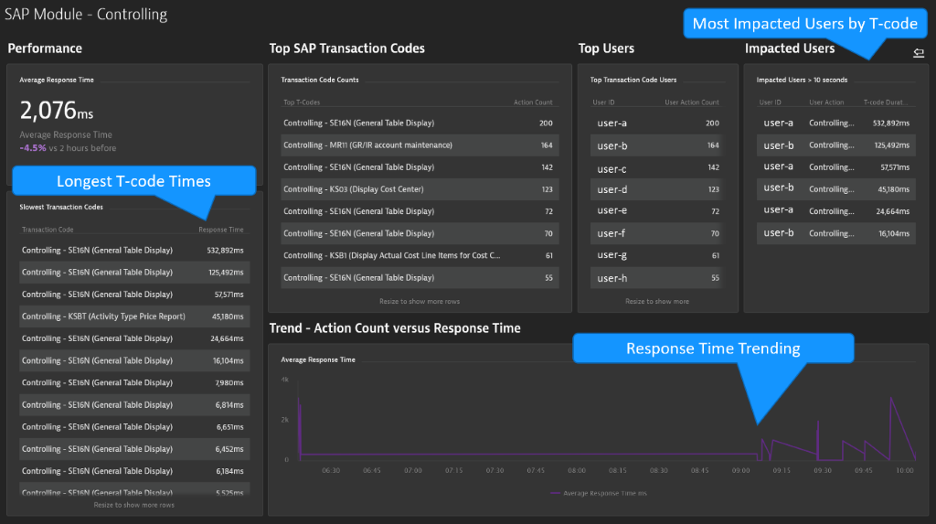
The SAP Module Dashboard details the experience of the users and transaction code executions for each specific area, with top transactions and users displayed. The most important parts are the impacts on users and longest-running transaction codes, as these are the indicators for the overall health of module performance. The module has a trendline to compare the performance of volumes and transaction code response times. This answers the question regarding volumes impacting response times; when servers encounter too many requests, that can impact user response times.
SAPGUI User Experience
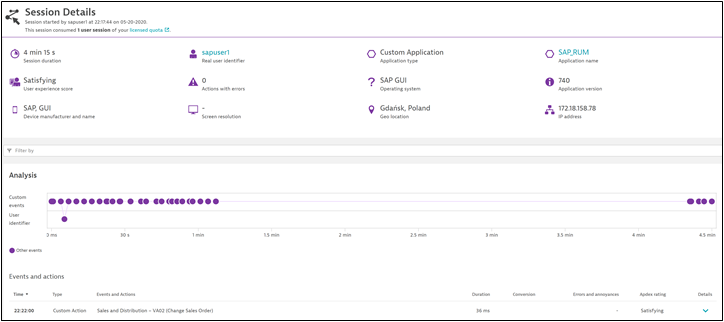
Let’s start by looking at the user experience details collected. The user session shows the username, SAPGUI version, IP address, and duration and will contain all the transaction codes the user has executed along with execution times. Dynatrace also provides a User Experience Score that enables the support team to easily categorize the users’ experience so they can prioritize support.
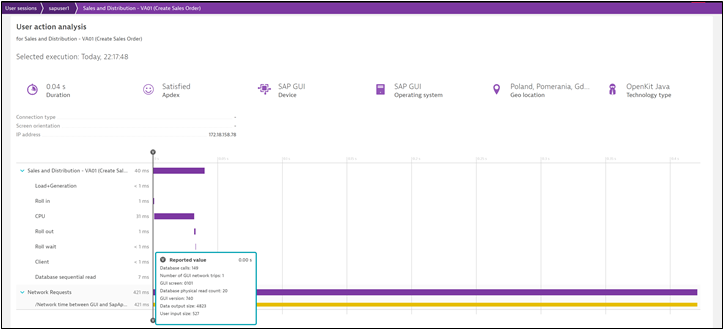
Viewing an executed transaction code is simple; this displays a waterfall of the user action as it relates to the transaction code in question. The transaction code is identified, and performance details including timings for the overall transaction code, Load + Generation, CPU consumption, and network impact are displayed. By clicking on one of these threads, a reported value box appears showing more details about data request size and the amount of database calls made for the transaction code. Why is this important? This approach allows for the quick gathering of performance data that will enable SolMan and reduce the number of steps within SolMan to identify the same information.
Problem Detection
Dynatrace generates problem cards for SAP GUI. Problem cards are notifications that are automatically generated based on anomaly detection for SAP events that impact the users and application experience. When a real-time alert is generated, a notification will be sent out and the receiver can then view the problem and quickly understand the impact. Run time errors are an example of the type of problem card generated.
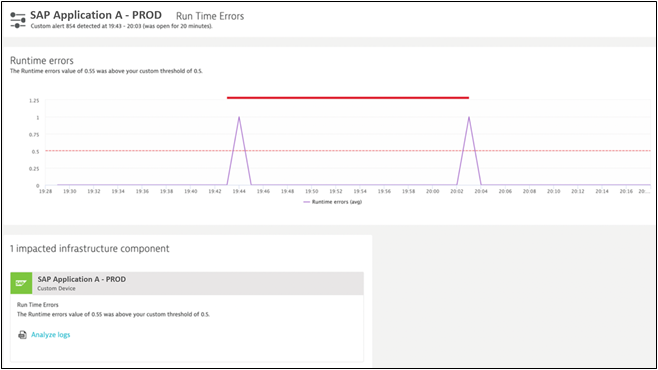
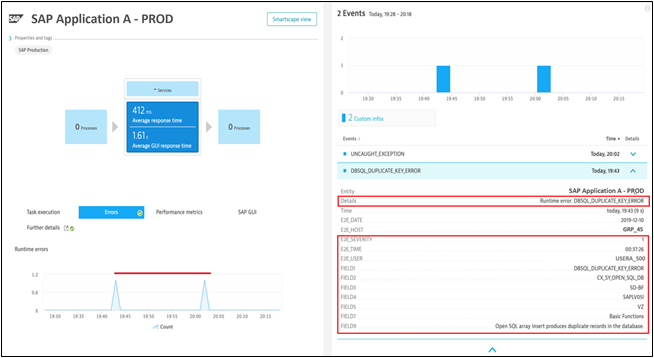
The problem card details show the short dump information related to the runtime error. In the example above, the error has been caused by the DBSQL_DUPLICATE_KEY_ERROR short dump on the ABAP server. With this information, we can quickly shift the perspective to the whole ABAP server performance and see how often is this problem occurring on the server, or in the whole environment, and the severity of the user impact is noted along with execution times, user identification, and individual transaction code performance.
ABAP task performance and database response time
We transitioned from the SAP GUI real user experience to the ABAP server-side perspective. Since Dynatrace began continuously and automatically monitoring the whole SAP landscape and experiences across all users, we also have information of the performance on every SAP server.
Sticking to the end-user perspective, we characterize the SAP server performance on the high level of task types that the server maintains for the users. Dynatrace SAP Extension will look at each task and display volumes and timing information. This is trended over time to see where spikes have occurred at the task level and if it was related to database, CPU, roll or Load + Generation times, and volumes
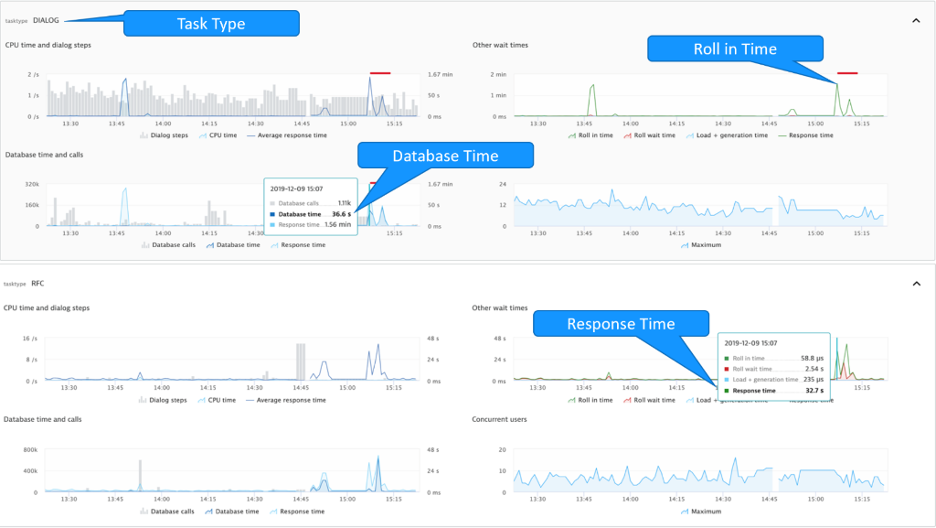
This is not on the level of SAP technical monitoring that SolMan provides, but it’s granular enough to detect anomalies and equip SAP teams with information on when and what went out of norm. Then, using SolMan for problem analysis, SAP specialists can start from an identified point in time, systems, and issue evidence. The example below shows an increase in database time and roll in time for the DIALOG task. All of these violations that occur with observation points can automatically be detected or manually configured as desired to generate problem cards.
Conclusion
By leveraging dashboards, deep insights into the SAPGUI user experience, correlation of the ABAP short dumps with affected users, analysis of individual tasks, and database times, the application and infrastructure teams can quickly isolate the fault domain. Dynatrace will equip SAP teams with factual evidence of the real SAP user experience and enable targeted use of the SolMan for deep dives into the problem when it’s an application issue.
All of these capabilities will bring together both business and technical views of performance for different stakeholders, enabling collaboration to which areas of the application are impacting business operations and allow for quick remediation. By automating the process, this will alleviate the need to manually query the SAP applications for performance information.
Now that you know a few scenarios about what Dynatrace can do, getting started is easy. Contact your Dynatrace representative and ask for the SAP Extension and, before you know it, your entire SAP ECC environment can be monitoring the end-user experience and application performance.


Looking for answers?
Start a new discussion or ask for help in our Q&A forum.
Go to forum