
Mainframes remain the backbone of mission-critical business services, particularly in the insurance, finance, and retail industries.
Yet many organizations still monitor their IBM z/OS environments with tools that were never built for hybrid, distributed systems, let alone for integrating real-time mainframe insights into solutions like ServiceNow, PagerDuty, or Slack.
This missed opportunity results in a visibility gap: teams are aware when something is slow, but they often don’t know where or why the issue has occurred before it impacts their customers.
In a recent webinar, Provinzial, one of Germany’s largest public insurers, shared how it modernized its mainframe monitoring by upgrading to Dynatrace SaaS, unlocking advanced monitoring capabilities.
In this blog post, we’ll explore why customers like Provinzial choose Dynatrace to complement their traditional mainframe monitoring tool stack.
Why modern observability needs to seamlessly integrate with existing mainframe monitoring tools
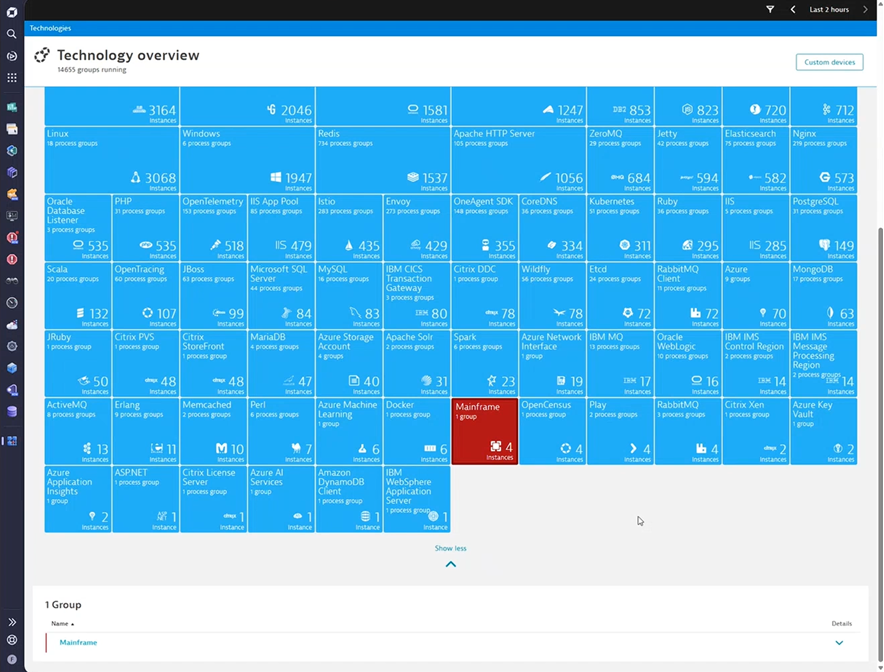
IBM Z is foundational! They process millions of transactions per day. But most traditional monitoring tools, and even observability solutions, isolate mainframe deployments from the rest of the IT landscape.
Without true end-to-end visibility and context, troubleshooting becomes expensive, time-consuming, and dependent on scarce z/OS experts.
Dynatrace closed this gap for Provinzial by bringing all mainframe telemetry—regardless of how it is collected—into a unified, AI-powered observability platform that allows seamless and cross-functional collaboration.
Davis® AI helps detect performance issues by automatically identifying anomalies like latency increases, failure spikes, or DB2 bottlenecks, assisting teams in resolving issues proactively, before they cause an outage.
Three ways to integrate your mainframe with Dynatrace
Dynatrace supports three complementary integration methods. Whether your organization uses Dynatrace OneAgent®, OpenTelemetry, IBM-native z/OS tooling, Cribl, or all of the above to collect and ingest data into Dynatrace, the outcome is the same:
All signals are automatically correlated, analyzed, and contextualized.
This freedom of choice allows enterprises to adopt the approach that best fits their operational model, security requirements, and hosting constraints, utilizing OpenPipeline® for ingest processing and data enrichment, which handles all sources equally.
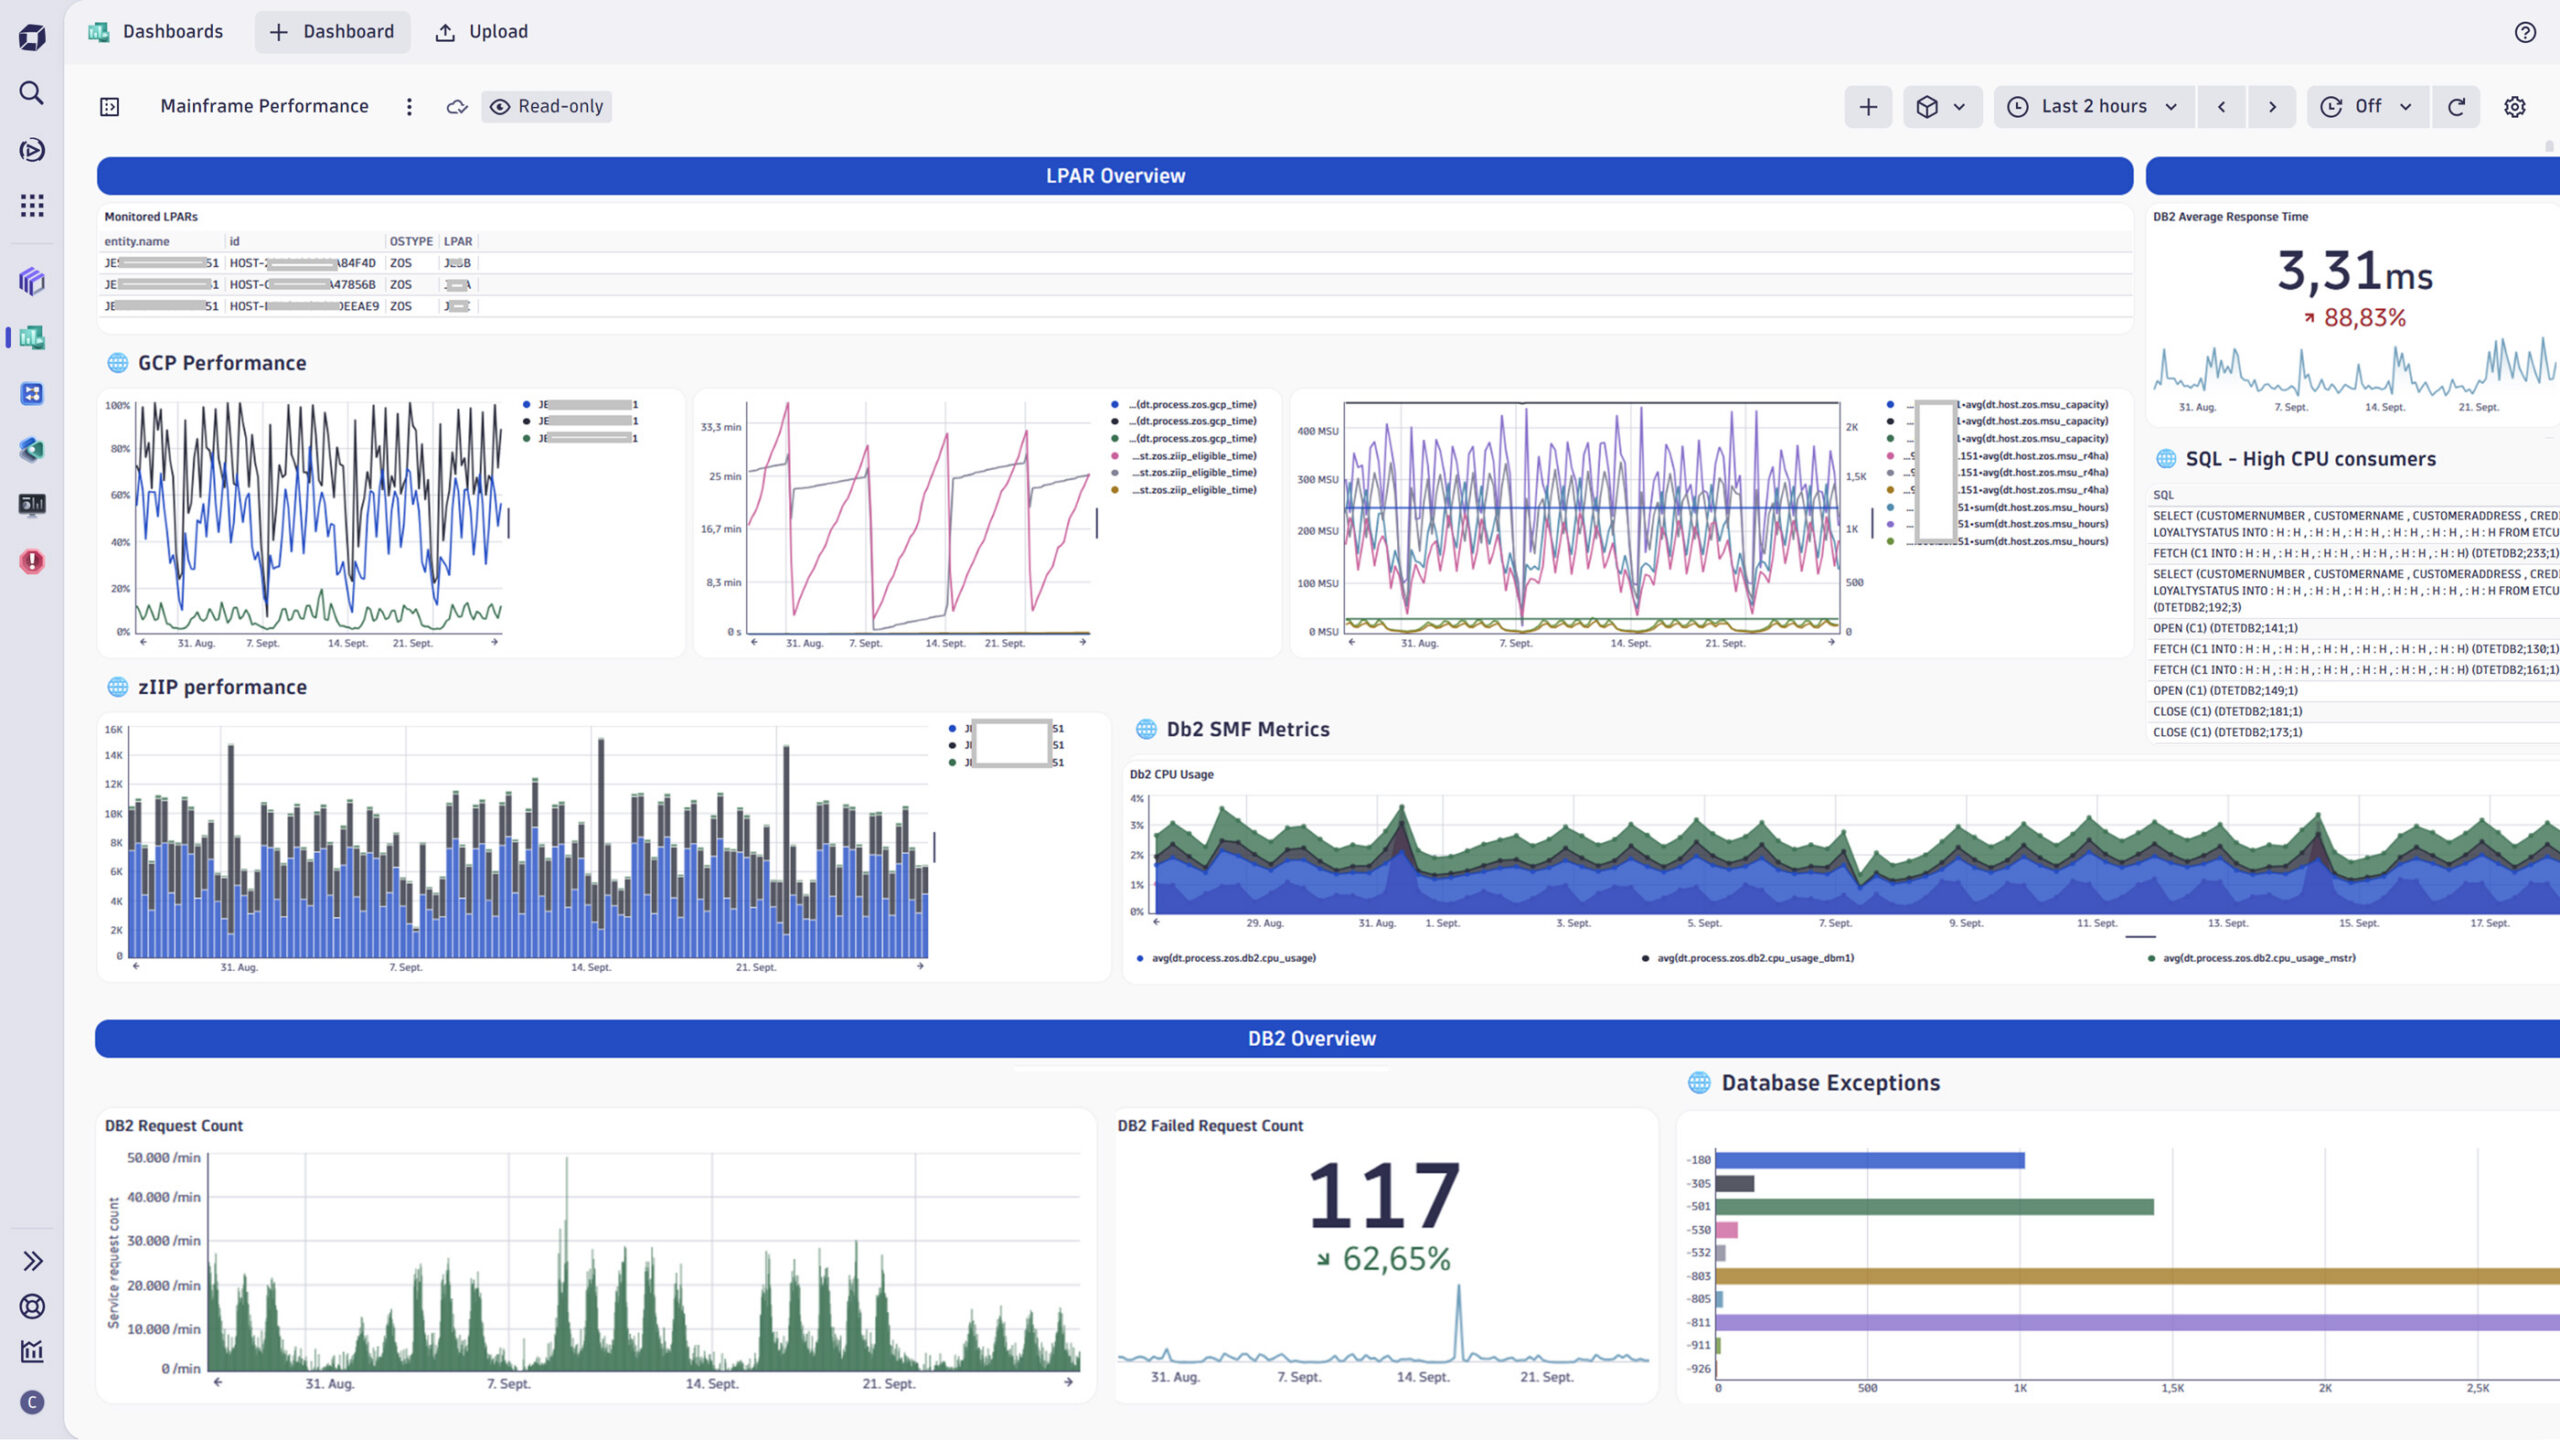
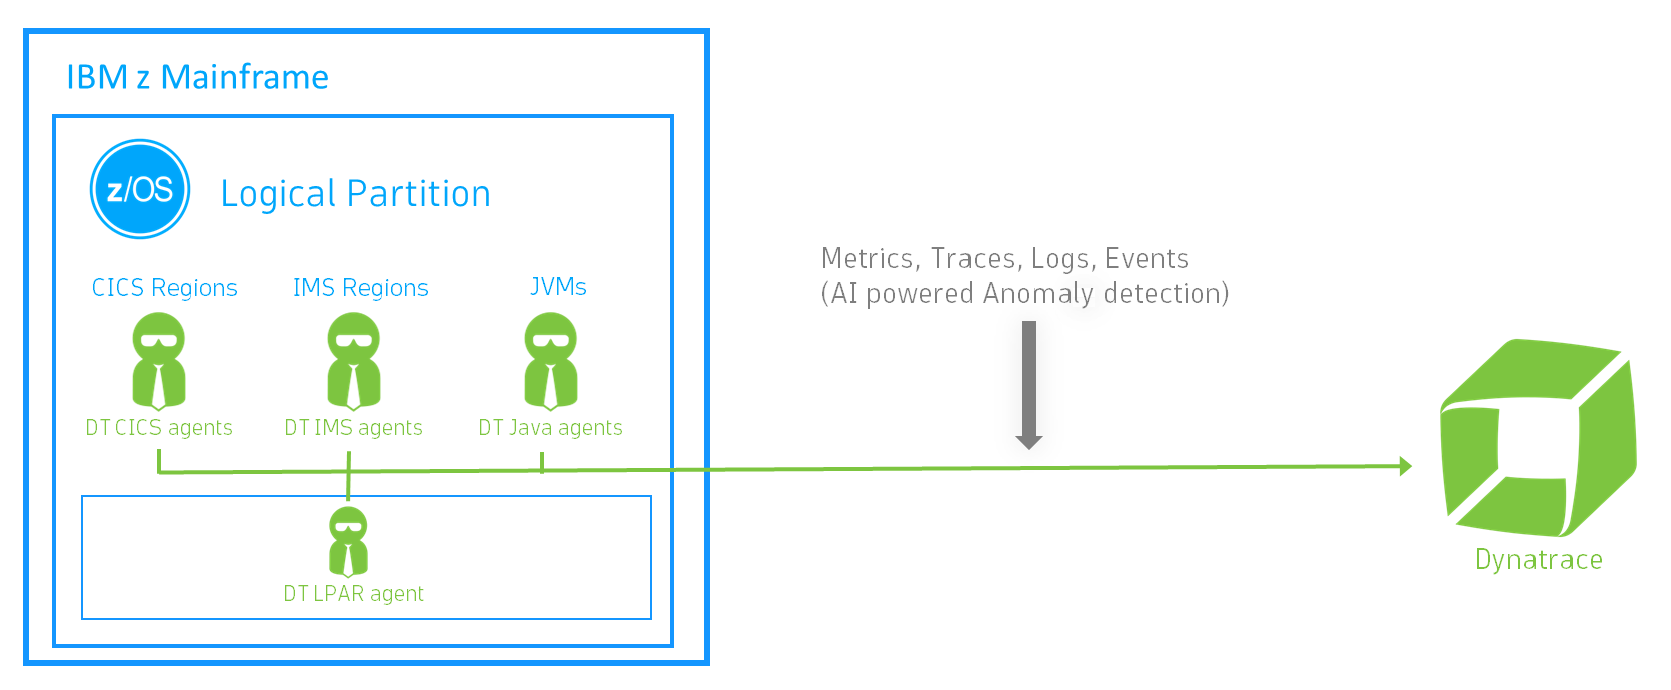
1. OneAgent-based monitoring for CICS, IMS, and Java
Dynatrace z/OS agents provide deep, real-time insights into:
- CICS and IMS transaction behavior
- DB2 workload details
- LPAR and individual processor utilization (GCP and zIIP)
- Automatic log collection and correlation with traces
This creates true end-to-end visibility. When a customer books a trip or completes a payment, Dynatrace captures the full execution path—from the mobile frontend through distributed services to CICS or IMS—highlighting exactly where time is spent and where issues originate. Say goodbye to manual correlation and tool sprawl.
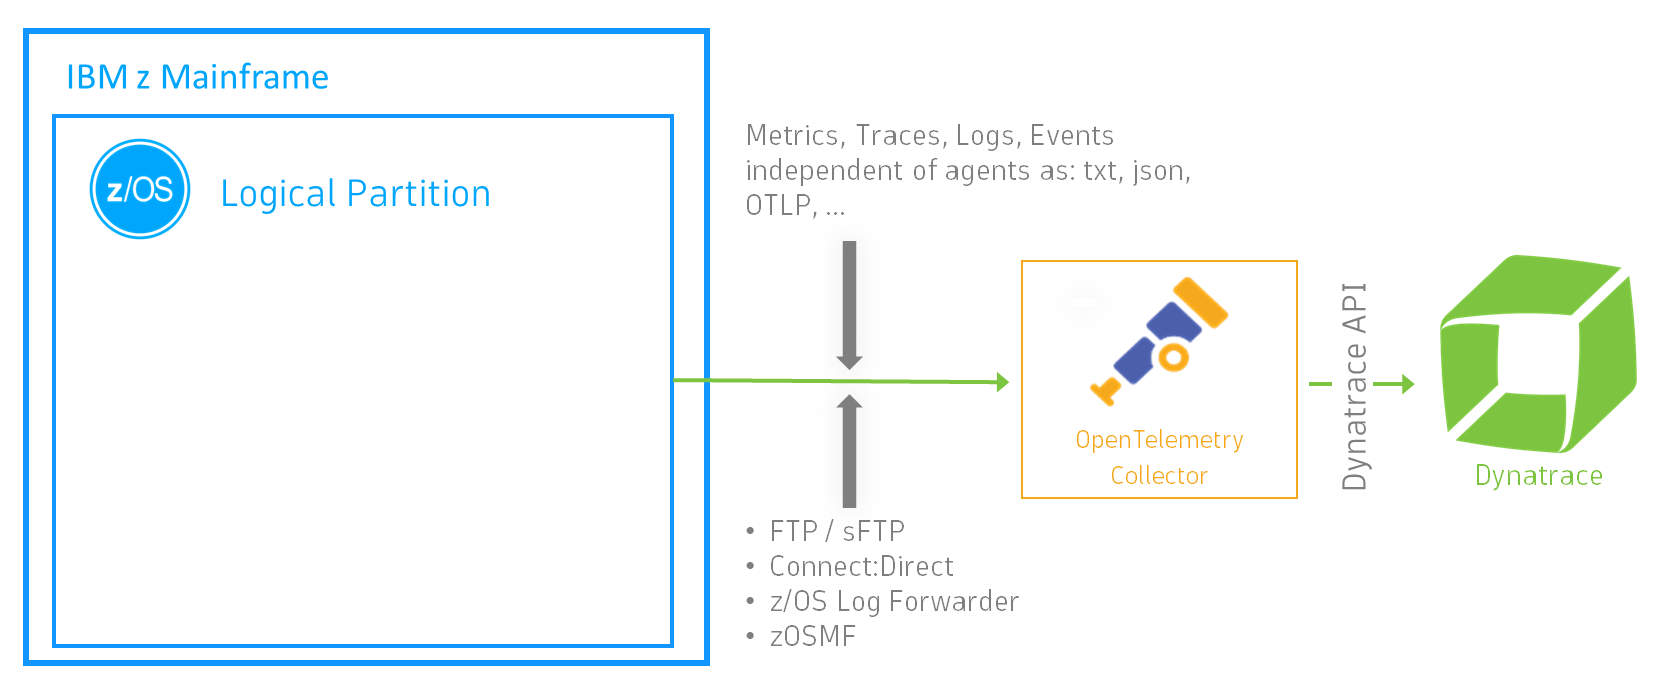
2. OpenTelemetry Collector
When full z/OS agent coverage isn’t possible, or if your organization utilizes open standards, the Dynatrace OpenTelemetry Collector (or any other shipper) provides a flexible solution.
Telemetry is forwarded to Dynatrace via OTLP or the existing transfer mechanisms mentioned. Ingest processing with Dynatrace OpenPipeline allows for transforming and extracting metrics or business events, before signals are retained in Dynatrace Grail® for unified analytics, where data is always accessible, with long-term retention up to 10 years.
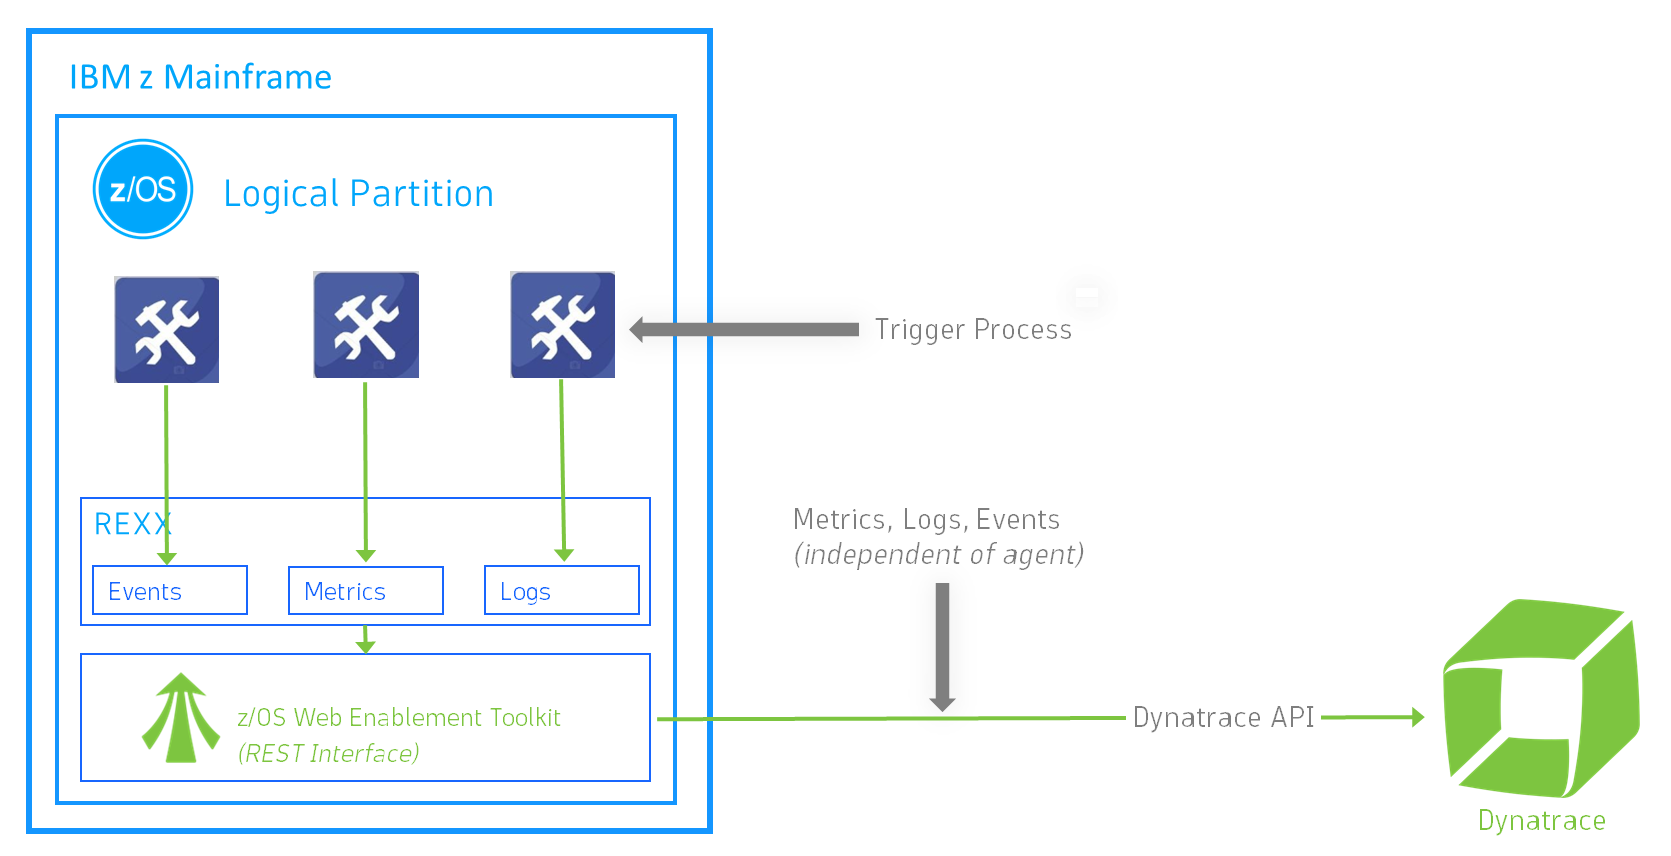
3. REXX Framework + IBM z/OS Client Web Enablement Toolkit
For environments with established REXX automation, the fastest path to integration is the IBM z/OS Client Web Enablement Toolkit, available with z/OS 2.5 and later.
This cost-effective approach teams to send events, metrics, and logs directly to Dynatrace via the REST API in essentially no time, as Provinzial shared.
Provinzial chose this method to forward and collect alarms from their BMC AMI Ops mainframe monitor related to business-critical online and batch processes and STCs. The implementation was fast, required no additional firewall permissions, and integrated seamlessly into the existing operational model of their outsourcing and hosting partner.
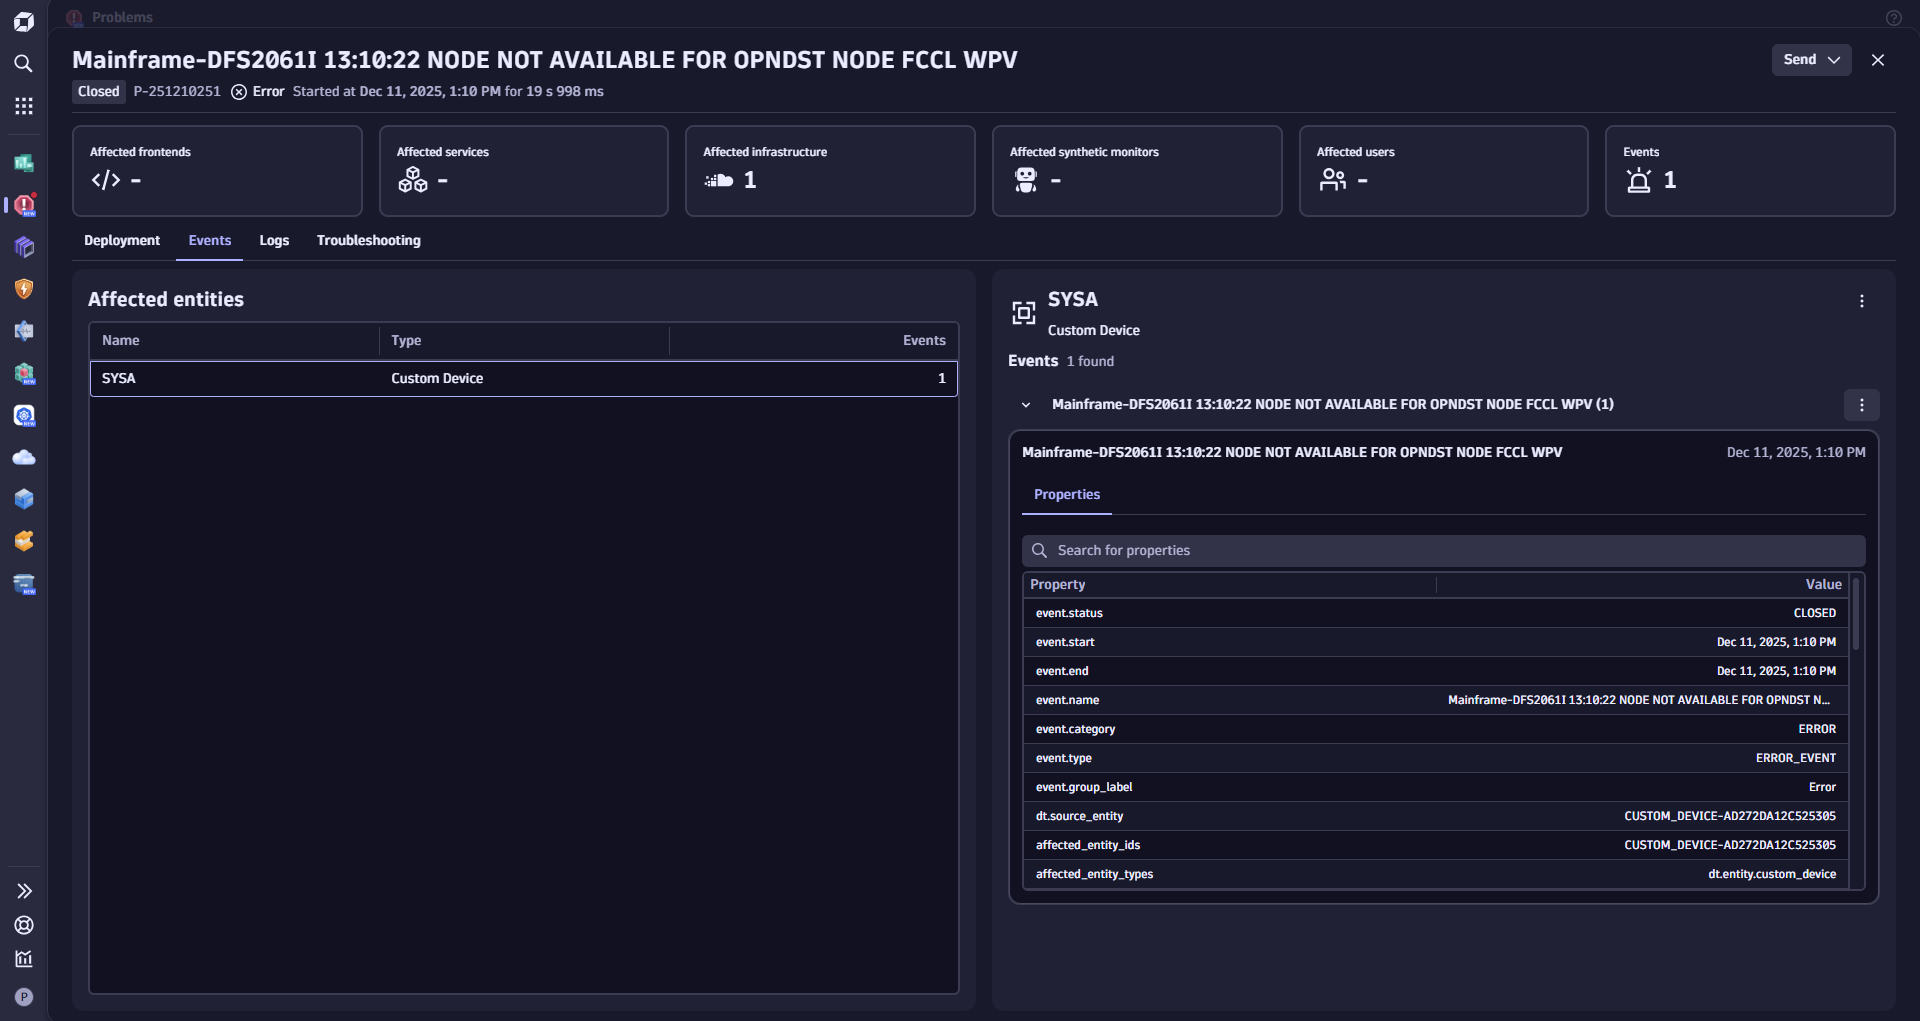
Real-time alerts and integration into your IT ticket system
Once mainframe telemetry is in Dynatrace, it becomes part of holistic, AI-driven observability:
- Mainframe events trigger real-time alerts.
- Dynatrace Davis® AI correlates all signals holistically.
- Problems include root cause context from both z/OS and distributed systems.
- Teams can move from reactive to preventive operations by integrating with BMC, ServiceNow, Jira ticket creation, or other integrations and custom Workflows.
Provinzial leverages Dynatrace to observe its entire environment, including mainframes. This allows them to consolidate 10 other monitoring tools, while interconnecting and automating IT ticket creation with BMC SmartIT.
The outcome? Reduced complexity, accelerated time to insights, and shorter mean time to resolution (MTTR)
A modern, flexible path to mainframe observability
What makes Dynatrace especially compelling is that you don’t need to replace existing tools or redesign mainframe processes. Instead, Dynatrace integrates seamlessly with:
- Existing AMI Ops monitoring
- IBM Z Automation
- OpenTelemetry instrumentation
- Log forwarders and SMF pipelines
- Custom REXX routines
This allows modern observability without disrupting mission-critical systems while further enhancing IBM Z mainframe agility.
The future of mainframe observability with Dynatrace
With extended OpenTelemetry support for CICS 6.3, TPF, App Connect Enterprise, and other platforms, organizations can adopt standardized telemetry across their mainframe workloads.
Dynatrace is ready for this future today—processing any mentioned telemetry, SMF records, VSAM statements, or DB2 queries all in a unified, AI-powered platform that helps you to understand logs, database execution plans, or incidents in human-readable language.
Provinzial’s journey demonstrates how Dynatrace SaaS can modernize monitoring without introducing complexity.
By combining AI-driven analytics, open integration options, and seamless cross-platform correlation, Dynatrace allows organizations to
- Leverage hybrid systems with confidence.
- Increase efficiency by automating tasks and actions.
- Reduce time spent on incidents with insights and preventive operations.
Get started
No matter where you are in your observability journey, Dynatrace offers the simplicity, depth, and flexibility required to operate mainframe environments at enterprise scale.
Hungry for more? Ready to significantly improve your mainframe availability by connecting logs with traces? Or is your first step with Dynatrace to analyze query performance: the next level of database optimization?
If you’re interested in learning more details about how Provincial reduced costs and increased service quality, visit our customer success story.
If you aren’t yet a Dynatrace SaaS customer, start a free trial or request a demo to experience the power of true observability yourself.


Looking for answers?
Start a new discussion or ask for help in our Q&A forum.
Go to forum