
Modern enterprises today use a myriad of enterprise Software-as-a-service (SaaS) applications and productivity suites to run business operations, such as Microsoft 365, Google Workspace, Salesforce, Slack, Zendesk, Zoom, GitHub, and many more. Overseeing SaaS security and monitoring audit logs across multiple SaaS applications is complex, which often involves building and maintaining dedicated integrations for each application that can retrieve audit logs. Because each service has a different log schema, it can be challenging to standardize querying and monitoring user activity across tools.
To address these challenges, Amazon Web Services (AWS) introduced AWS AppFabric, an AWS service that quickly connects SaaS applications across an organization for enhanced security and employee productivity.
Dynatrace integration with AWS AppFabric for security
The AWS AppFabric for security feature fully manages the integrations with over 25 applications so customers can get started tracking application security in just a few clicks—no coding required. Once connected, AppFabric automatically normalizes SaaS audit logs into the Open Cybersecurity Schema Framework (OCSF), which allows customers to use common queries for audit logs and track user activity across all their SaaS applications.
Customers can then ingest logs from AWS into the Dynatrace® platform, for in-depth log management and security analytics powered by GrailTM.
“Dynatrace is excited to announce our integration with AWS AppFabric for security, allowing Dynatrace customers to leverage the power of Grail – our purpose-built data lakehouse for observability and security data, and Dynatrace Query Language (DQL) to monitor, analyze, and extract insights from their SaaS applications audit logs,” says Kacey R. Leckenby, senior director worldwide alliance sales at Dynatrace.
AWS AppFabric ingests and normalizes audit logs from SaaS applications and delivers them to an Amazon Simple storage service (Amazon S3) bucket in an organization’s AWS account. With the Dynatrace AWS S3 Log Forwarder, customers can easily ingest and enrich logs from a wide variety of AWS services out-of-the-box, now also including AWS AppFabric OCSF-JSON logs. The log forwarder consumes notifications as new logs are put on the Amazon S3 bucket, automatically detects the AWS service producing them, and enriches those logs for easy discovery and query in Dynatrace Grail.
About the Open Cybersecurity Schema Framework (OCSF)
The Open Cybersecurity Schema Framework (OCSF) is a collaborative, open-source effort co-founded by AWS that provides a standard schema for common security events, defines versioning criteria to facilitate schema evolution, and includes a self-governance process for security log producers and consumers.
Analyzing AWS AppFabric logs with Dynatrace Notebooks and DQL
When Dynatrace ingests AWS AppFabric logs, it enriches log entries with a set of attributes that allow organizations to get quickly set up to easily query and discover them. All AWS AppFabric (OCSF-JSON) log entries are automatically detected and enriched with the following attributes:
aws.service: appfabric
log.source: {saas_product_name}
audit.identity: {email_address_of_the_user_performing_the_action}
audit.action: {ocsf_normalized_action_category}
Dynatrace offers Notebooks, enabling organizations to create powerful, data-driven documents for custom analytics of logs, events, and metrics. Notebooks are a perfect tool to understand and perform an in-depth analysis of AWS AppFabric logs, thanks to the powerful Dynatrace query language, DQL. This section shows how to analyze AWS AppFabric logs with Notebooks and DQL.
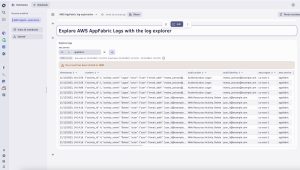
Take an initial look at the AWS AppFabric logs adding a log explorer to the Notebook. Click on the + button and then select Explore logs. Then, customize the filters to filter by key aws.service and value appfabric like in the screenshot below.
Running an initial quantitative analysis helps to better understand the log data, starting with which SaaS applications we are getting logs from, and how many events. Dynatrace Notebooks enable users to format the output in tables and graphs to better understand an organization’s data at a glance. Let’s see a pie chart with the breakdown of log events per SaaS application.
fetch logs
| filter aws.service == "appfabric"
| summarize count(), by: {log.source}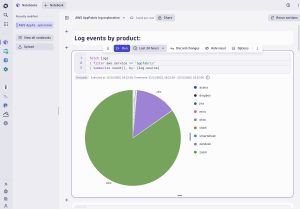
AWS AppFabric not only normalizes logs into the OCSF schema, but also normalizes user identifiers across applications using the user’s e-mail address so it’s simple to trace specific user activity across all SaaS applications. Now, let’s look at what kind of actions are performed on our applications and by whom:
fetch logs
| filter aws.service == "appfabric"
| summarize count(), alias:event_count, by: {log.source,audit.action,audit.identity}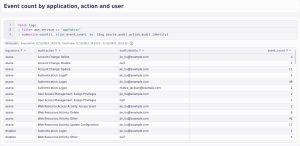
Up until this point, we have just performed simple queries using the log attributes that the Dynatrace AWS S3 Log Forwarder enriched our logs with. However, with Dynatrace Query Language (DQL) we can perform much more complex queries on our OCSF logs. For example, some SaaS applications include the user’s IP Address and Country on their audit logs. We can use DQL schema-on-read powerful capabilities to parse the raw log object on the content field and query the actions performed by users, including the source IP address and origin country:
fetch logs
| filter aws.service == "appfabric"
| parse content, "JSON:contentjson"
| fields timestamp, audit.action, log.source, audit.identity, {contentjson[device][ip], alias:IP}, {contentjson[device][location][country],alias:Country}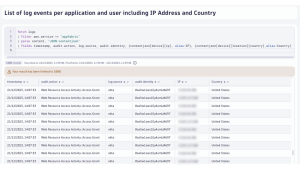
DQL provides a very rich set of commands, functions, and operators to extract full insight of logs. To learn more, visit the DQL guide documentation.
Set up alerts for suspicious user activity
Being able to explore logs in-depth is very helpful to perform forensic analysis, however, customers really want to get alerted if suspicious activity is going on as soon as logs are processed* by Dynatrace. With Dynatrace Log Management analytics, organizations can set up alerts based on the occurrence of specific log events.
As an example, the walkthrough below sets up an alert if Dynatrace detects administrative activity on Okta from an IP address that doesn’t belong to the IP range (e.g. 1.2.0.0/16) our company users access the internet from.
Go to the Logs and events explorer and then turn on Advanced mode. Then type the DQL query below to fetch the Okta logs:
fetch logs
| filter aws.service == "appfabric" and log.source == "okta"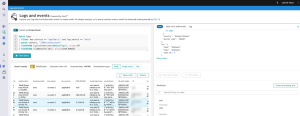
Now, select a log record and click on the Create processing rule. Then, fill the configuration in with the following details to add additional attributes to the Okta logs with the source IP Address, the IP range once applied a /16 mask, and a Boolean indicating if the IP belongs to the company range 1.2.0.0/16.
Matcher (match any Okta logs coming via AppFabric):
matchesValue(aws.service,"appfabric") and matchesValue(log.source,"okta")Processor definition:
PARSE(content, "JSON:contentjson")
| FIELDS_ADD( ip:IPADDR(contentjson[device][ip])) | FIELDS_ADD(cidr:IP_TRUNC(ip,16))
| FIELDS_ADD(is_corporate_ip:(EQUAL(cidr,IPADDR("1.2.0.0"))))
| FIELDS_REMOVE(contentjson)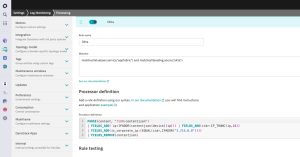
You can click on the Test rule button below to test the rule. You will see the ip, cidr and is_company_ip attributes added to the log entry.
Next, configure Dynatrace to generate an alert when the is_corporate_ip attribute for an Okta log entry is false. Go to Settings -> Log Monitoring -> Events extraction and click on the Add log event button. Fill in the log query and the details as per the screenshot below, then click Save.
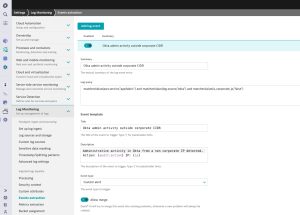
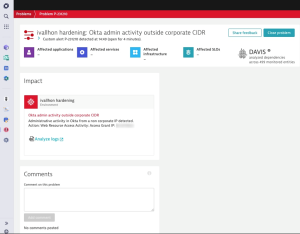
You are all set! Now Dynatrace will create a Problem if there are log entries for Okta that come from an IP that doesn’t belong to our corporate IP range. You can get notified of this problem by leveraging one of our multiple out-of-the-box integrations with Incident management tools (like Jira, PagerDuty, Opsgenie…), ChatOps (Slack, Teams…) and more.
*Log delivery frequency in AWS AppFabric varies across SaaS applications based on each application features
Get control and visibility over user activity across your SaaS applications
Start analyzing your SaaS applications audit logs today. AWS AppFabric provides a 30-day free tier for two SaaS applications to help get a glimpse of what’s possible. To connect your SaaS applications to AWS AppFabric, follow the getting started documentation. When setting up the audit log ingestions, select Amazon S3 as the destination and OCSF-JSON on the Schema & Format configuration for the Dynatrace AWS S3 Log forwarder to automatically recognize and enrich logs.
Follow the instructions here to deploy the Dynatrace AWS S3 Log Forwarder on your AWS Account. Note that AWS AppFabric is available in the US East (N. Virginia), Europe (Ireland), and Asia Pacific (Tokyo) regions, so the Amazon S3 buckets where the logs are delivered need to be created in the same region where AWS AppFabric is configured. If you normally use a different AWS region and want to deploy the Dynatrace AWS S3 Log Forwarder on it, instead of the region where you configure AppFabric, follow the instructions here to configure cross-region log forwarding.
To learn more, see our joint announcement on how AWS AppFabric and Dynatrace work together to enhance your SaaS application security observability.
Not a Dynatrace customer yet? Sign up for a 15-day free trial and discover the power of our platform for unified observability and security.


Looking for answers?
Start a new discussion or ask for help in our Q&A forum.
Go to forum