
When visiting or relocating to another country, you must go through the local Visa process, which is often done through an online portal ahead of your trip. The Ministry of Interior (MOI) in Qatar provides these immigration services online for their residents via their mobile app, Metrash.
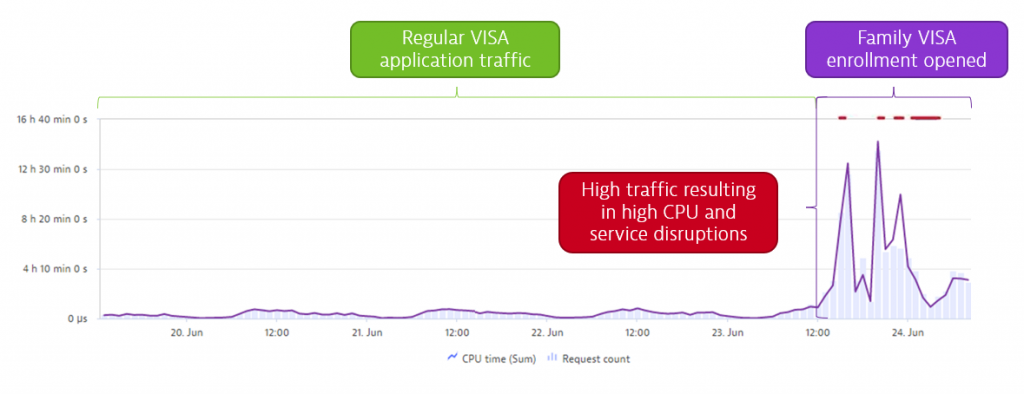
Following almost two years of restrictions, due to Covid-19, Qatar decided to lift the freeze on permit applications and as a result, June 24 2021 was a much-anticipated date for many as it was the day, they could apply for a permit to reunite with friends and family in Qatar once again. Therefore, it was unsurprising to see a huge spike in traffic for Family Visa enrollment via Metrash. The system saw up to 800 application requests per second – far more than anticipated. More worrisome was a spike in CPU usage, resulting in severe service disruption as backend processing systems crashed due to the spike in load.
I was lucky enough to get connected to the team at MOI who walked me through their process of analyzing and addressing the issues at hand with Dynatrace. Let’s start with the spike in load:
As this was the first time in years that systems started to experience major disruption a team of performance experts was gathered who were quick to identify:
- Root cause: Old way of using XPath (full search)
- Reason: High memory consumption of XPath queries when parsing application documents
- Side-effect: High CPU consumption due to high garbage collection
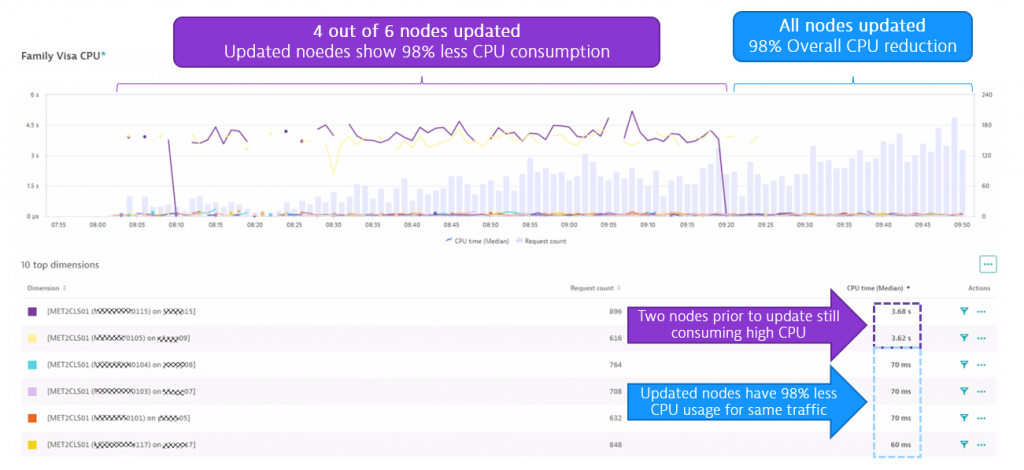
- Solution: Use optimized methods to access / query for specific data, e.g.: getNodeByType resulted in 98% reduction of CPU usage, better performance, returned high availability and reduced operational costs.
Here’s the proof that the update, which was first rolled out on 4 nodes and then to all 6, resulted in a 98% reduction of CPU usage:
I want to say thanks to the expert team for sharing this story on how families reuniting with friends and family in Qatar can now use the online immigration services without any problems.
Looking ahead, the Qatar government will face even more increased use on these services with the upcoming FIFA world cup where millions of visitors will request online services from MOI. Seeing how they optimize their systems on a smaller scale like the example we went through above can give us good confidence that risk of performance issues will be minimized “there won’t be issues” next year to support your favorite soccer team onsite in Qatar.
Now – this is not the end of the blog. Thanks to expert team I can also share some more technical details on how they used Dynatrace to detect that root cause of the issue that quickly, providing their developers all the necessary data and evidence so that they could provide a fix right away!
Step 1: Detect the problematic service endpoint
In Dynatrace they used the Multidimensional analysis view to analyze incoming PurePaths (=End-2-End distributed traces) split by online service endpoint. This showed them that the CPU spike was truly caused by just the getFamilyCondition endpoint. If you look closer to the following screen you can clearly see that the average CPU consumption per transaction is extremely high of that service vs the next top requests that consume CPU
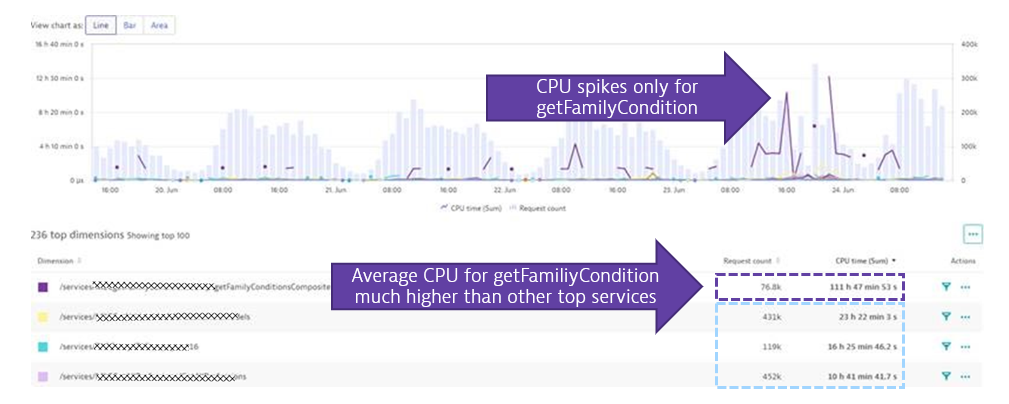
This first step clearly shows that the code that powers getFamilyCondition is using a lot of CPU – much more than any other of the top services combined! So – we found the culprit!
Step 2: What is using all this CPU?
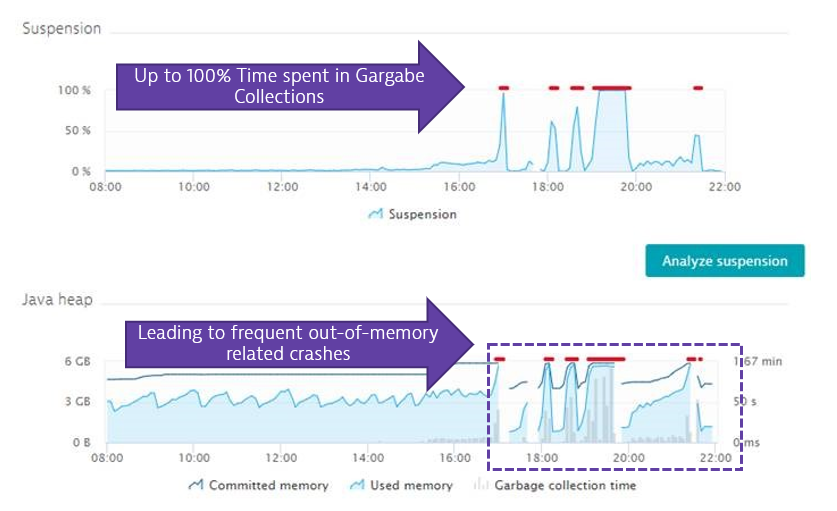
There are different things that use CPU. It can be your own code, 3rd party code or your runtime that executes for certain tasks such as Garbage Collection. In this case we had some side-effects.
One the one side it turns out that there was extremely high garbage collection activity by the JVM due to very high memory allocations:
But where does all this data allocation come from?
Turns out that for every application a rather large JSON document (with ~128kb) is requested from the backend Mainframe system:
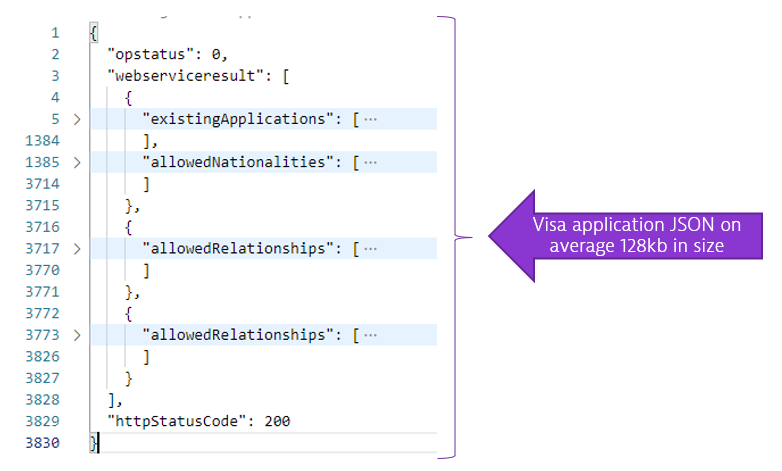
That document is read into memory and represented as a DOM (Document Object Model). If you multiply that memory footprint with the hundreds of requests that are being processed by second during peak it becomes clear why getFamilyCondition needs a lot of memory just when loading those JSON documents into memory.
To analyze why those requests are taking several seconds the team went ahead and used Dynatrace’s CPU hotspot analysis to identify where in the code additional CPU is spent. Turns out the used library for parsing and iterating through that DOM to find specific data were making the memory and CPU problem even worse:
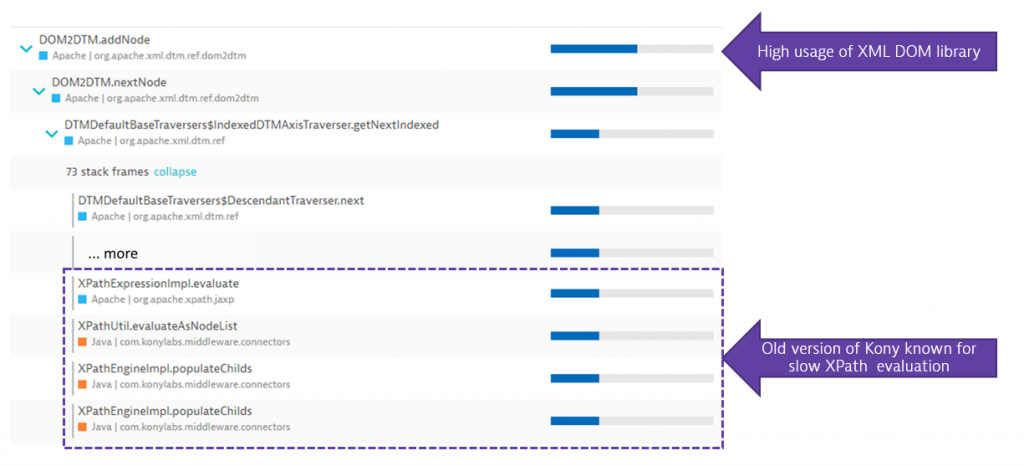
The above analysis shows that the application code iterates through the DOM to find specific data points. When iterating over it they are using XPath evaluations to access certain elements. These XPath expressions turn out to be really CPU expensive as implemented by the 3rd party Kony library as the XPathEngine of that library even creates more objects when evaluating XPaths. All of that consumes more CPU, adds more memory which in fact consumes even more CPU because the GC has to clean the memory up again.
Recommendations to lower Memory and CPU usage
Based on all the evidence and some further digging through the data captured by Dynatrace the team came up with a couple of recommendations to solve the problem:
- Reduce the size of the requested JSON object to only include data really needed
- Increase JVM memory limits to better handle spike load
- Change default timeout settings to avoid piling up of requests
- Perform an audit on default settings of the application server
- Update to a newer XPath concept of Kony which is known to be 50x faster when accessing individual nodes in a DOM
Especially the last point was crucial and an important finding going forward with future implementations. The development team now understands that XPath operations on large objects are very expensive both on memory and CPU. The lessons learned for future implementations is
- Only request data you really need to keep the data footprint low
- Use optimized methods to access / query for specific data, e.g: getNodeByType
- Remove unwanted full result search from Json result by using XPath specific node configuration
- Configure Json response with limited required result data
Why Devs – and Immigrants to Qatar – Love Dynatrace!
This was a great example on how powerful the data of Dynatrace is when it comes to detecting performance or scalability issues and their root cause. The metrics are great for anyone in operations and capacity planning. The details down to allocations and method level are great for developers to understand what their code is really doing and how to optimize code for load spikes in production.
One suggestion I want to give them on their way is to look into the practices of Performance Testing and Chaos Engineering. Spikes like this shouldn’t surprise you in production. You can test for them before releasing to production and can even simulate chaotic situations, e.g: crashing systems, slow backends, large data sets, … to see how the system behaves in “not normal” conditions.
Thanks again to the expert team. I know there are more stories coming from those two as they already gave me some insights into how they are using Dynatrace to optimize the user journey through the physical immigration, e.g: when walking through the eGates at their airports. They promised me some more good stories and lessons learned so that we can all start planning to visit Qatar knowing that the whole end-2-end immigration process will be fast and reliable.


Looking for answers?
Start a new discussion or ask for help in our Q&A forum.
Go to forum