
The experiences users have with your digital touchpoints create a lasting impression. In an increasingly online world, these digital experiences are often the most important interaction users have with your brand.
Organizations are constantly being measured against the best available digital experiences — coming from Google, Amazon, Facebook, and other industry leaders. These heightened expectations are applied across every industry, whether in government, banking, insurance, e-commerce, travel, etc. Even if an app has minimal competition, users expect digital experiences to be seamless and responsive. But what is digital experience exactly, and what can you do to ensure you’re delivering the best experiences possible?
What is digital experience?
A digital experience (DX) is a user’s interaction with a digital touchpoint — whether purchasing an item online, receiving updates from a mobile app, or power-using a business platform. A digital touchpoint may be a mobile application, a website, a smart TV, ATM, airport check-in kiosk, point-of-sale terminal, etc.
Some of the factors that affect user experience include:
- Availability: Is the touchpoint available when the user wants to use it?
- Performance: Is the interaction as seamless and fast as possible, or does the user always have to wait to achieve their goal?
- Errors: Are there any errors or broken components hindering the user from interacting with the touchpoint?
- User flow: Can the user actually achieve what they want to do? Was their operation successful?
- Usability: Are the needed functions easy to find? Is the functionality frictionless to use?
Monitoring digital experiences has become increasingly critical for organizations to maintain their competitive edge. Just as a shop owner wants to know if their customers are having difficulty locating a product or accessing the store, owners of digital services want to know users’ pain points as they navigate their offerings.
One advantage of digital experience over physical interaction is the tooling and technologies that are available to monitor and potentially improve the experience for your users.
Why is delivering zero-friction digital experiences so critical?
Poor digital experiences often result in lost business — switching to a competitor’s offering is just a tap or mouse click away. If that competitor delivers a better experience, you’ve lost not only a transaction but the future business of a once-loyal customer. You may think you can rely on customer loyalty, but according to McKinsey, since the start of the COVID-19 pandemic, 75% of U.S. consumers have tried new brands or outlets, diminishing the loyalty factor. Working on a customer win-back strategy is cost-intensive and not always fruitful, which makes having an excellent DX more crucial than ever.
Another risk of a bad user experience is the company’s brand reputation. One could argue that having a mobile app in the app store with a 1-star rating is worse than having no app at all. Some startups undergo expensive rebrandings just to get rid of the negative image created by a single bad mobile app deployment to the app store.
What ruins a digital experience?
Here are a few reasons user experiences can fail.
1. Digital touchpoint outage
This is the hard fail. There is nothing worse than your well-designed digital touchpoint simply falling offline. Identifying an outage was easier in the past when all the services were delivered directly from your hosted data centers. But cloud transformation makes detecting the epicenter of a failure much more challenging, as outages can be caused by your cloud provider, a third party helping deliver personalized experiences, your content delivery network (CDN), and many other services you may be leveraging.
Aside from lost revenue, users and customers may be quick to call out your brand on social media when your offering’s availability struggles, as Instagram experienced not long ago.

2. Broken functionality on a critical user path
Another obvious example is an issue in the checkout funnel of an e-commerce store. For a twist on that scenario, consider this example from the car insurance industry.
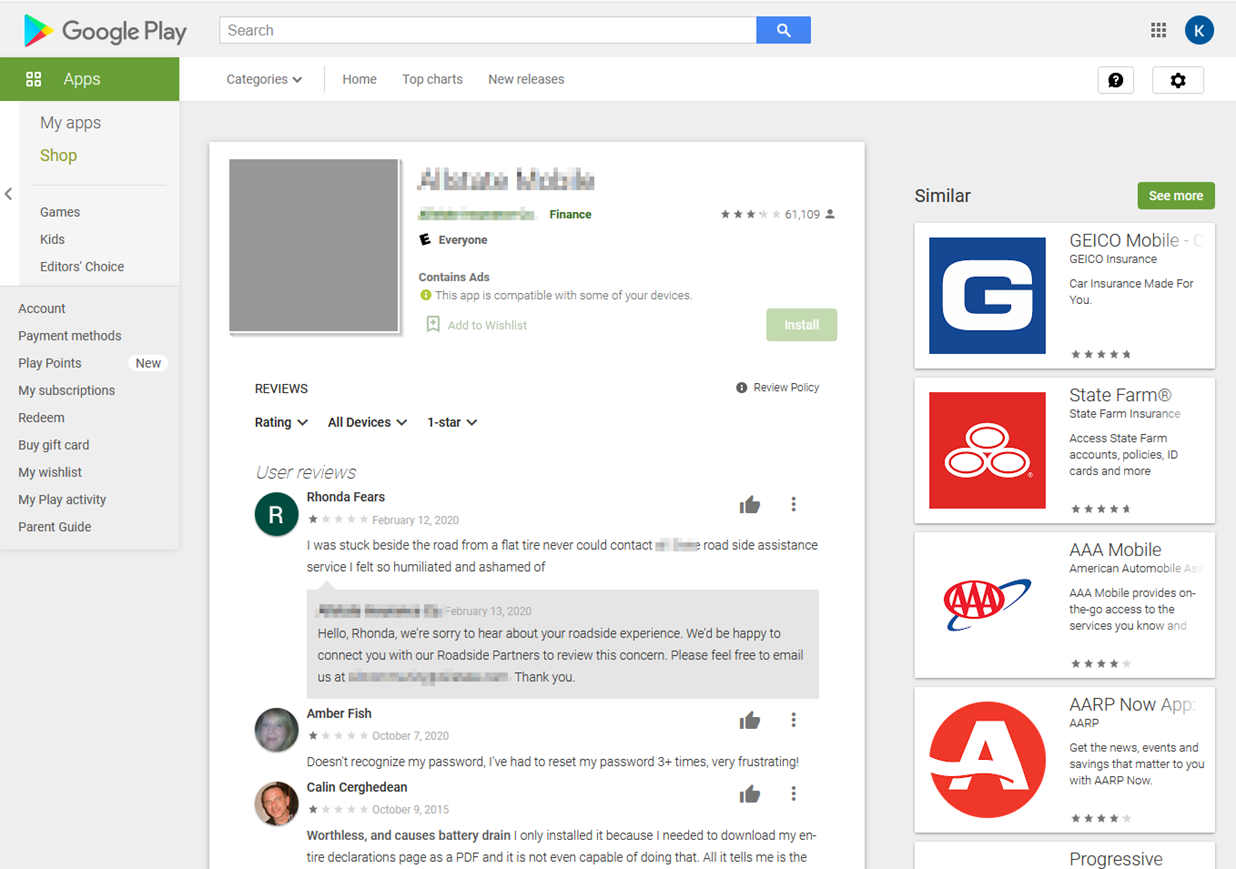
Today, every car insurance company provides a mobile app. The app should help users in very rare situations, such as a car crash or if they need roadside assistance. In these critical moments, everything must work — no excuses. If the app lets the user down on the worst day of their year, they will remember. When the “contact agent” functionality causes the app to white-screen, the user will be unhappy, and they might confront the app’s owner with a complaint on the Google Play Store where they’ll find a list of competing mobile apps that may be outperforming their current choice. The window of opportunity to save this customer is now very small and closing fast.
3. Soft fails and speedbumps
Besides the outright failures, there is a long list of soft impacts that injure the user experience. Some include:
- Web performance not meeting the user’s expected experience
- Overcomplicated user flows
- Annoying “pop-up” messages distracting the user
- Web screens not displaying on a mobile device correctly
- Touchscreen UI controls too small to tap
- Menu entries not reachable because they disappear on hover
- Overlapping text on browser window resizing
- No error feedback in form inputs
- No constraints in form input fields
- Mixing horizontal and vertical scrolling on mobile
Because of everything that can go wrong, it’s imperative for organizations to constantly track metrics that indicate user satisfaction and have a robust complaint resolution model in place.
Best practices for delivering excellent digital experiences
- Break down silos. Great digital experiences require the right culture and mindset. No technology, tool, or practice can accomplish this for you. But thinking about delivering experiences for people rather than thinking in silos can give your organization a chance to bring frictionless experiences to the world. What does that mean? Should I not follow a particular practice? Should I not use certain tools?
- Collaborate and keep an open mind. Practices and tools are required, but to create great user experiences, you need to be open-minded. For example, I was on a call with a company talking about BizDevOps collaboration. Their collaboration efforts were stuck because the marketing, business, and IT teams could not overcome the ownership question for a supporting tool. It shouldn’t matter who owns the tool as long as it fosters collaboration.
- Decide what to measure. Once you’ve embraced a user journey mindset, start thinking about what matters to you and your users as you define your core KPIs. Or, as site reliability engineers like to say, what are your service-level objectives (SLOs)?
- Decide how to measure it. It’s important that you agree on what to measure and find one solution for how you measure it — not have each team measuring the same thing with different tools. Without agreeing on the single source of truth, you’ll end up in meetings arguing about metrics instead of helping your users.
Which KPIs should you track to measure digital experience?
A full list of what to track for your applications and services will vary, but here are some basic KPIs to get you thinking in the right direction.
- Number of conversions or number of “dollar making” interactions
- User experience score
- Percentage of crash-free users (mobile specifically)
- Google Core Web Vitals: Largest Contentful Paint, First Input Delay, and Cumulative Layout Shift (specifically for web)
- Availability and Response Time of API (specifically for API driven industries)
- Net promoter score
- Number of failing form field validations
- Number of displayed error messages
Once you have KPIs you want to track and the metrics to quantify them, you’re ready for digital experience monitoring.
How to improve digital experience
Improving digital experience is crucial for businesses aiming to meet the high expectations of today’s tech-savvy consumers. Here are some key strategies to enhance digital experiences:
1. Personalization
Personalization is at the heart of a great digital experience. Utilize data analytics and AI to understand user preferences and behaviors. Tailor content, recommendations, and interactions to individual users. This can significantly increase engagement and satisfaction.
2. Responsive design
Ensure your digital platforms are optimized for all devices. A responsive design adapts to different screen sizes and resolutions, providing a seamless experience whether users are on a desktop, tablet, or smartphone. This is essential for maintaining consistency and accessibility.
3. Streamlined navigation
Simplify navigation to help users find what they need quickly and easily. Use clear, intuitive menus and search functionalities. A well-organized site structure reduces frustration and enhances user satisfaction.
4. Fast load times
Speed is critical. Optimize your website and applications to load quickly. Compress images, leverage browser caching, and use Content Delivery Networks (CDNs) to improve load times. Slow websites can lead to high bounce rates and lost opportunities.
5. Engaging content
Create high-quality, engaging content that resonates with your audience. Use a mix of text, images, videos, and interactive elements to keep users interested. Regularly update content to keep it fresh and relevant.
6. User feedback
Actively seek and incorporate user feedback. Use surveys, feedback forms, and usability testing to understand user needs and pain points. This helps in making informed improvements and shows users that their opinions matter.
7. Security and privacy
Ensure robust security measures to protect user data. Implement SSL certificates, use strong encryption, and comply with data protection regulations like GDPR. Users need to trust that their information is safe.
8. Omnichannel integration
Provide a consistent experience across all channels. Whether users interact with your brand via website, mobile app, social media, or in-store, ensure a unified and cohesive experience. This builds trust and loyalty.
Focusing on these strategies can significantly enhance businesses’ digital experiences, leading to higher user satisfaction, increased engagement, and better business outcomes.

Tools needed to improve digital experience
Enhancing the digital experience requires a suite of tools that work together to create seamless, personalized, and engaging interactions. Here are some essential tools to consider:
- Digital experience monitoring (DEM)
Digital Experience Monitoring (DEM) is essential for optimizing user interactions by incorporating Real User Monitoring (RUM) to track actual user behavior, Synthetic Monitoring to simulate user paths, and Session Replay to visually capture and analyze user sessions for comprehensive insights and improvements.
- Content management system (CMS)
A robust CMS is the backbone of any digital experience strategy. It allows for creating, managing, and distributing digital content across various channels. Popular CMS platforms offer flexibility and scalability to meet diverse content needs.
- Customer data platform (CDP)
A CDP collects and unifies customer data from multiple sources, providing a comprehensive view of each customer. This data is crucial for personalizing experiences and understanding customer behavior. Leading CDPs enable businesses to deliver targeted and relevant content.
- Analytics and insights tools
Analytics tools are essential for understanding user behavior and measuring the effectiveness of digital strategies. They can provide detailed insights into user interactions, helping businesses make data-driven decisions to optimize their digital experiences.
- Personalization engines
Personalization engines use AI and machine learning to deliver customized content and recommendations. These tools analyze user data to create personalized experiences that increase engagement and satisfaction.
- Customer relationship management (CRM) systems
CRM systems help manage customer interactions and relationships. They integrate with other tools to provide a unified view of customer data, enabling personalized communication and improved customer service.
- Marketing automation platforms
Marketing automation tools streamline and automate marketing tasks like email campaigns, social media posts, and lead generation.
- User feedback tools
Gathering user feedback is vital for continuous improvement. Tools like these allow businesses to collect and analyze feedback, helping them understand user needs and pain points.
- Security and privacy tools
Ensuring data security and privacy is paramount. Tools like SSL certificates, encryption software, and compliance management platforms help protect user data and ensure adherence to regulations like GDPR.
By leveraging these tools, businesses can create a cohesive and engaging digital experience that meets the needs of their users and drives business success.
Digital experience monitoring with Dynatrace
With increasing competition among service providers to win user loyalty and meet users’ constantly increasing expectations, delivering excellent digital experiences is more important than ever. The key to delivering excellent digital experiences is the ability to see and understand the entire user journey.
Dynatrace offers comprehensive digital experience monitoring and business analytics that drive to the heart of the user journey. The Dynatrace DEM solution includes Real User Monitoring, Session Replay, and Synthetic Monitoring, that enables you to capture the right metrics so you can tailor and optimize user experiences. Together with the Business Analytics solution, you can start optimizing your digital channel for better business outcomes and at the same time improve collaboration between IT and LoB stakeholders.
For example, Dynatrace tracks many common KPIs by default, and supports the addition of custom KPIs for metrics more specific to your business needs.
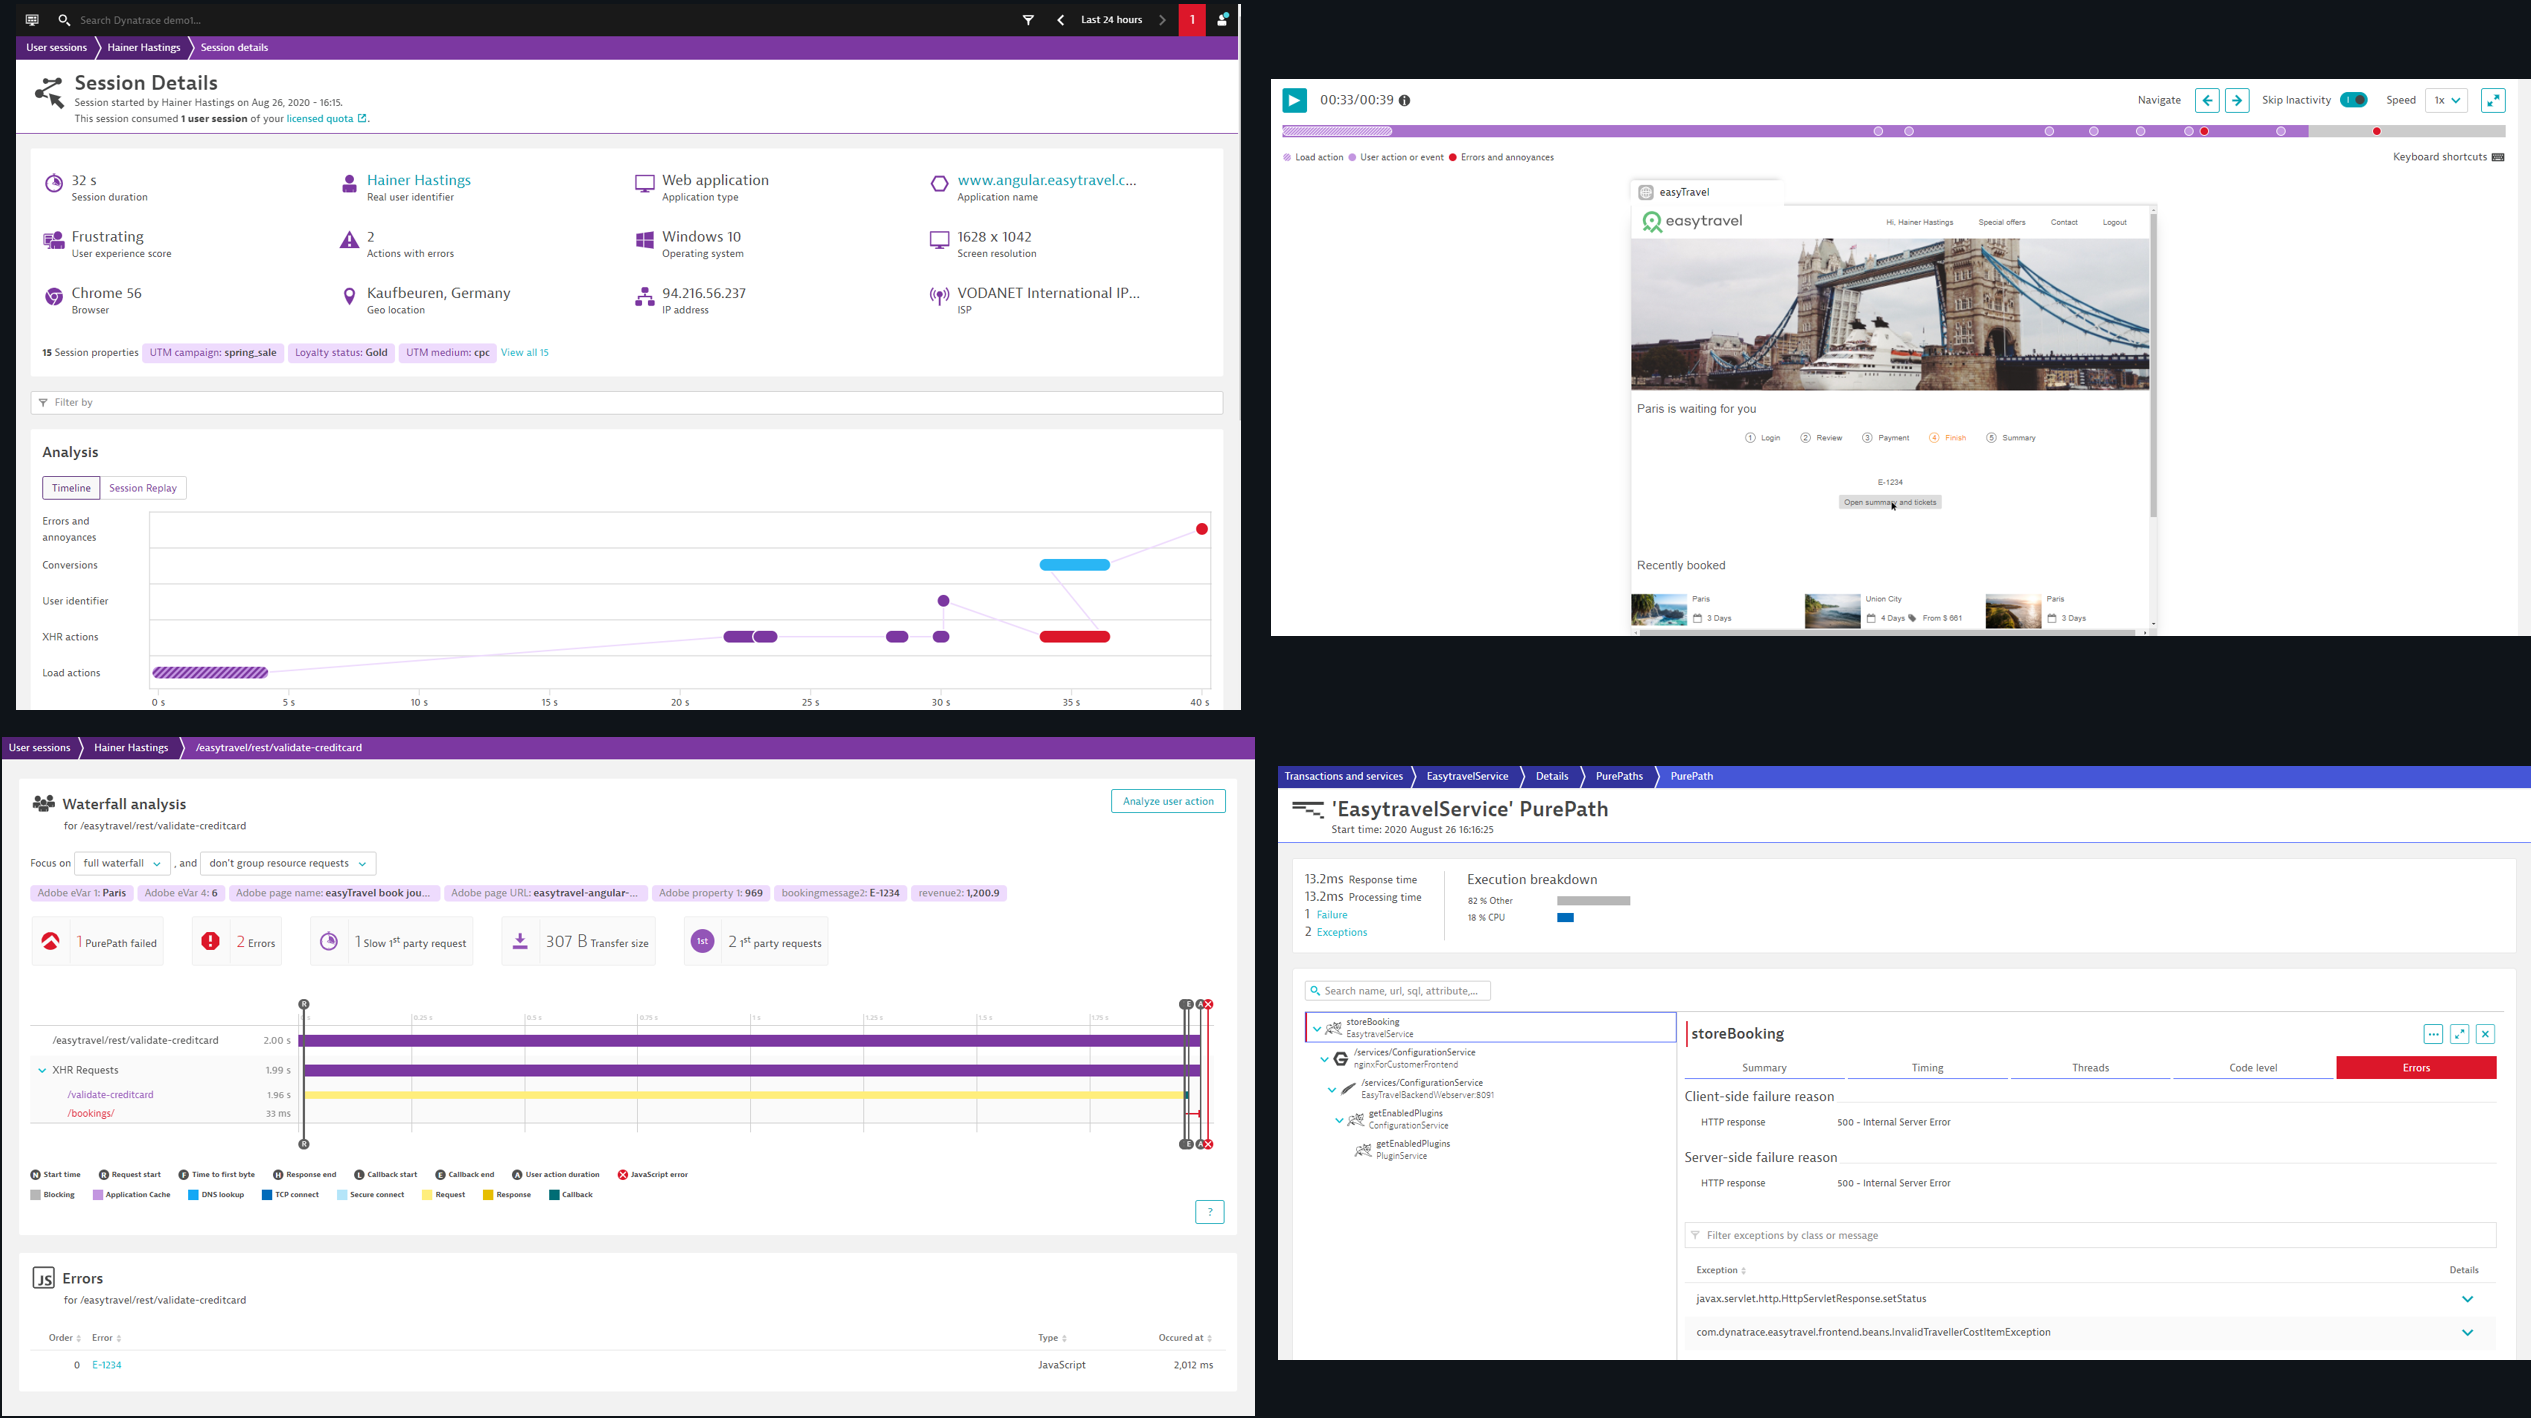
The four screenshots below show a single user session through the lens of four different stakeholders. The insights cover which marketing campaign brought the user to the touchpoint (upper left), the session replay of an error (upper right), the waterfall analysis of a poorly performing interaction (lower left), and the stack trace of the error message detailing the technical issue the customer was facing (lower right).
Dynatrace rolls up all this digital experience data into meaningful metrics for IT teams and business stakeholders, giving them a real-time overview of how digital experience impacts business success. With this insight, teams can instantly see the root cause of any issues, or trigger automatic responses to resolve issues before they impact the user experience.
What makes the Dynatrace approach so compelling for companies on digital transformation journeys is the breadth of solutions integrated into an open platform. With AIOps at the core of the Dynatrace platform, you can capitalize on the end-to-end visibility over your entire software stack to harness data from every digital touchpoint into actionable insight.
Download the Digital Experience Playbook to learn how to drive business value and start optimizing your digital channels for better business outcomes.


Looking for answers?
Start a new discussion or ask for help in our Q&A forum.
Go to forum