

A guide to distributed traces and spans
OpenTelemetry (OTel) provides an open, vendor-neutral framework for generating, collecting, and standardizing telemetry data across distributed systems. It includes APIs, SDKs, and tools for working with traces, metrics, and logs. In this blog, we focus on two foundational tracing concepts — traces and spans — and how to think about them in the context of modern, distributed systems.
Rather than treating these as abstract observability terms, we ground them in real-world scenarios and practical examples. The goal is to build an intuitive understanding of how traces and spans work together, especially in today’s architectures that include microservices, AI systems, LLMs, and autonomous agents.
What is an OpenTelemetry trace?
Imagine you are making an online purchase. Behind the scenes, that single action of payment triggers a request that travels through many services, such as authentication, fraud detection, balance checks, payment gateways, and settlement systems.
So how do we know:
- Where did the request go?
- Which services were involved?
- Where was time spent
- Where did failures occur?
This is where a distributed trace (or simply a trace) helps.
A trace represents the complete end‑to‑end journey of a single request or transaction as it flows through a distributed system.
It ties together all the work done across services so we can see the full story of what happened — from the moment the request entered the system to the moment it completed or failed.
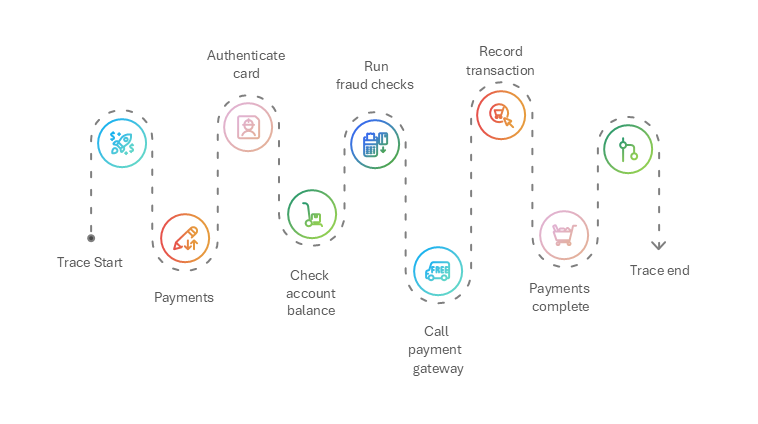
A trace helps answer questions such as:
- How did this request traverse the system?
- Which service introduced latency or errors?
- What was the critical path that determined the overall response time?
In cloud-native and microservices architectures, traces are essential because a single request rarely stays within a single service. Requests may traverse many distributed services and infrastructure components, which is why the resulting end-to-end record is referred to as a distributed trace.
A span – one of the building blocks of a trace, is created through instrumentation — the process of embedding telemetry collection into an application. This can be done without code changes (known as auto or zero-code instrumentation), typically by operators, admins, or SREs, or programmatically by developers using an SDK (known as code-based or manual instrumentation).
How is a distributed trace visualized?
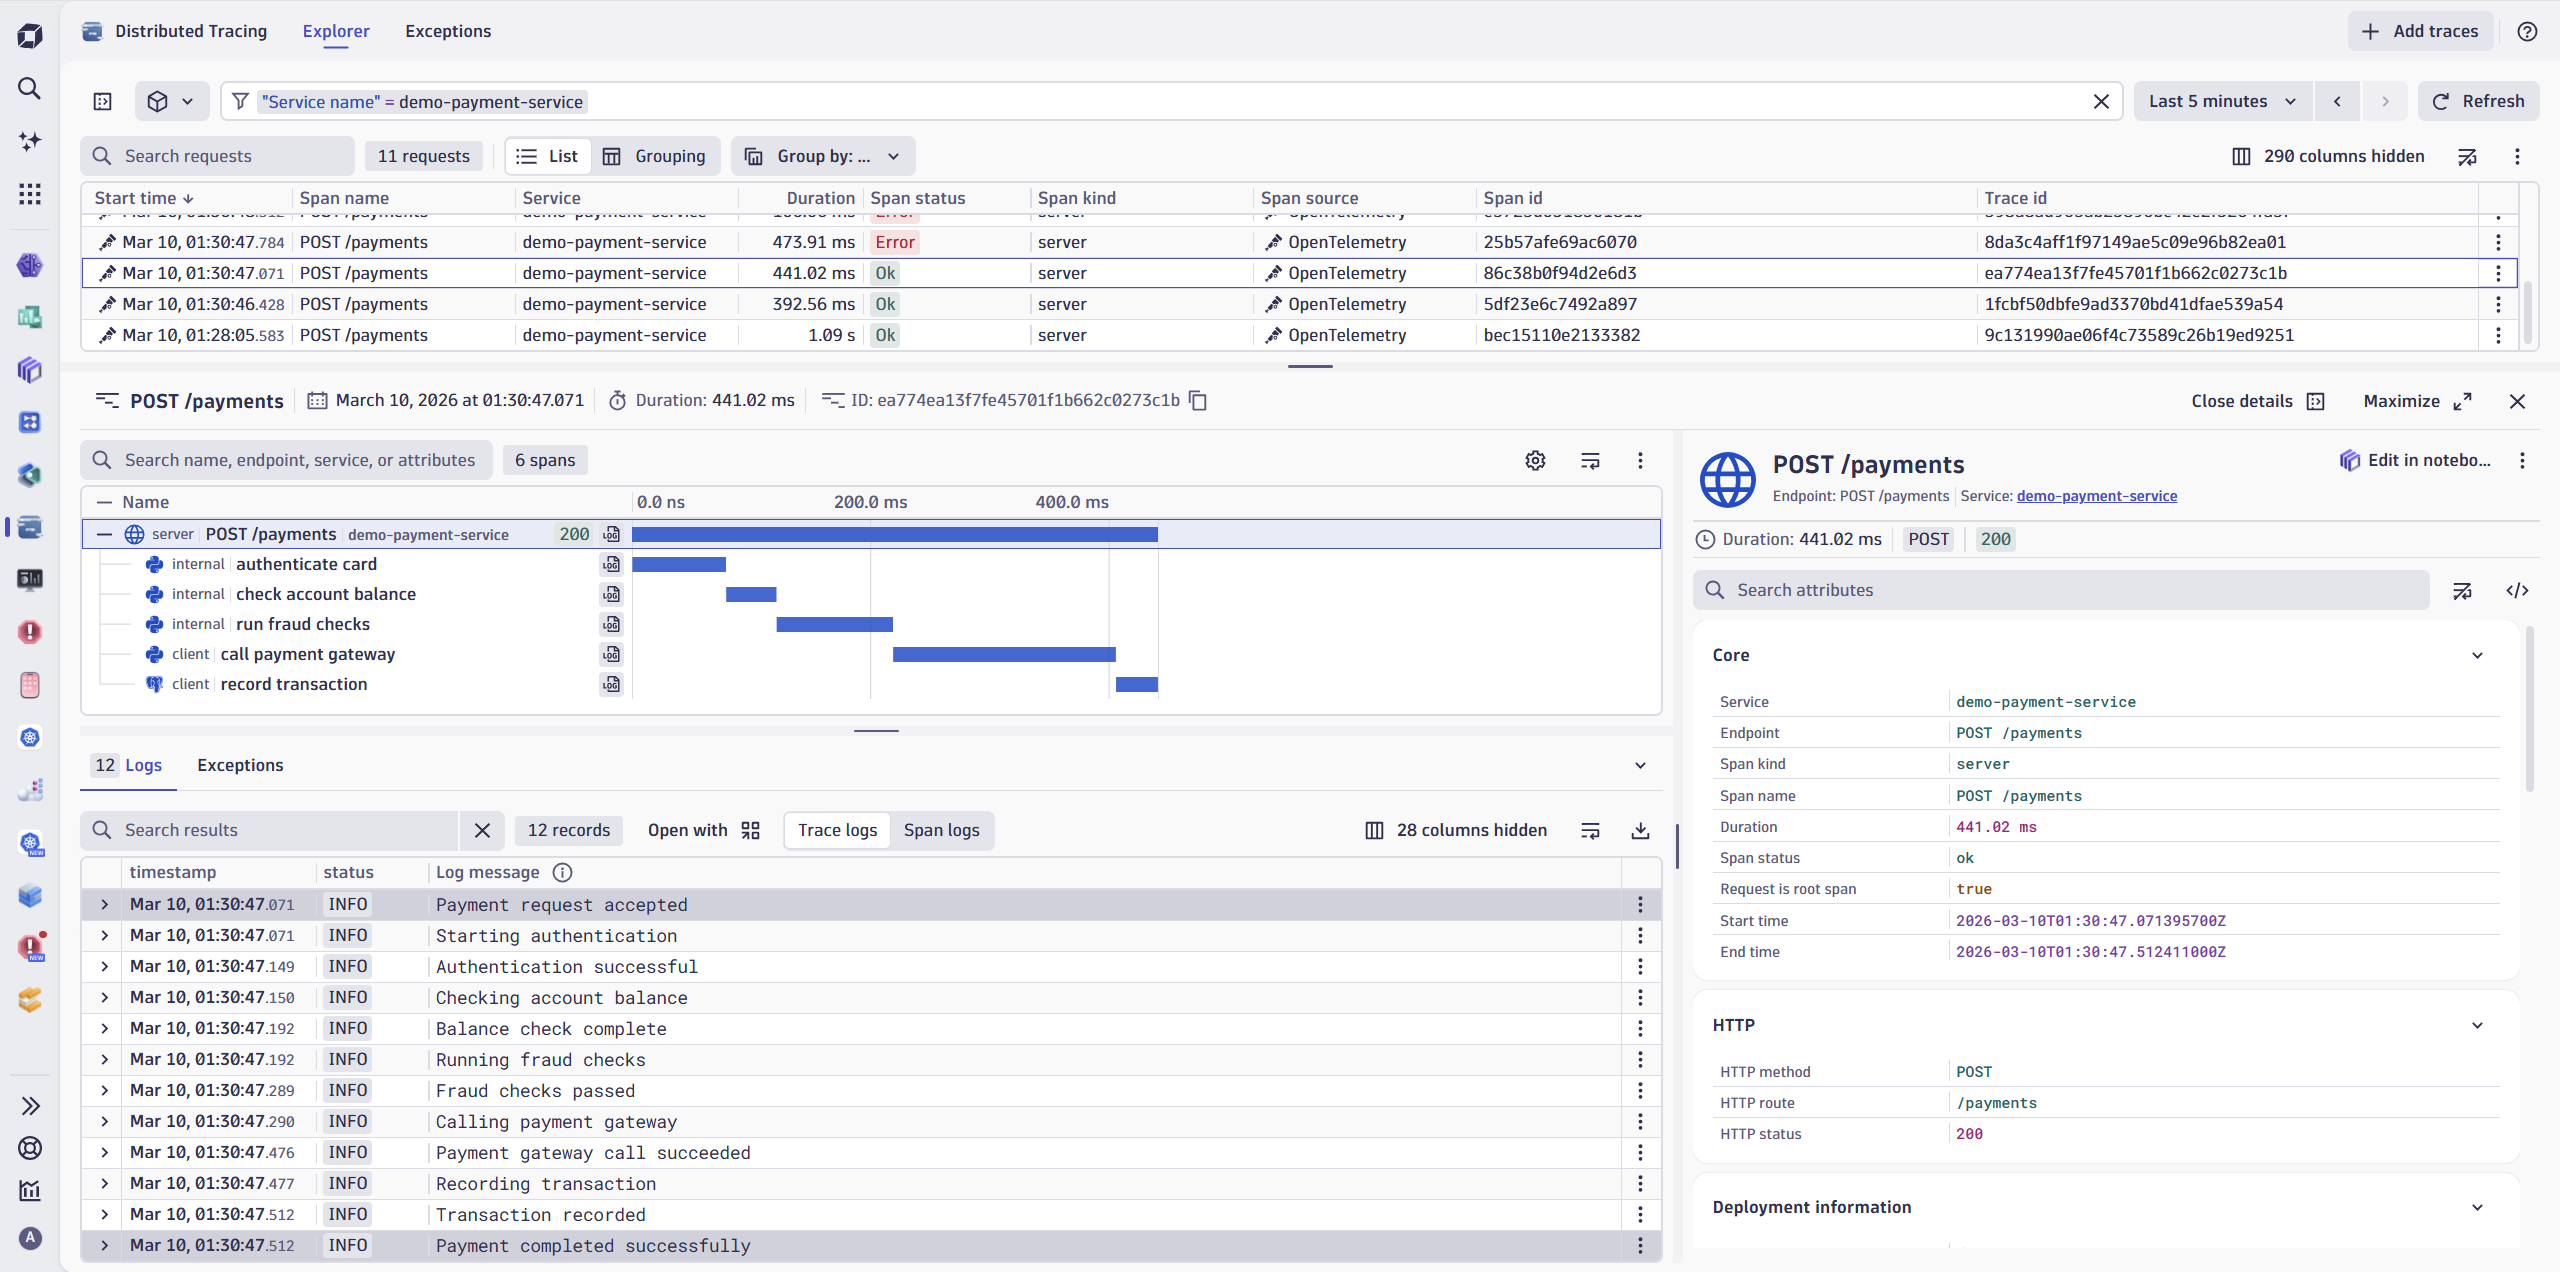
In the screenshot below, you are looking at the Dynatrace Distributed Tracing app where you can visualize OpenTelemetry traces.
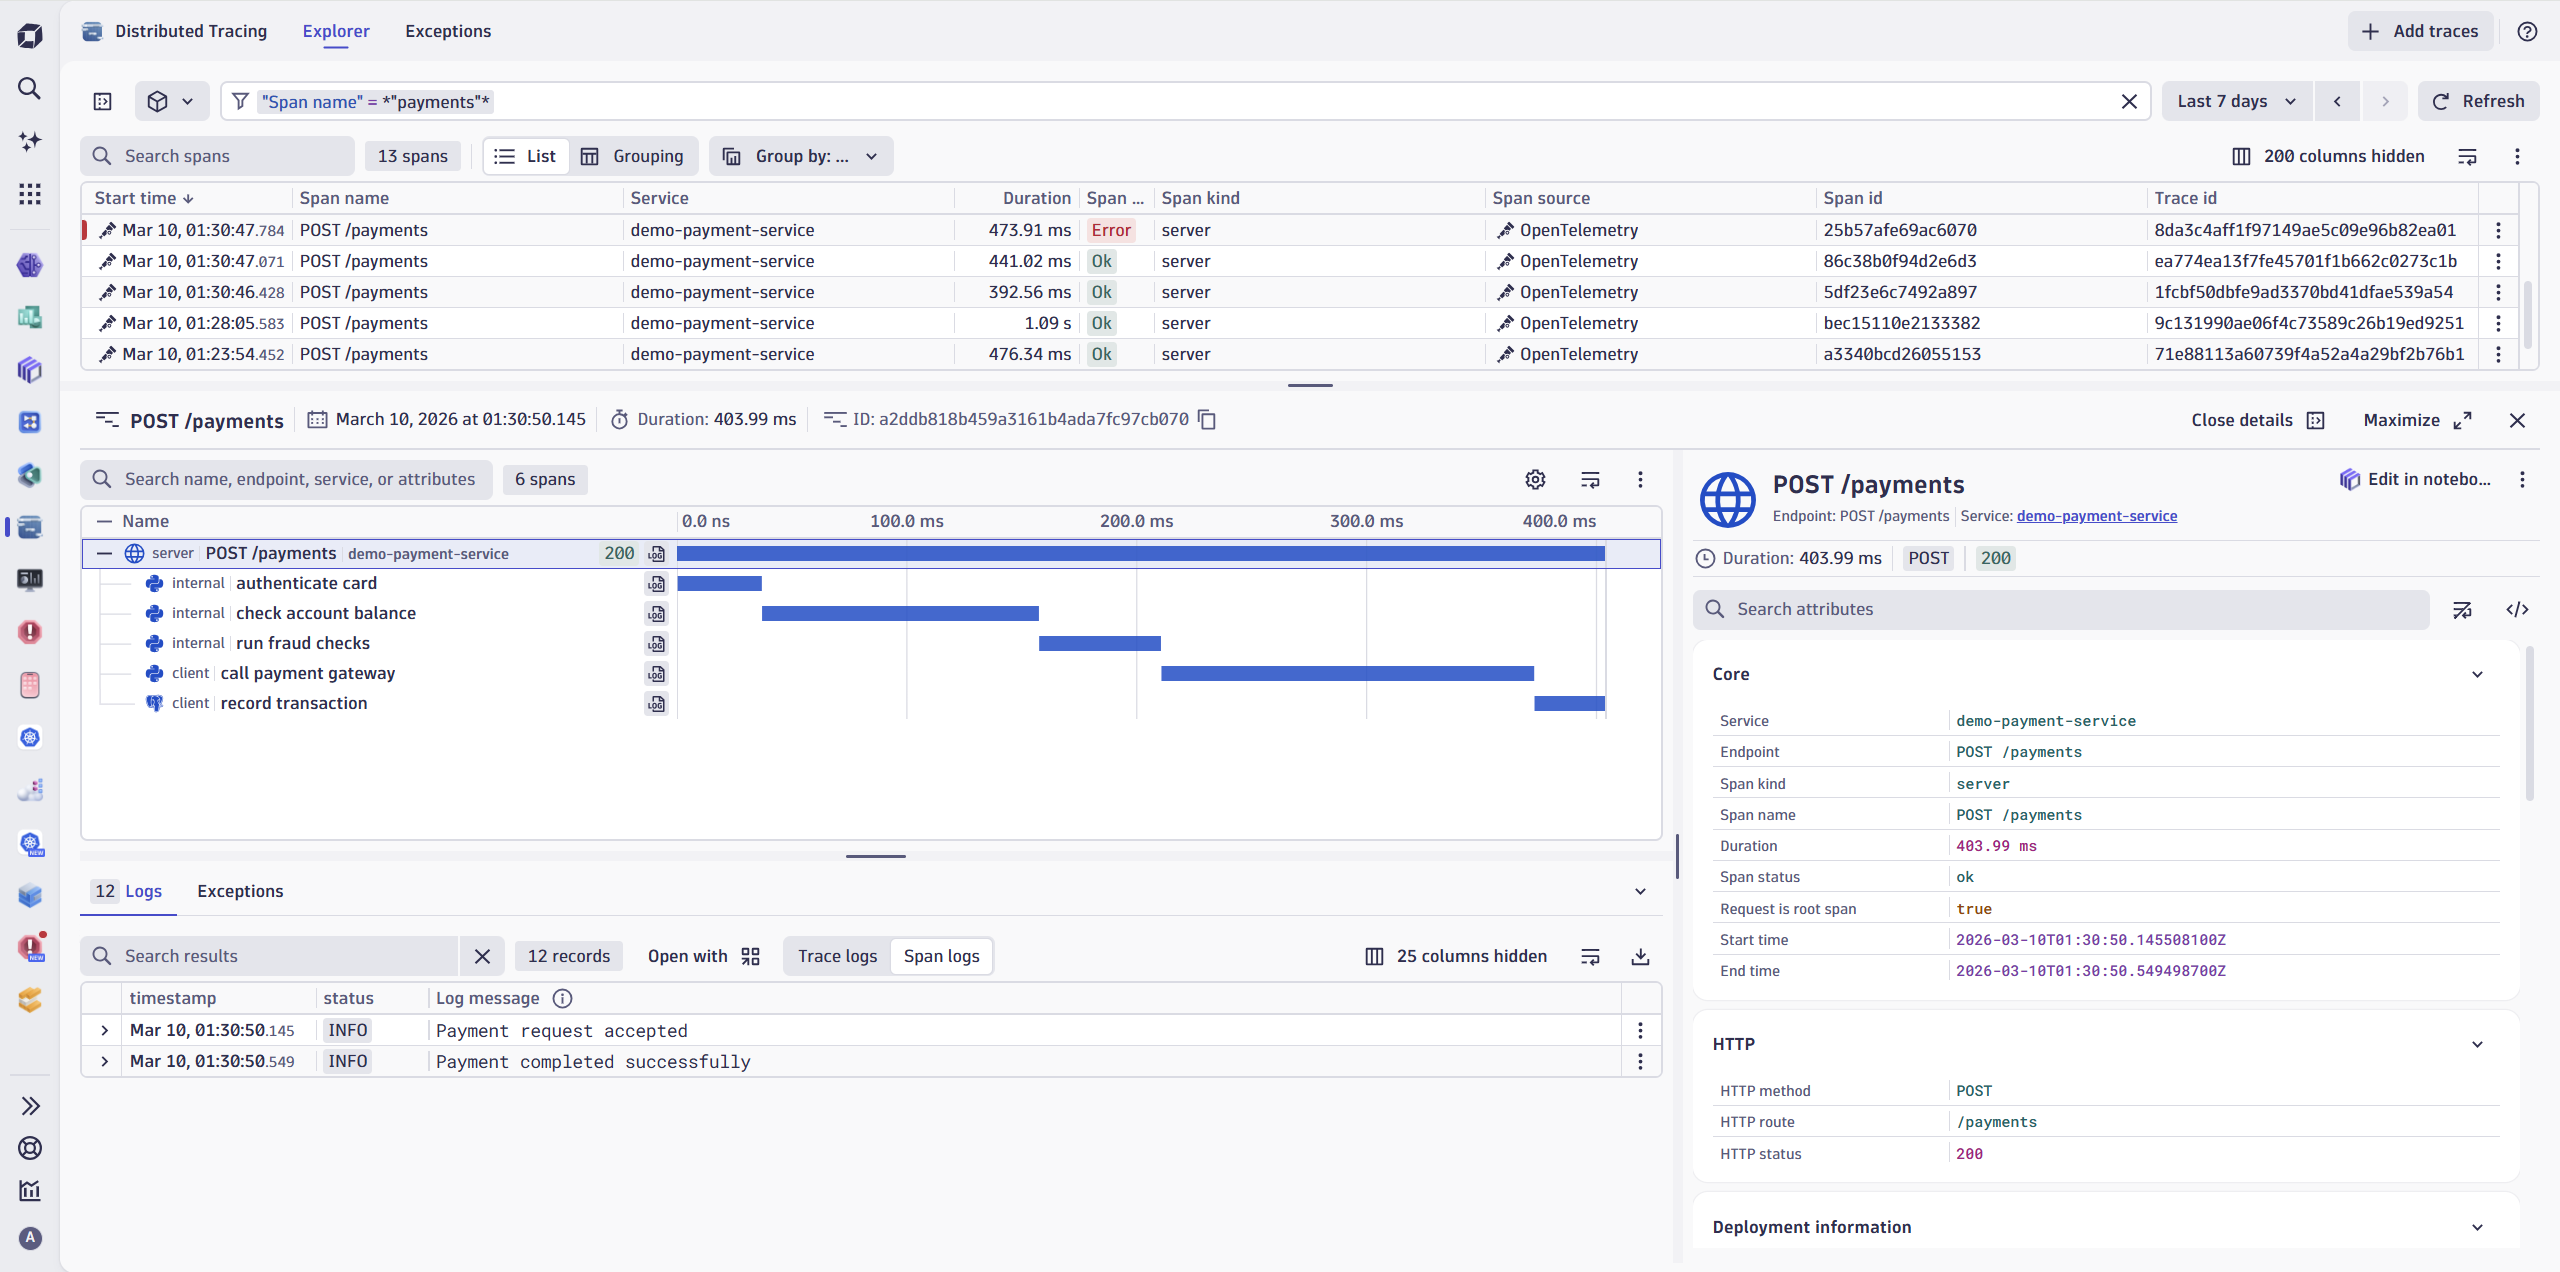
A distributed trace is often represented as a waterfall chart, as shown in the middle of the screenshot. In this example, you are seeing a distributed trace for the API making a POST call to /payments. This payment API makes three critical internal calls: authenticate card, check account balance, and run fraud checks. These calls are called “spans,” which we’ll explain below. These three steps have their start and end times recorded, along with any errors or exceptions. You would see those span attributes on the right section of the screen.
The request then acts as a client and makes a call to the payment gateway, followed by another client call to record the transaction. The labels internal and client next to each span names represent the span kind. Span kind could also be servers, consumers, or producers in addition to internal and client.
What is a span?
A span represents a unit of work or operation. Each horizontal bar in the screenshot above represents a span that may cross multiple service boundaries.
Spans are the building blocks of traces. Each span has a unique aspect that ties it back to the original trace: they all share a common trace ID.
Span Hierarchy: Root, Parent, Child, and Sibling Spans
Spans are organized hierarchically. A span with no parent span ID is known as the root span, meaning it’s the first operation that starts the trace. Child spans represent sub-tasks, and sibling spans share the same parent.
How spans are linked together in a trace
Each span would have a span id, trace id and an optional parent id, these contexts are propagated via carriers (like HTTP headers, gRPC metadata, or message headers) from one process boundary to another and this process is known as context propagation.
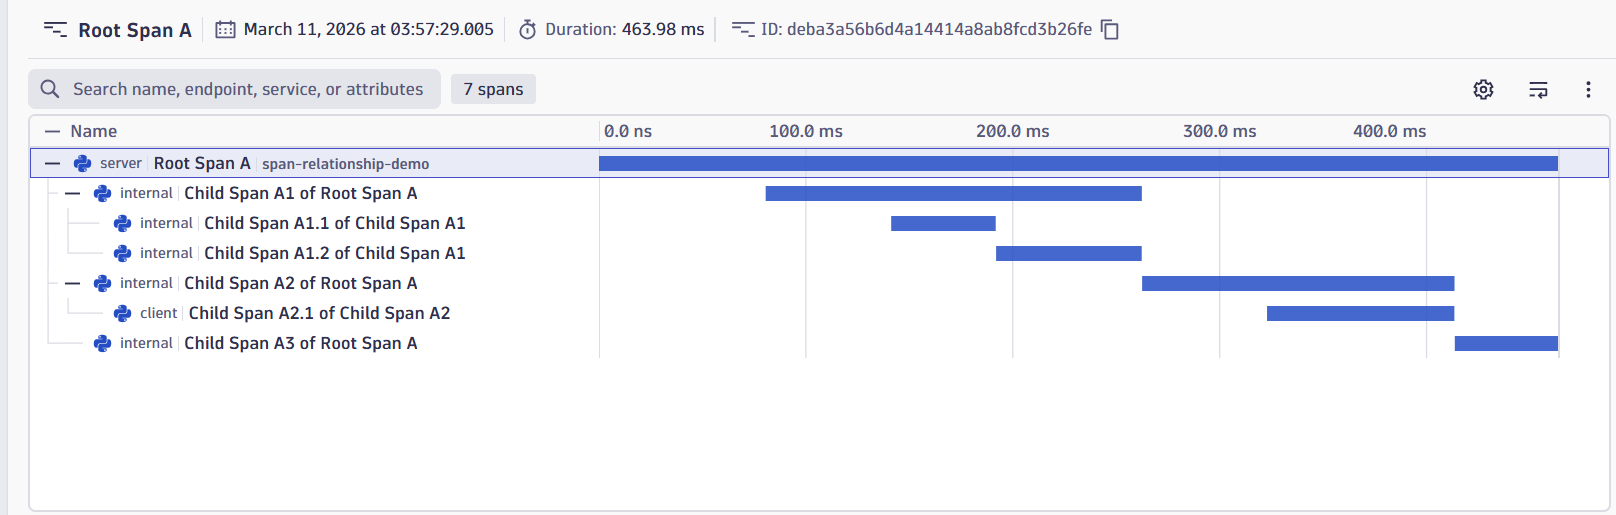
In the sample trace shown above, the Root Span A is the first span in the trace. It represents the full lifecycle of the request, and because it has the parent ID set to null (i.e., the parent id does not exist), it is the root span. The root span typically corresponds to the entry point of a request into a system, such as an HTTP endpoint, API call, or message consumption.
A parent span is any span that creates or triggers other spans during the execution of a request. For example, Child Span A1 of Root Span A is a child of the root span, but it also acts as a parent span for Child Span A1.1 and Child Span A1.2 because those operations occur within its execution context.
A child span represents a smaller operation or sub-task that happens as part of a larger operation. Child spans always have a parent span ID pointing to the span that initiated them. In the trace above, spans such as Child Span A1, Child Span A2, and Child Span A3 are children of the root span, while Child Span A1.1, Child Span A1.2, and Child Span A2.1 are deeper nested children representing more granular steps within the request.
Together, root, parent, and child spans form a hierarchy that describes how a request flows through different components of a system. This hierarchical structure allows observability tools to reconstruct the full execution path of a request and visualize how different operations relate to each other in time.
Span names:
If you look closely at the screenshot below, all the spans have meaningful names, but this clarity does not happen naturally. Meaningful span names result from deliberate instrumentation choices made by developers and operators.
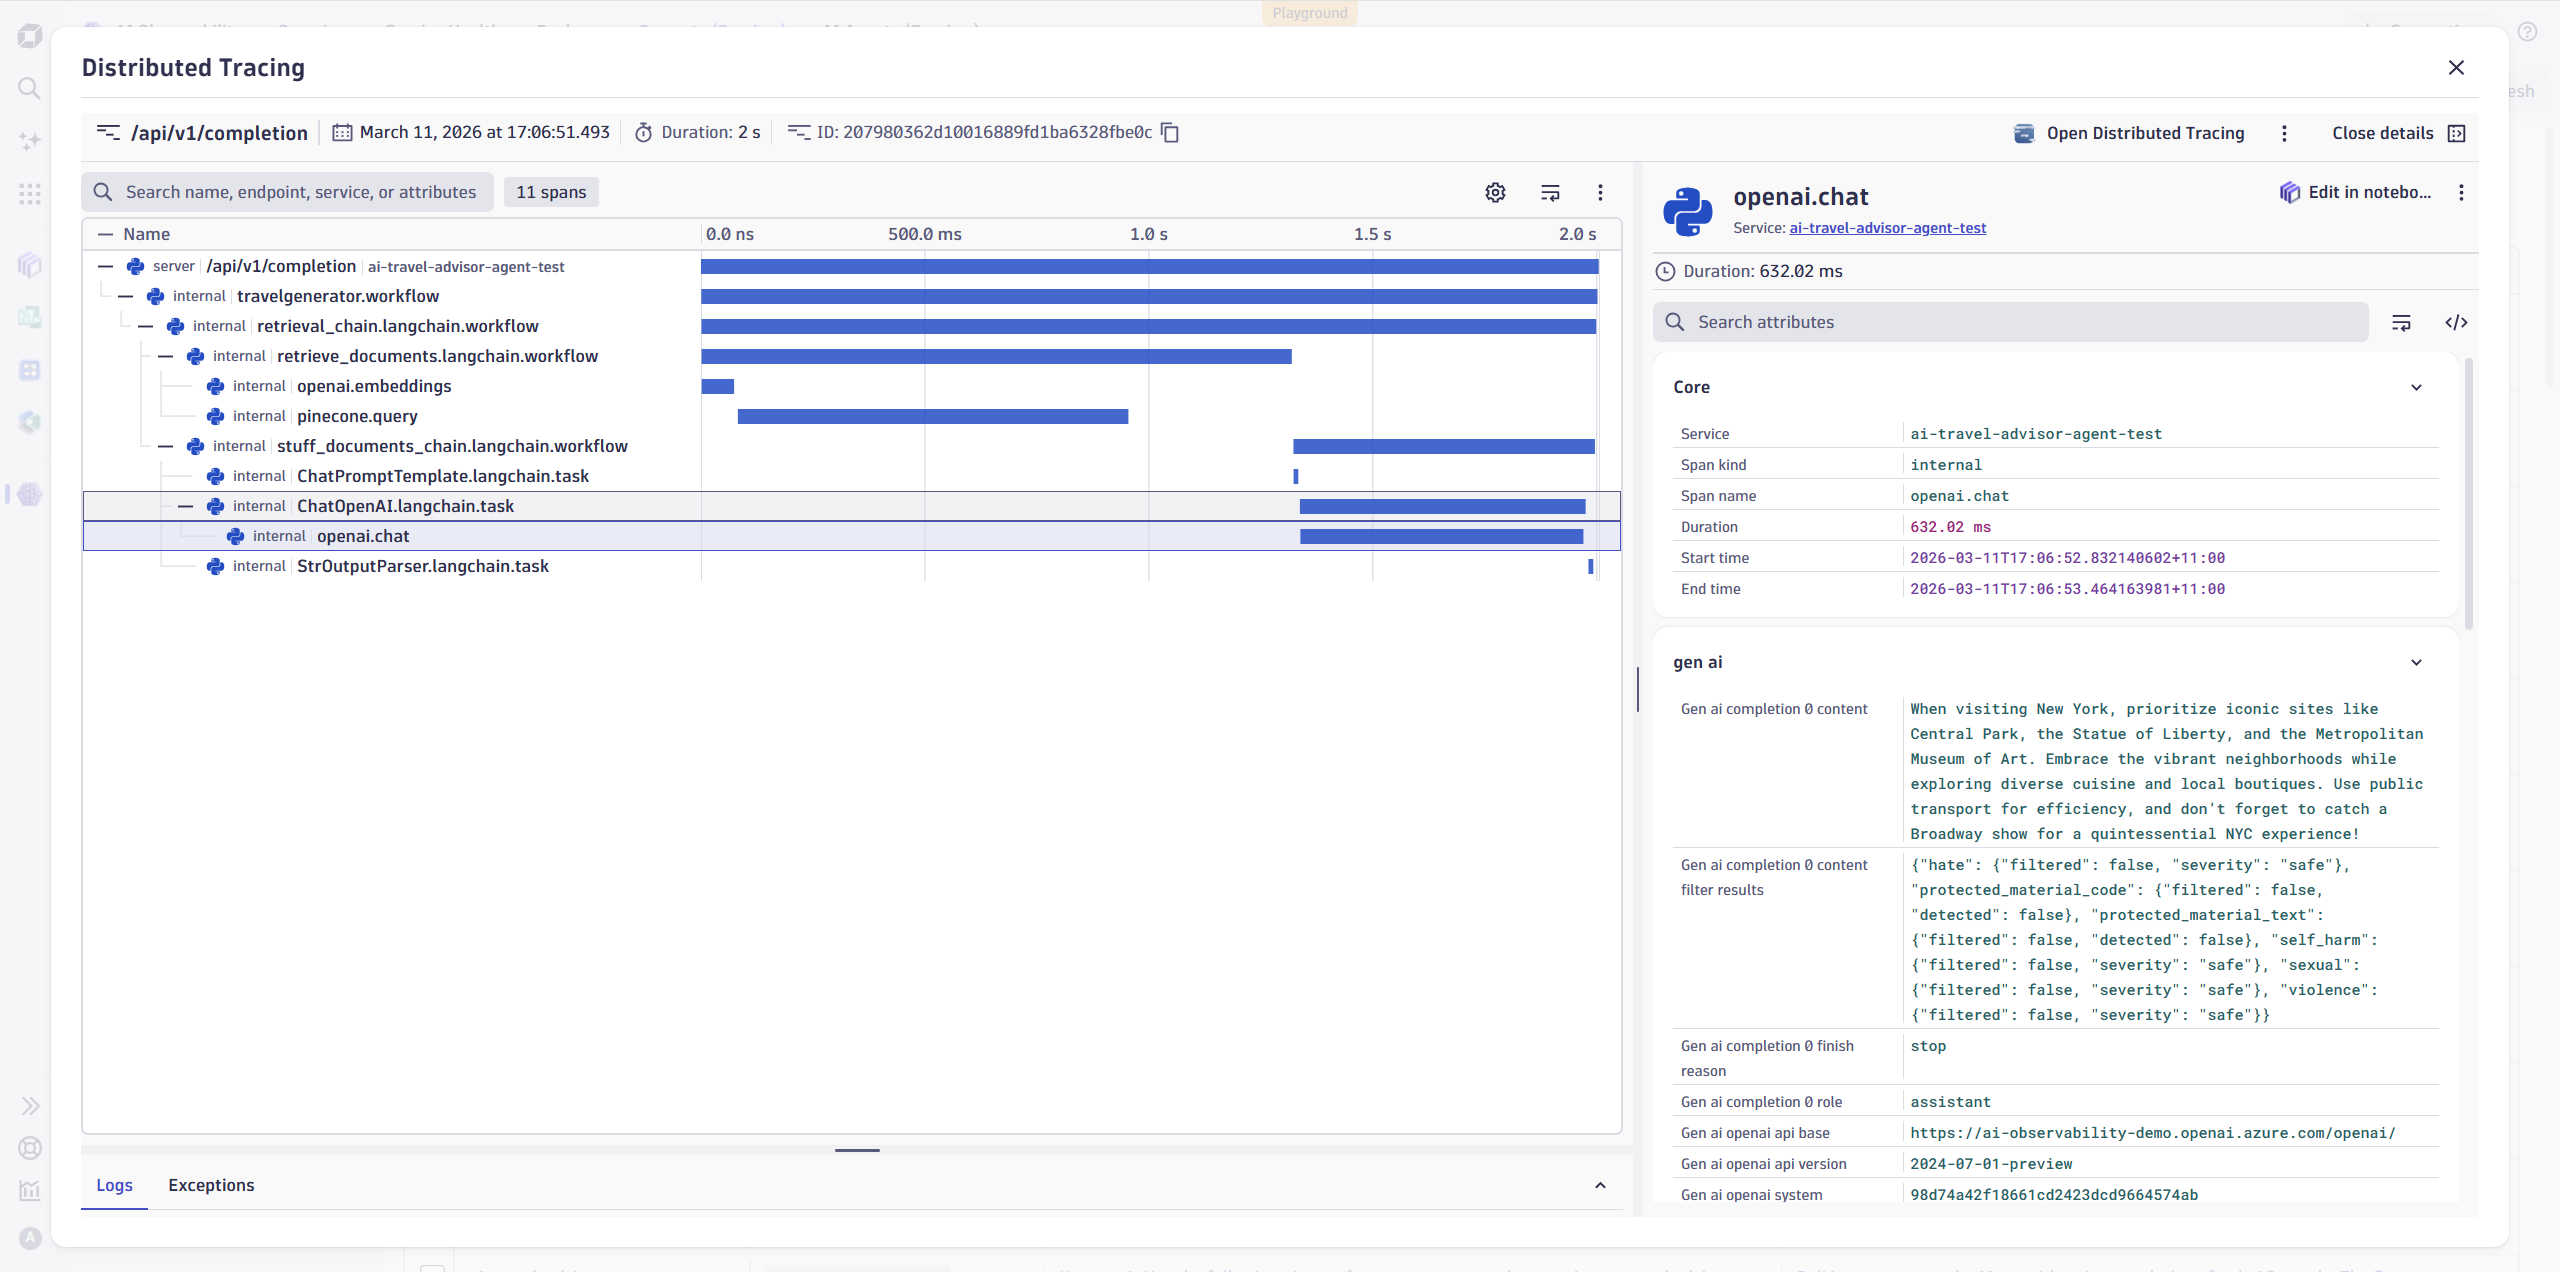
For example, spans like /api/v1/completion, retrieve_documents.langchain.workflow, and openai.chat are intentionally named to reflect what operation is being performed and where it fits in the overall workflow. When span names accurately describe the unit of work—such as handling an API request, retrieving context, or calling an LLM—they make traces far more readable and actionable.
Well-chosen span names help quickly identify where time is spent, understand system behavior, and troubleshoot issues, especially in complex workflows like LLM pipelines.
Span and its attributes
At first glance, a span mainly shows the time taken to complete a unit of work. It also plays a critical role in capturing errors, including failure states and stack traces when something goes wrong. While this might seem like all you need, spans carry much richer context than just duration and errors.
Spans can also describe what operation was performed, where it ran, how it was triggered, and which downstream or upstream interactions were involved. Attributes such as span kind, status, resource context, and custom metadata add important signals that help you reason about system behavior, dependencies, and performance characteristics at a deeper level.
We’ll explore the full anatomy of a span and why these attributes matter in more detail in a future blog.
Distributed traces and logs
Although logs are a completely different signal, logs can be directly associated with spans. This allows you to view spans and logs together in Dynatrace. This tight correlation makes it much easier to understand what is happening within a request at a specific point in time as it flows through the system.
In the screenshot below, you can see an OpenTelemetry trace along with logs for individual spans and, ultimately, the entire trace. As the request progresses through different stages—such as authentication, balance checks, fraud checks, and transaction recording—the corresponding log entries appear in context. This makes it simple to move from a high-level trace view to detailed log messages without losing visibility into where and when each event occurred.
By combining traces and logs in a single view, you gain a more complete picture of system behavior, enabling faster troubleshooting and deeper insights into how requests are processed end to end.
Putting traces and spans into practice
In this blog, we learned that a distributed transaction trace, or simply a trace, represents the complete end-to-end journey of a single request or transaction—such as completing a payment or performing a checkout—through a distributed system. We also learned that a span is a unit of work or operation, such as making a call to a payment gateway, performing an internal computation, or committing data to a database.
We learned that context consists of the trace id, parent span id, and span id, and that this context propagates across process or service boundaries via carriers (like HTTP), using a mechanism known as context propagation. Finally, we learned that spans contain many useful attributes that help us understand what is happening within the environment and assist in troubleshooting, as well as identifying potential issues or opportunities for optimization.
We also learned how spans and traces can provide visibility into instrumented operations within LLM-based workflows.
In the next blog, we will dive deeper into the anatomy of a span, as it reveals much more than just names, errors, and durations.


Looking for answers?
Start a new discussion or ask for help in our Q&A forum.
Go to forum