
To deliver outstanding customer experience for your applications and websites, you need reliable benchmarks that measure what good customer experience looks like. Dynatrace Visually complete is a point-in-time web performance metric that measures when the visual area of a page has finished loading. In terms of user experience measurements, optimizing Visually complete timing is more valuable than optimizing other page load timings because Visually complete reflects the amount of time that your real users spend waiting for above-the-fold content to load.
Dynatrace is the only solution that provides these user experience metrics consistently for real user monitoring as well as for synthetic monitors.
New web performance metrics and revamped Visually Complete
We’re excited to announce that we’ve added new performance metrics so that you can further improve your web performance, including First contentful paint, First input delay, and Largest contentful paint. Additionally, we’ve completely revamped the Visually complete algorithm and how it’s configured.
With Dynatrace version 1.194, you have more control over how Visually complete is calculated. More precisely, you can now:
- Analyze application performance with newly added web performance metrics.
- Easily dashboard your favorite new metric by leveraging calculated metrics.
- Analyze issues across different dimensions in the Multidimensional analysis view.
- Leverage the new metrics and Visually complete during user action analysis.
- Get more granular control over your Visually complete calculations.
- Analyze all details with the new metric markers on aggregated waterfall charts.
Analyze application performance with newly added web performance metrics
Customers are increasingly asking us to support new performance metrics that have been introduced in other tools such as Lighthouse, Chrome DevTools, or PageSpeed Insights. Proven metrics such as First contentful paint, First input delay, and Largest contentful paint are important to our customers, not just for measuring and improving their performance, but also for benchmarking their development teams.
With Dynatrace version 1.194, the following new metrics are immediately available on your Multidimensional analysis, Waterfall analysis, and User action details pages:
- First paint: The time spent from navigation to when the browser renders the first non-default background element
- First input start: The point in time when the user first interacts (for example, clicks) with the page
- First input delay: The time spent from first input start to when the browser is able to respond to that interaction
- First contentful paint: The time spent from navigation to when the browser renders the first bit of content (such as text or images)
- Largest contentful paint: The time spent from navigation until the largest content element in the viewport is completely rendered
Note: In the waterfall chart, the metrics First input start and First input delay are displayed under the label First input.
What you can achieve
Here’s a look at how you can use the new metrics and Visually complete within the Multidimensional analysis, Waterfall analysis, and User action details views.
Analyze performance issues across different dimensions in the Multidimensional analysis view
In the past, it was difficult to measure how quickly the main content of a web page loaded and became visible to users. Even today, most of our competitors rely heavily on outdated metrics such as load or DOMContentLoaded to provide a means of measuring page load times, although these metrics don’t really capture what your users see. This is why, in addition to Speed index, we’ve added Largest contentful paint (LCP) to the Multidimensional analysis view to provide you with an even more accurate way of measuring when the main content of your pages has loaded.
Apart from measuring your page load times in the field, you might also use this new metric in a lab setting and base release decisions on the results. You could, for example, leverage action and session properties in Dynatrace to add your release version as context information, and then use the release information to compare your previous version with your new version to determine if the new version is safe to release.
Largest contentful paint (LCP) can also be used in the Multidimensional analysis view as a field metric in the Performance over time dimension—by combining it with other available dimensions, you can identify the root cause of certain page-load issues:
- Distribution: View the impact of user activity on performance and get an understanding of how your selected metric varies across user actions and during the selected period.
- Browsers: Find performance bottlenecks related to particular browser families and versions.
- Geolocations: See how performance is affected across different locations.
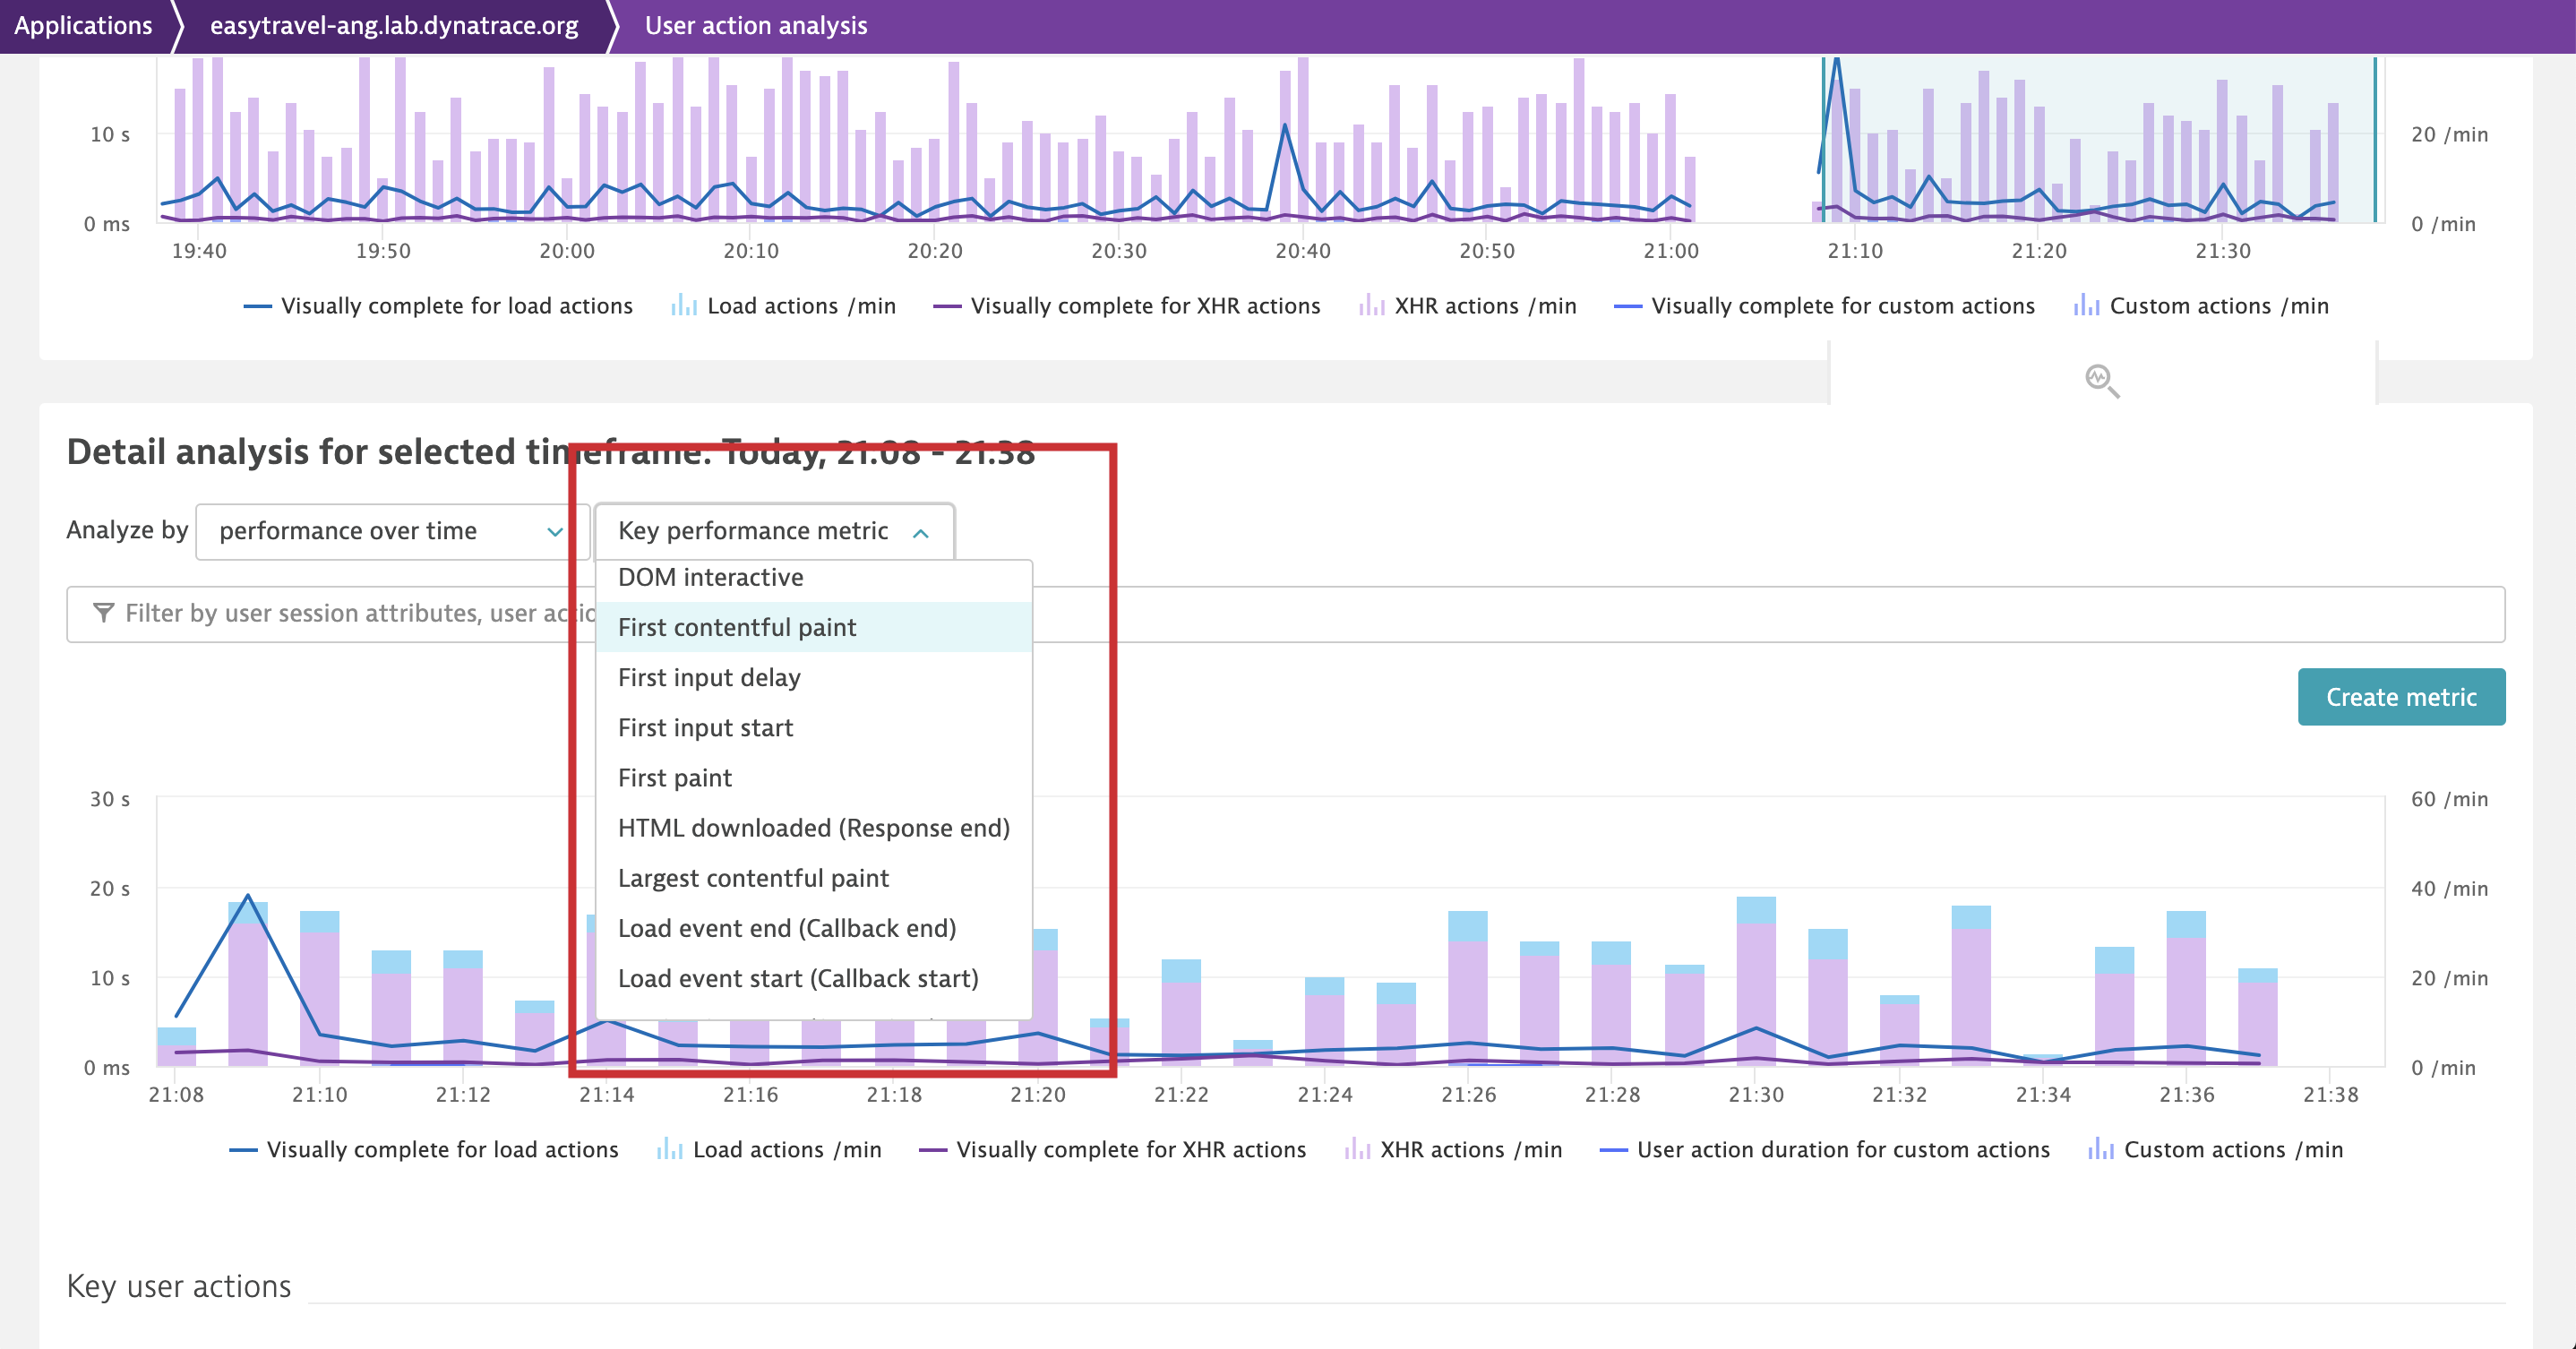
Leverage the new metrics and Visually Complete in user action analysis
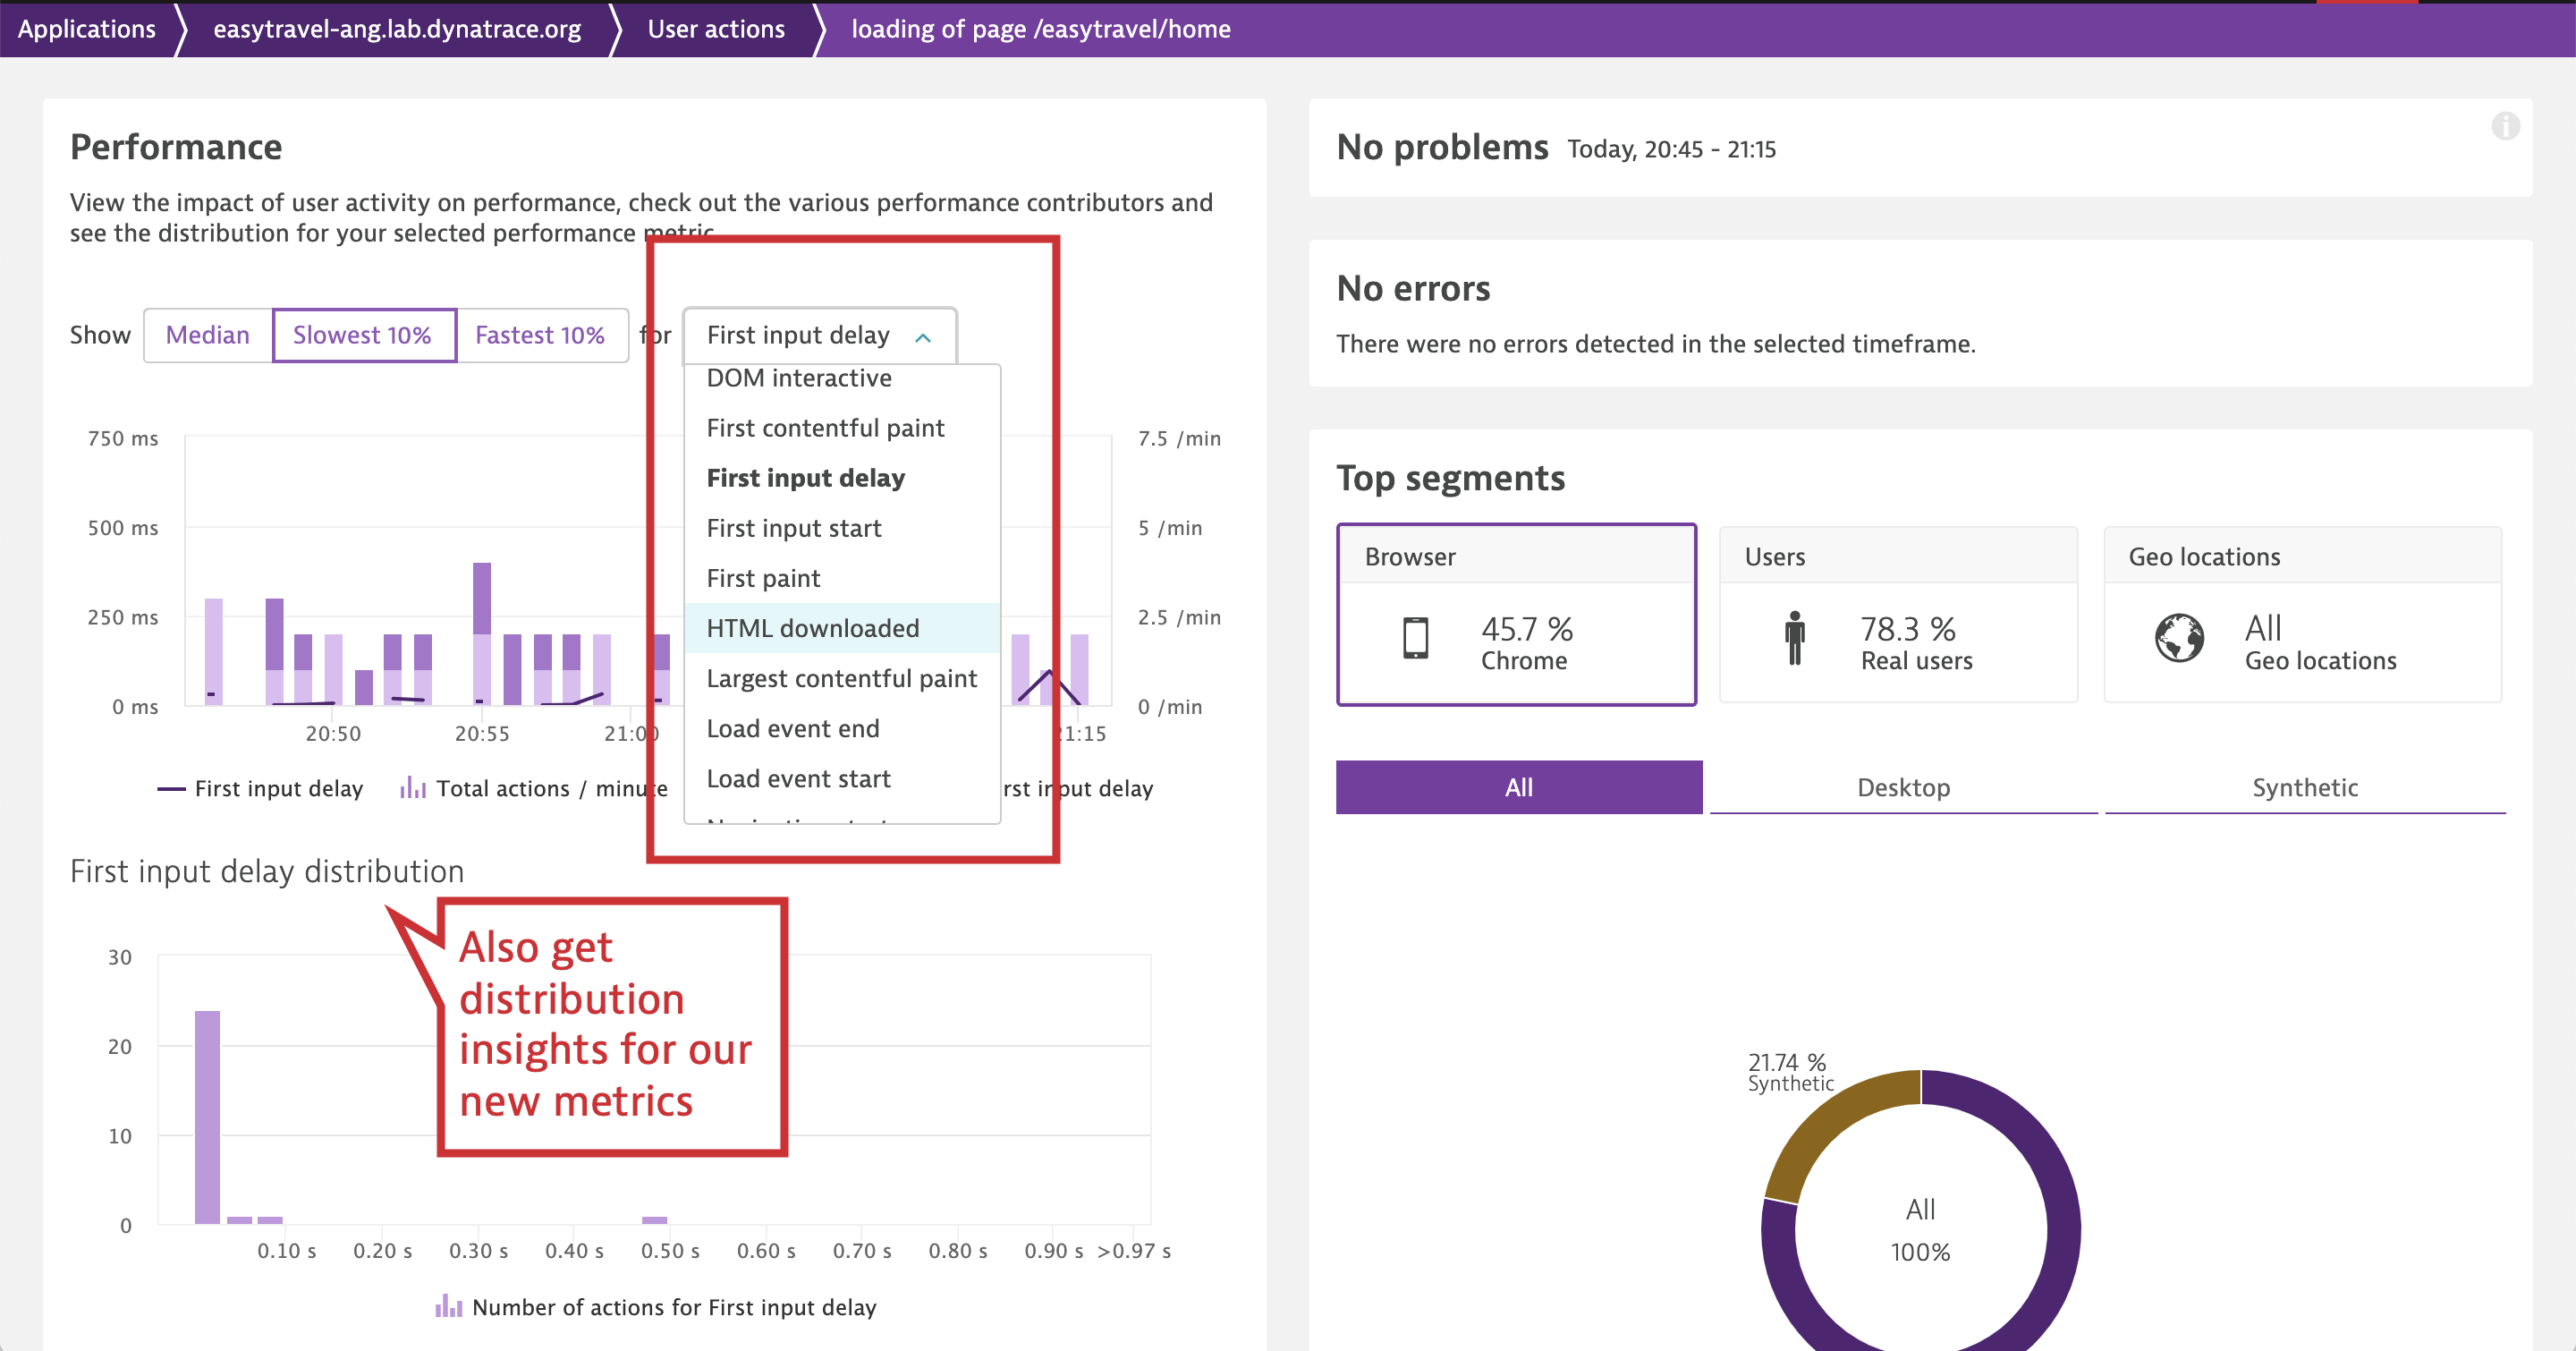
You can use the newly added performance metrics to analyze the performance of your user actions on the user action details page. As with any other metric, you can check the distribution of metric timings across different instances of the action on the Performance card. For example, you can use First contentful paint and First input delay to measure your users’ first impression and analyze the distribution of measurements across your load actions. While First contentful paint gives you an indication of how fast your site loads, First input delay provides you with a measure of how responsive your page is when your users first interact with it (Google promotes use of First input delay for making sure that your web pages make a good first impression).
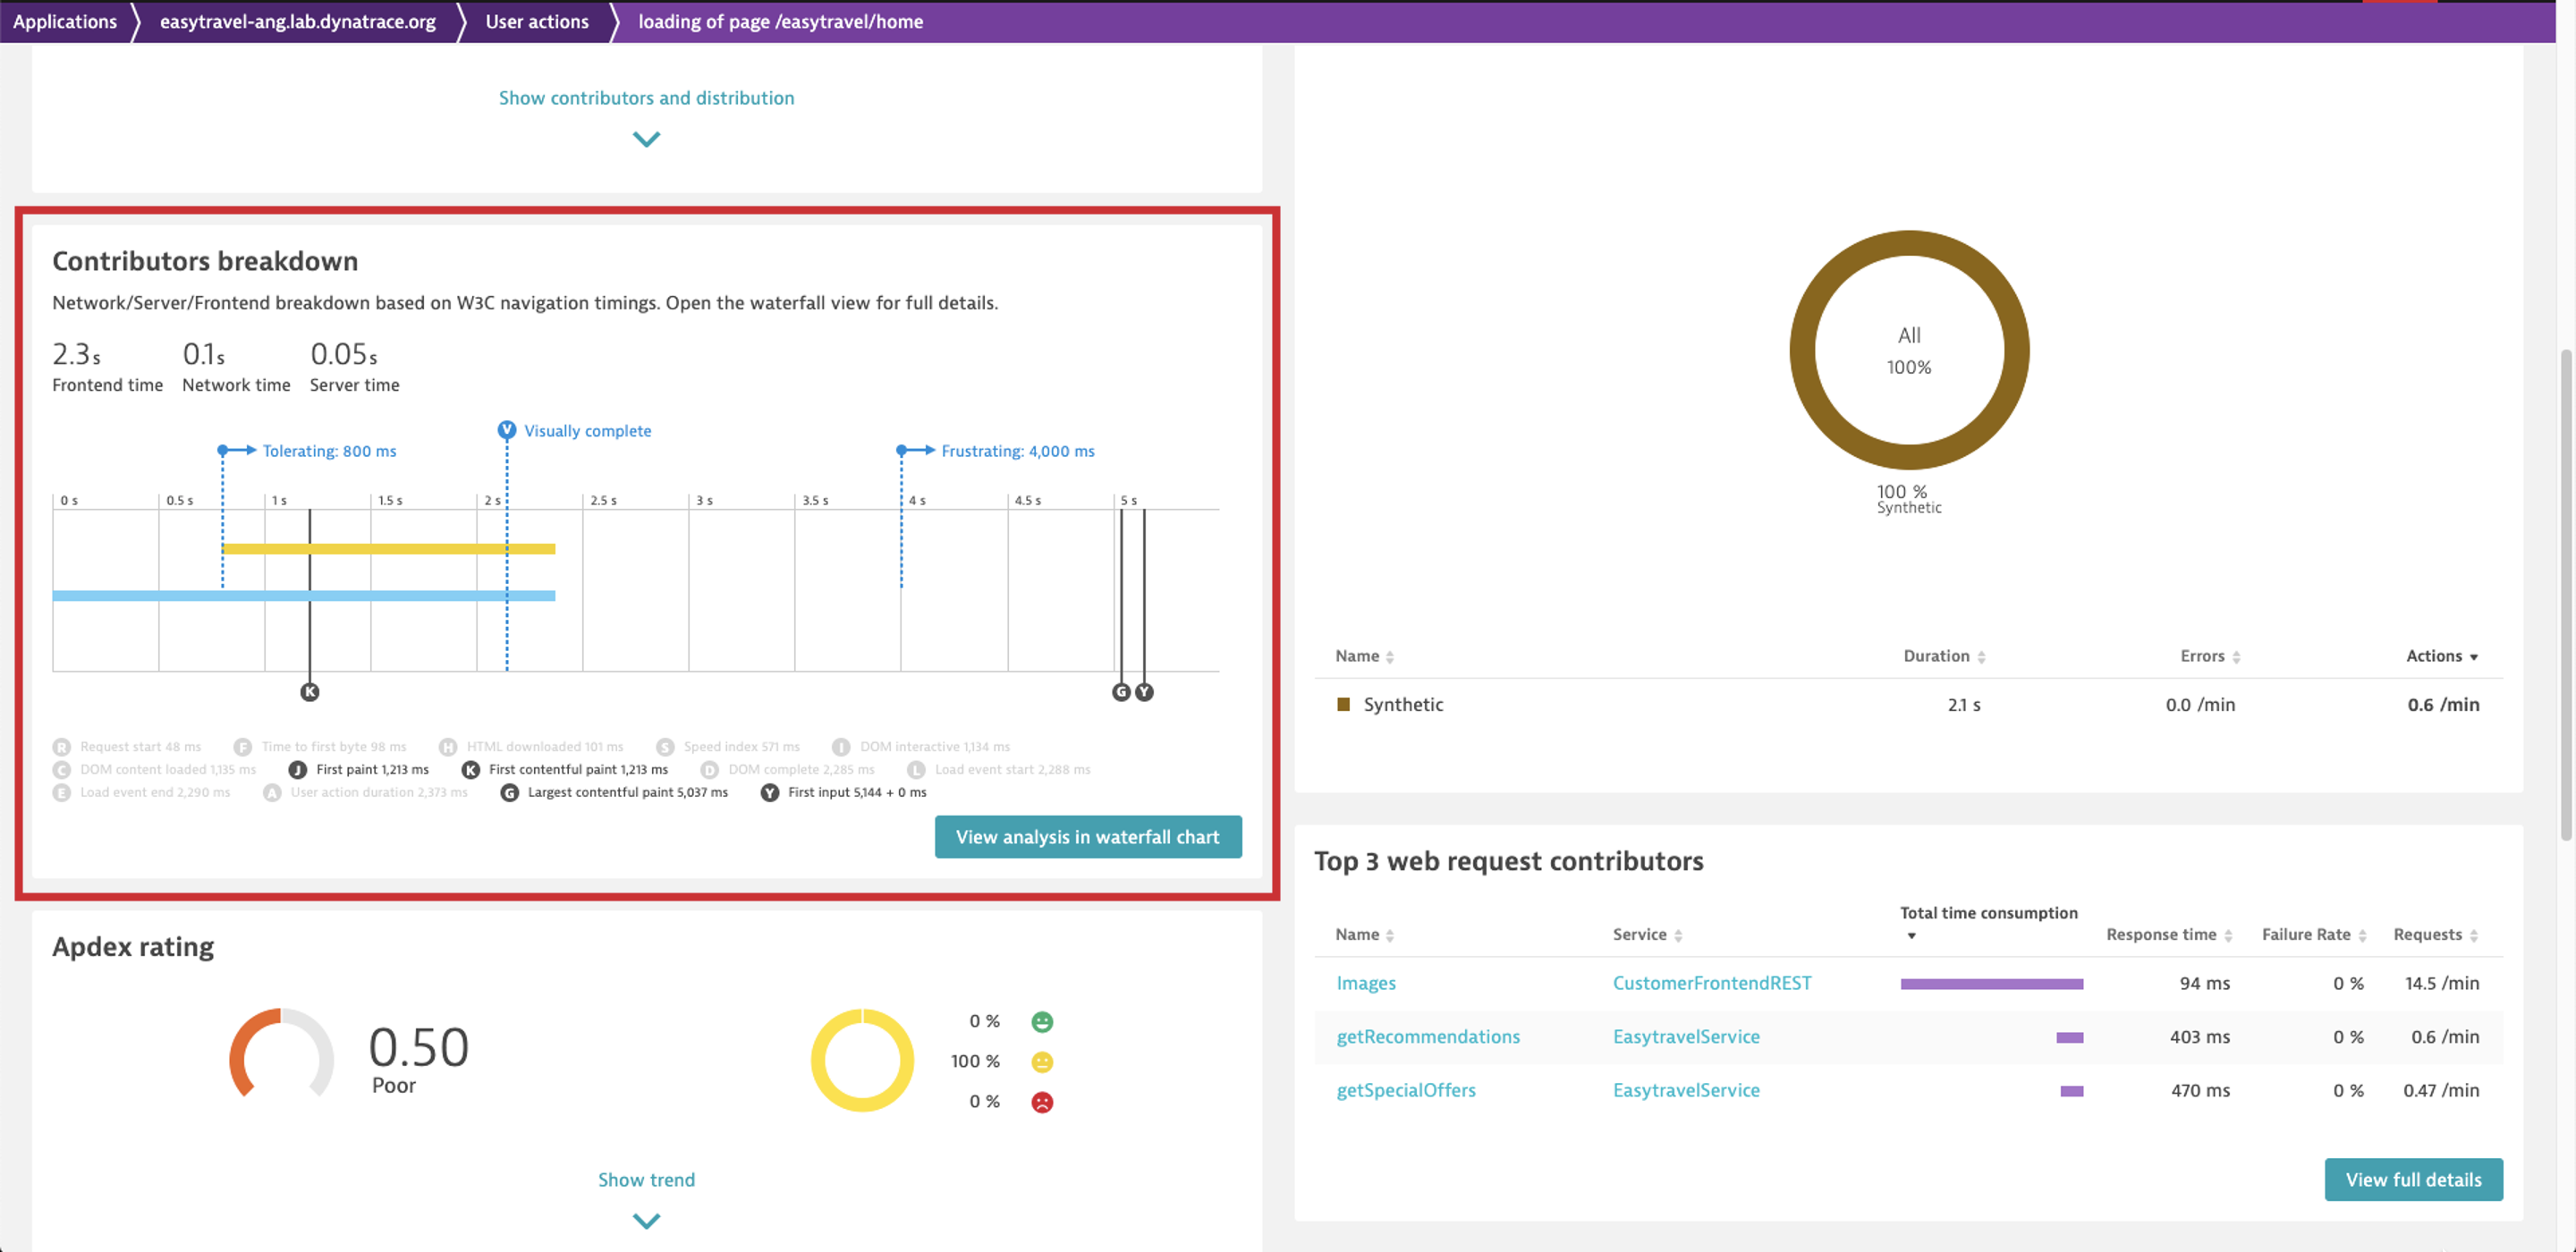
Or you can view the aggregated waterfall for all user action instances on the Contributors breakdown card to note the timings of the new metrics.
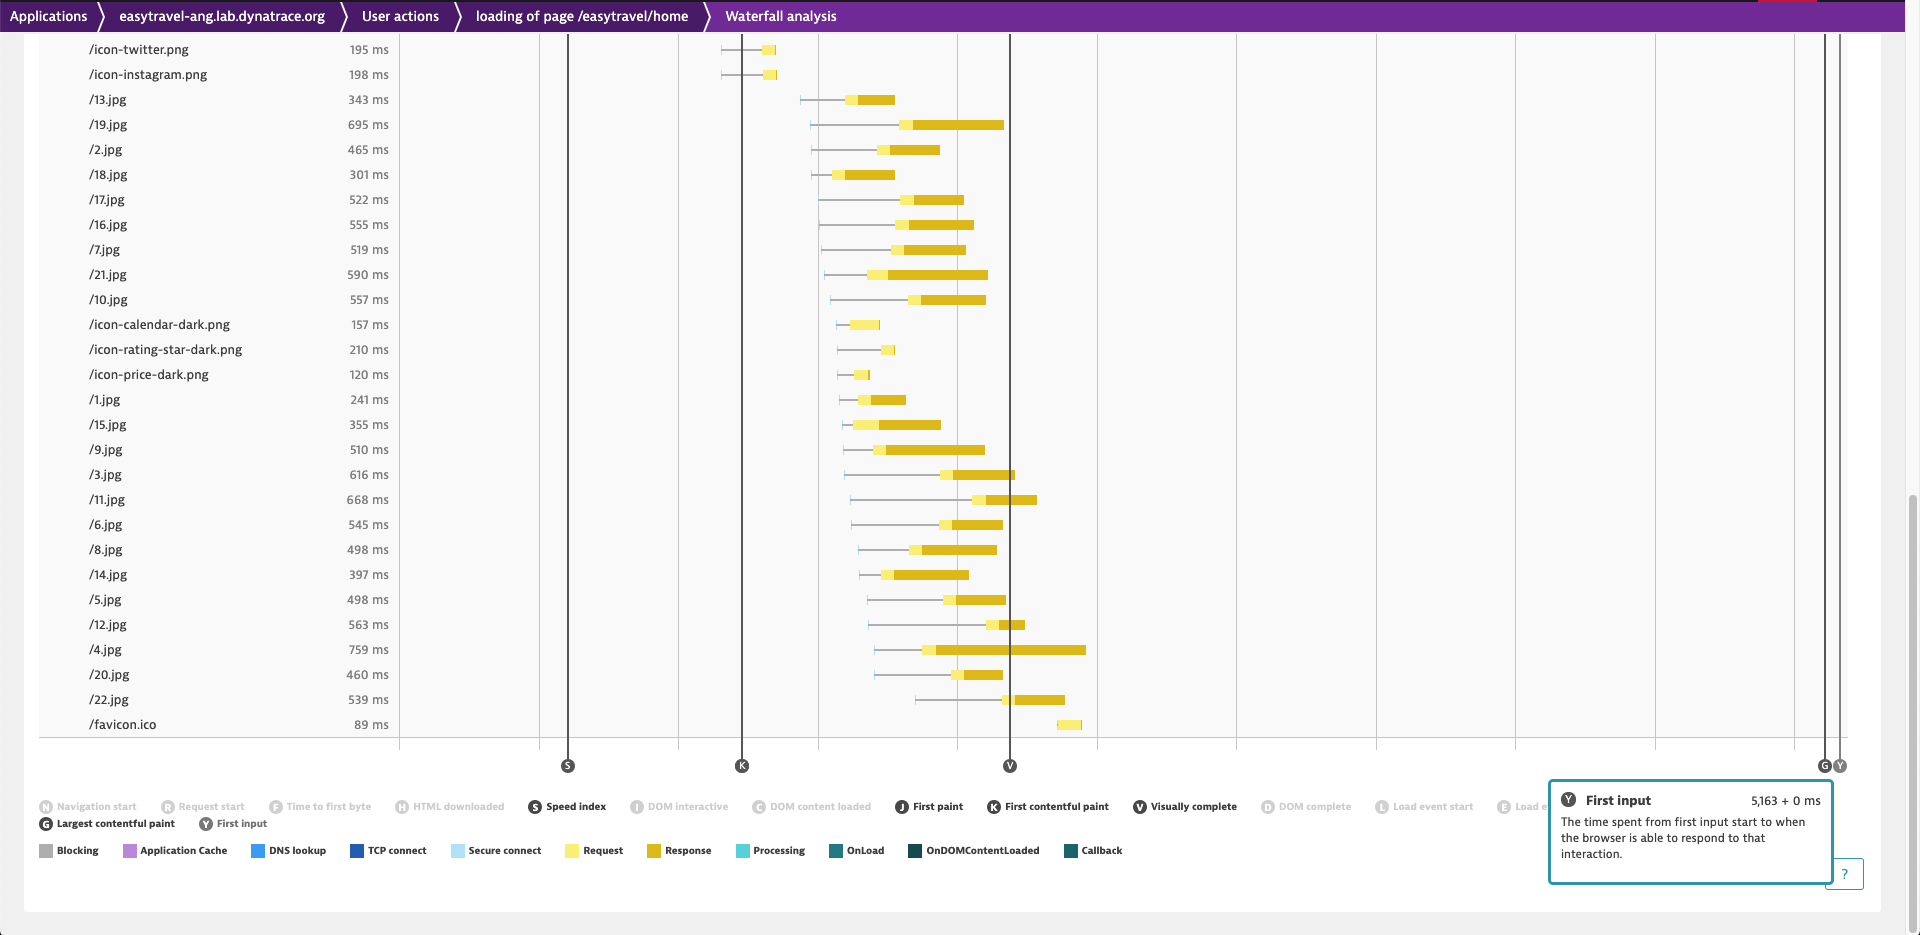
Analyze all details with the new metric markers on aggregated waterfall charts
Finally, you can analyze all the details of the new metrics in a waterfall chart by selecting View analysis in the waterfall chart on the Contributors breakdown card on the action details page.
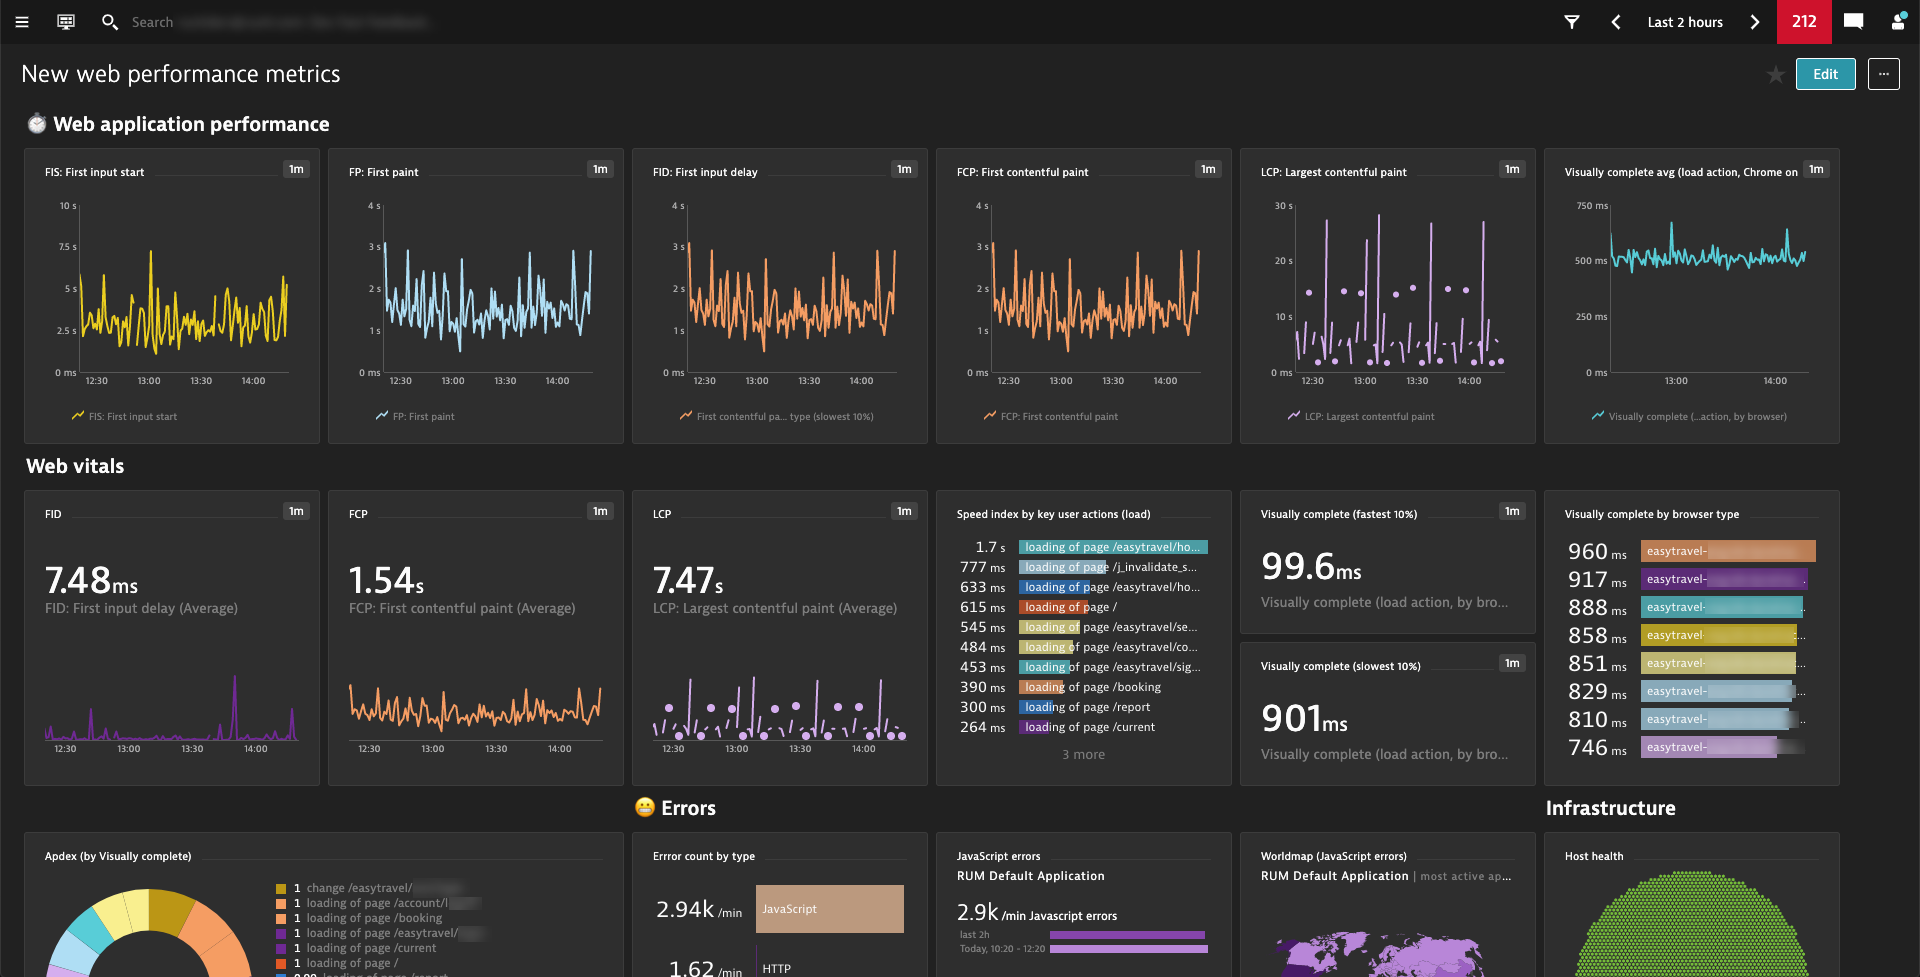
Easily dashboard your favorite new web performance metrics by leveraging calculated metrics
Together with our out-of-the-box metrics such as Visually complete and our calculated metrics for RUM, you can create dashboards for the exact metrics that you’re most interested in. Besides our well-known Visually complete metric, the dashboard below charts two of three Web Vitals (FID: First input delay and LCP: Largest contentful paint), which have recently been promoted by Google as “Essential metrics for a healthy site.”
You can leverage calculated metrics for Real User Monitoring to create such dashboards.
Get more granular control over your Visually complete calculation
Our customers often ask what’s included in the calculation of Visually complete. Some customers wonder why certain images aren’t included or whether it’s possible to exclude other images from the calculation. Other questions revolve around configuring individual aspects of Visually complete, such as the default time-outs used for calculation.
To give you more control over how your Visually complete metric is calculated, we now provide you with the following additional settings:
- Threshold: Use this setting to define the minimum visible area per element (in pixels) for an element to be counted towards Visually complete and Speed index. This means that only elements that have the minimum defined pixel area will be included in the calculations.
Let’s illustrate the threshold setting using the Dynatrace website as an example. When loading the page, Visually complete takes nearly all the visible elements into consideration (“too small to be relevant” elements are excluded from the calculation). While in the past you had to live with our default value, you can now define a threshold that must be exceeded in order for elements to count towards Visually complete calculation. This means that you can now decide what’s considered to be too small to be relevant for your pages’ Visually complete calculation.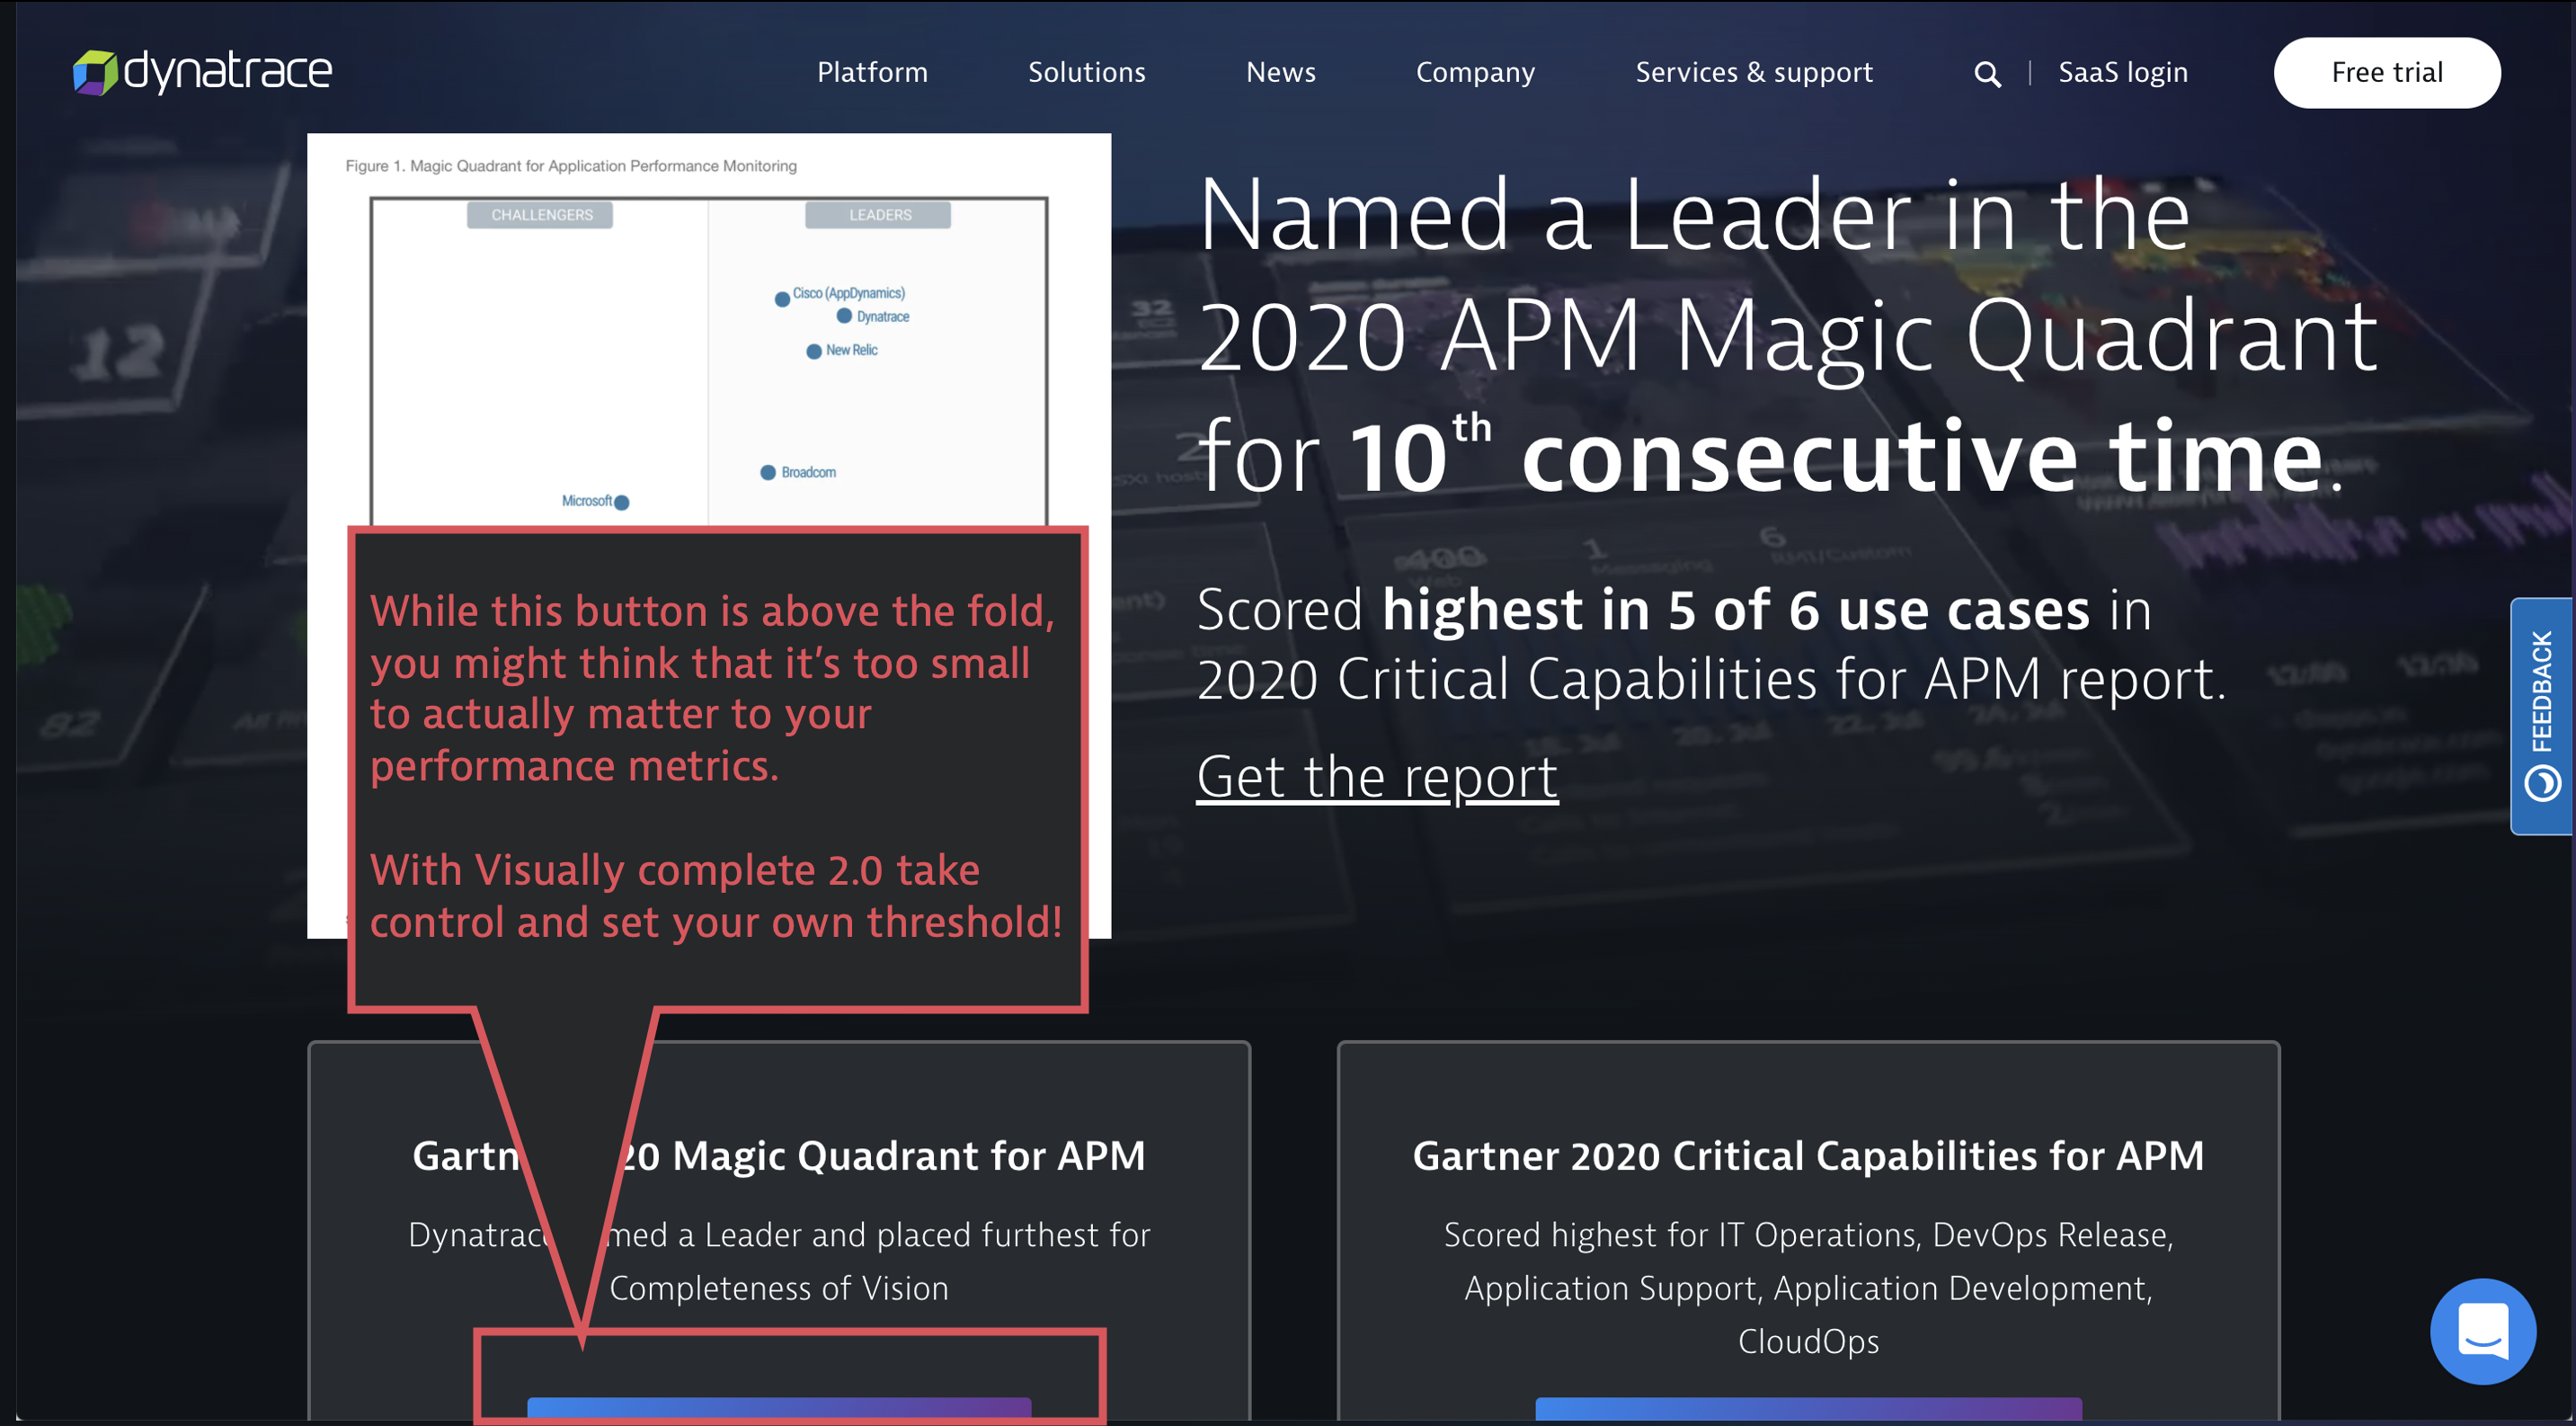
Other newly added settings include:
- Inactivity timeout for load actions: The time the Visually complete module waits for inactivity and no further mutations on the page after the load action
- Mutation timeout for XHR and custom actions: The time the Visually complete module waits after an XHR or custom action closes to start the calculation
- Excluded URLs: Use regular expressions to define URLs for images and iframes to exclude from detection by the Visually complete module.
- Ignored mutations: Query CSS selectors to specify mutation nodes (elements that change) to ignore in Visually complete and Speed index calculation.
To find out how to configure these settings and to read additional details, see How to use Visually complete.
Get started with just a few clicks
Prerequisites
- Dynatrace version 1.194+
- RUM JavaScript tag version 1.191+
How to enable the new web performance metrics and Visually complete
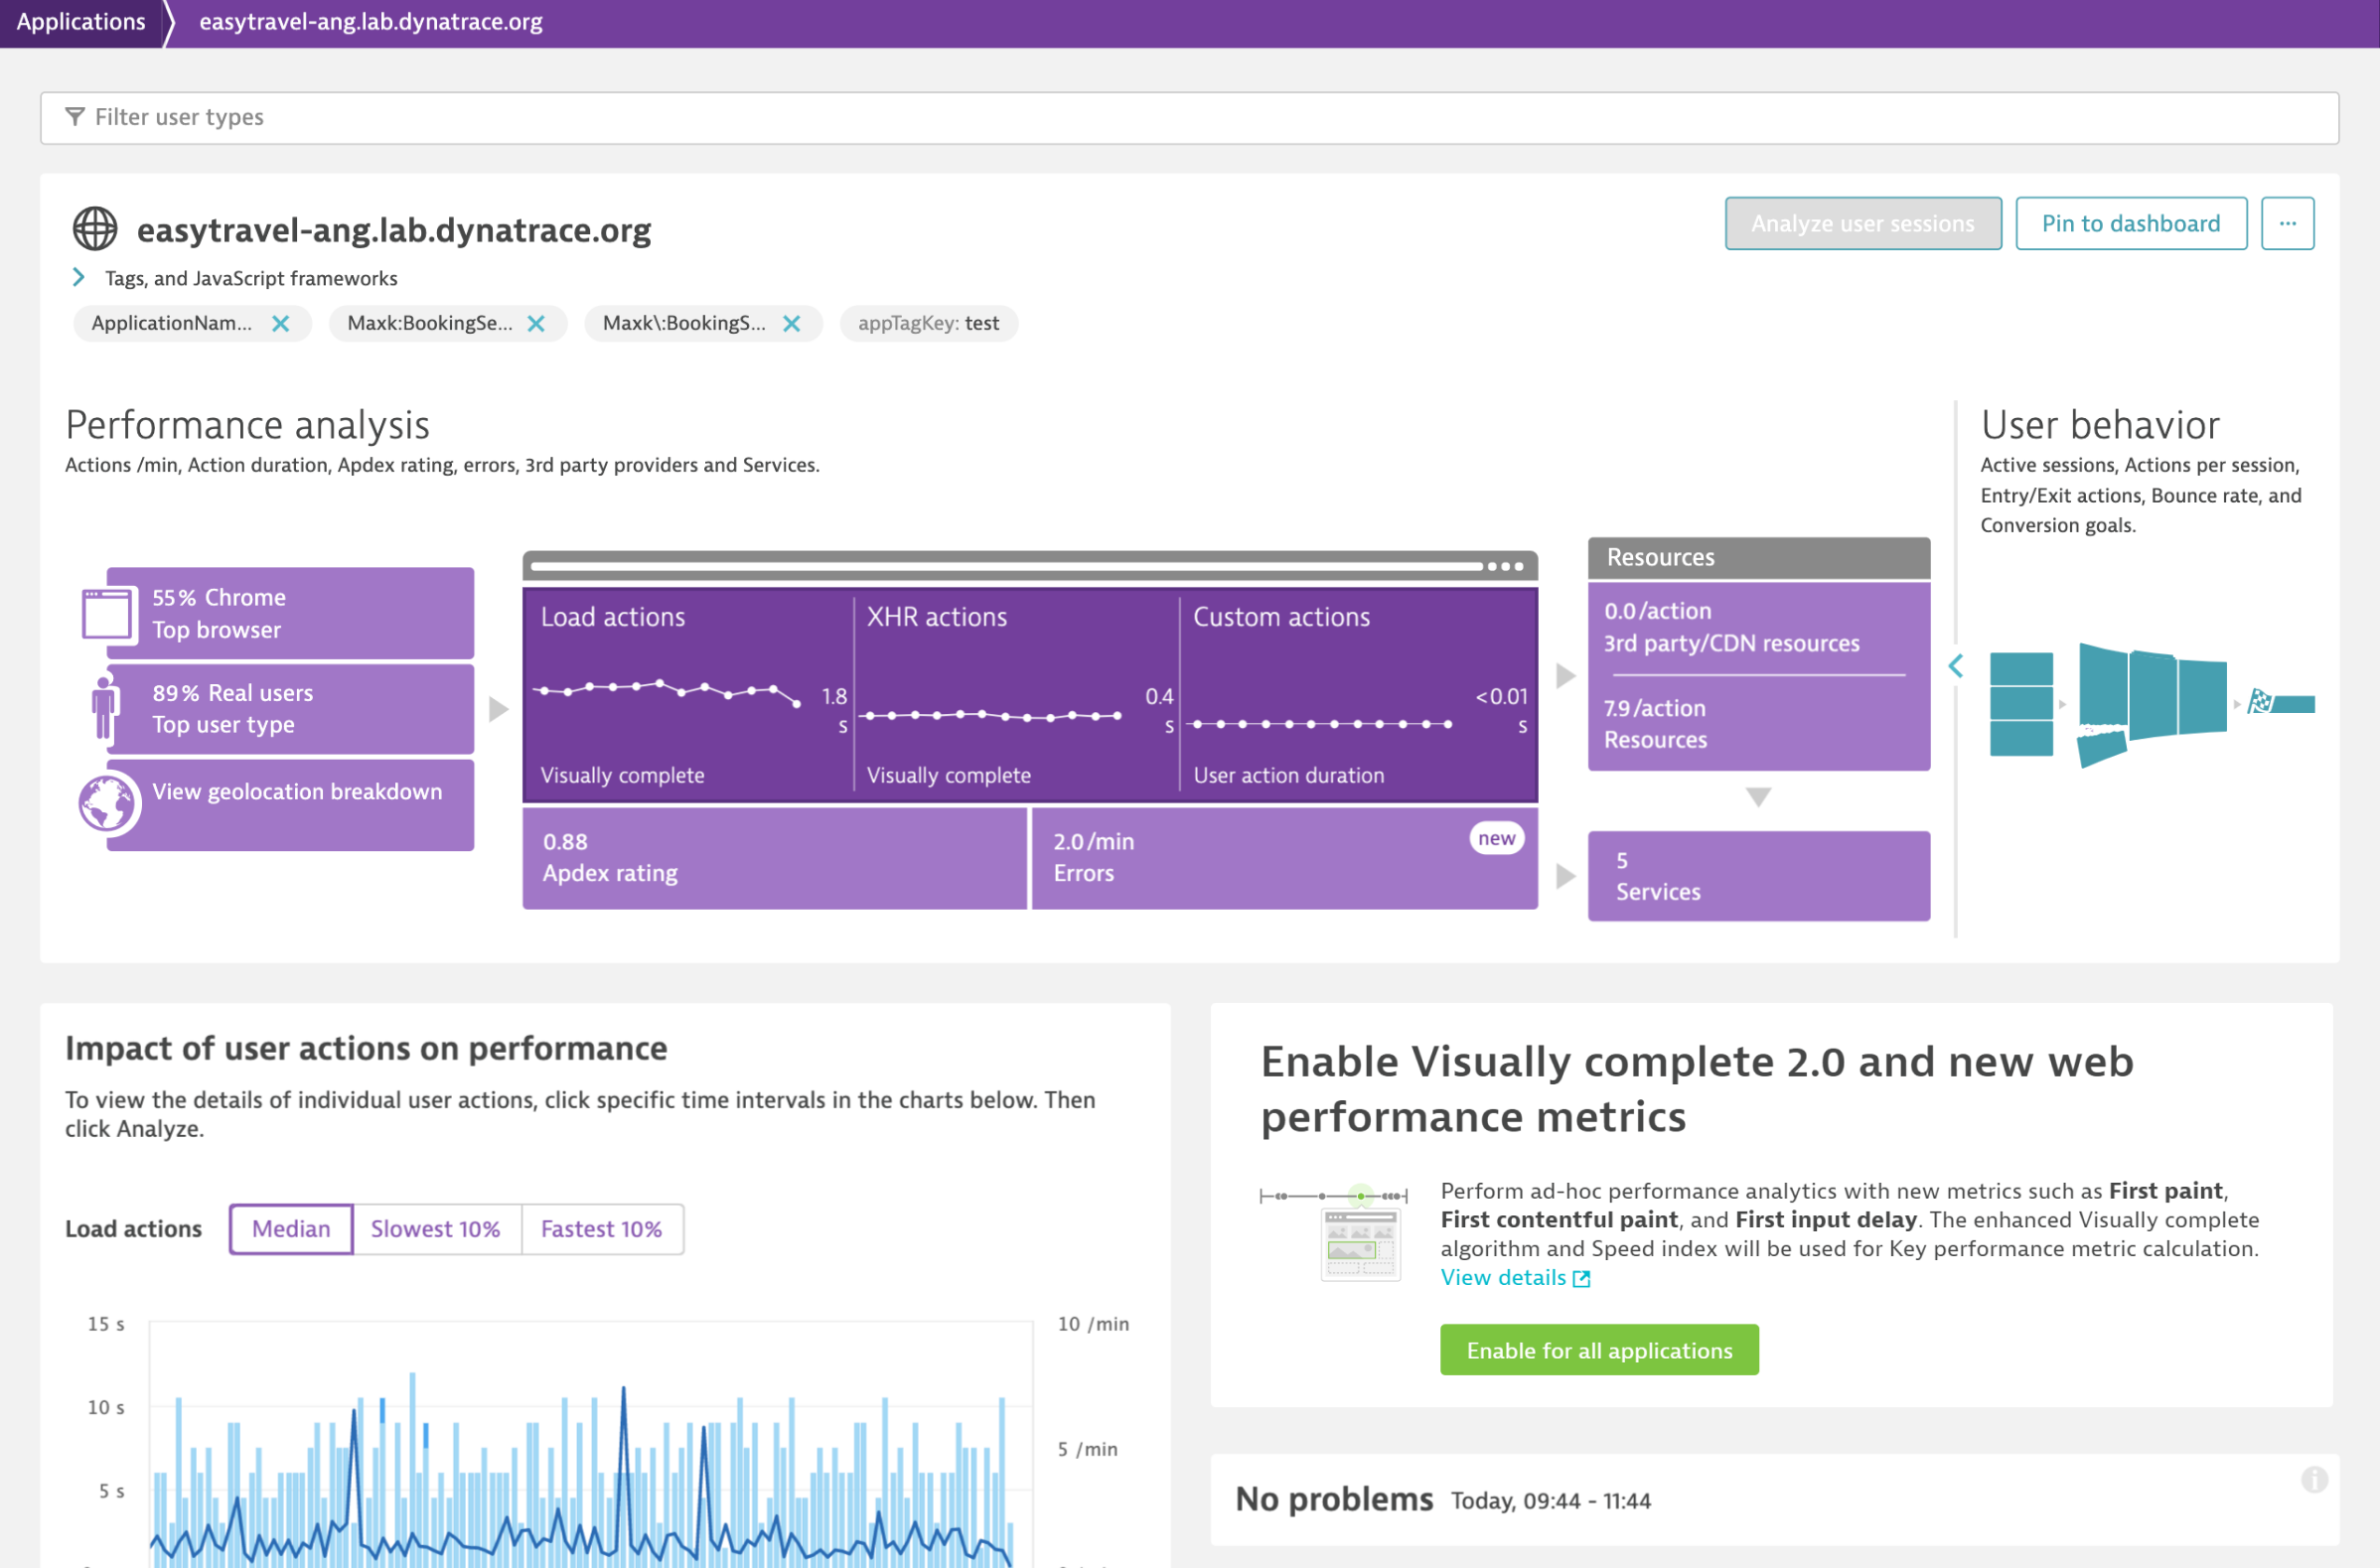
Start using the new web performance metrics and our enhanced Visually complete with Dynatrace version 1.194 by selecting the Enable for all applications button, which is currently available on each application overview page in your environment.
Note that this will turn on the enhanced version of Visually complete and the new web performance metrics for your whole environment, not just a single application.
What’s the impact of enabling these metrics?
Enabling our new enhanced Visually complete metric may lead to the following:
- In your Visually complete graphs, you’ll see a visual marker showing exactly when you enabled the enhanced version. You may also notice spikes in the measured values—read on below.
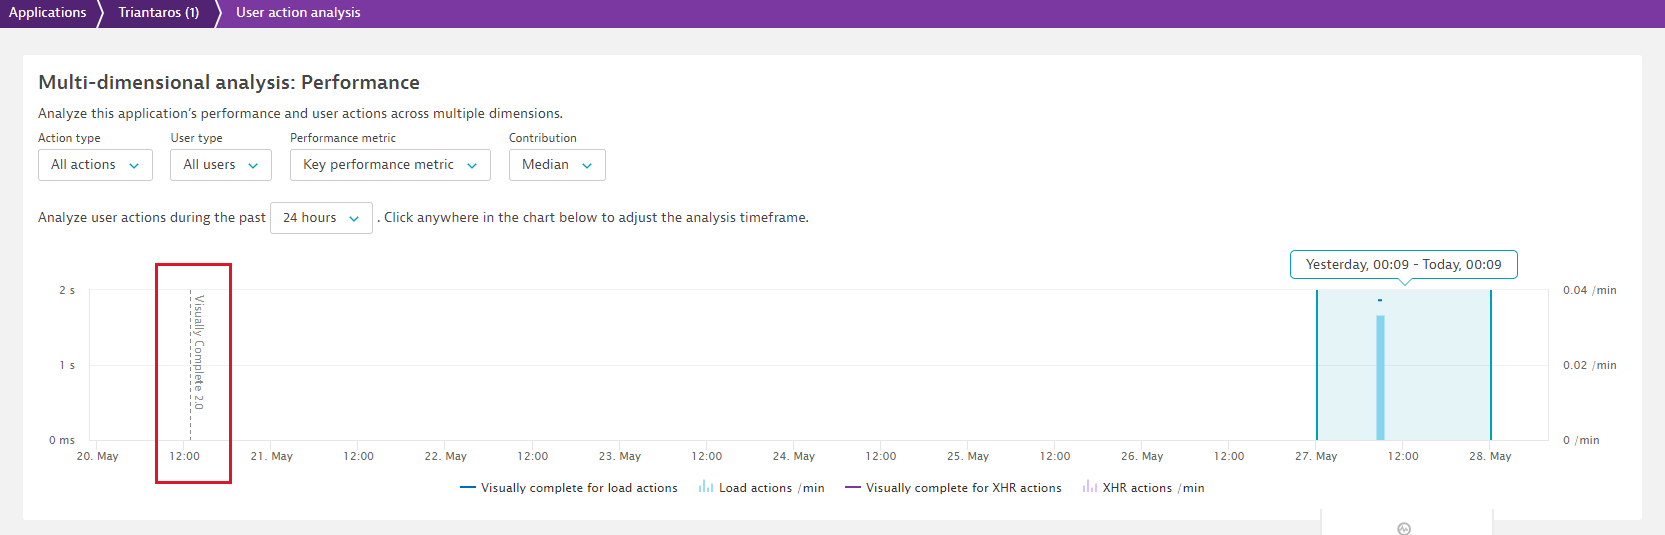
- Spikes in charts and slower Visually complete metric measurements occur because we are now more accurately determining the point in time when your pages become visually complete.
- All your synthetic browser monitors that monitor your RUM applications will then also use our enhanced Visually complete algorithm and, therefore, may also show slower measurements.
- You may also receive performance degradation messages from Davis®, which will go away with time.
By when do I need to switch?
Support for the earlier version of Visually complete will end with JavaScript tag version 1.211 for RUM and Syntethic version 1.212.
What’s next?
We’re already working on integrating the new web performance metrics in our Synthetic Monitoring offering, so stay tuned. And we’ve gathered valuable feedback from early adopters, which has immediately generated new ideas for future iterations such as:
- Providing a UI to configure the new Visually complete settings, instead of adding them as key/value pairs in custom configuration properties.
- Adding all Web Vitals as Key performance metrics in the future, which allows you to use them in your Apdex calculations, in combination with key user actions, and potentially also in USQL.
- Being able to use the new metrics for your Apdex ratings, which also allows you to filter user actions according to your own defined thresholds for these metrics and potentially enables new segmentation, custom charting, and dashboarding use cases.
Besides these early-stage ideas, we continue to look forward to your ideas and input on how we can further improve our support for modern web performance metrics.


Looking for answers?
Start a new discussion or ask for help in our Q&A forum.
Go to forum