
During one of my latest Performance Clinics, I started chatting with a Dynatrace customer at a top US-based insurance company. He wanted to get some information on the Dynatrace UFO, but then the conversation changed towards how they leverage Dynatrace. I told him: If you have stories and best practices you want to tell just let me know and I will convert it into a blog. Well – here we are! 😊
Issue: Crashing websites on Windows Desktops
This customer’s end users in their different office locations use Windows Desktops for their day-to-day work. Some of their users started to complain about crashes when accessing their internal web portals to process their jobs. This web portal also accesses a local home-grown application called PACE, which is installed on every desktop. The company’s help desk has worked on these crash reports but didn’t come up with a solution as they happened sporadically and couldn’t be reproduced!
Solution: Dynatrace OneAgent on Windows Desktops
The customer heard about these crashes and proposed installing Dynatrace OneAgent’s on these windows desktops. In order to better organize the monitored data with the rest of the Dynatrace monitoring landscape, they decided to put these OneAgent’s into a special host group called “End-User-PCs” for all these desktop hosts. Host groups give them the flexibility to filter, build specific dashboards but also set custom maintenance windows and setup specific alerting, e.g: you don’t want an alert in case an employee turns off his desktop at the end of the day.
They also invested in automated host tagging so that every host was automatically tagged with information such as Organizational Department, Vlan, ESXi Datashare …
Here is the first screenshot of the Dynatrace host details for one of their hosts – showing the meta data and tags as well as key performance metrics that get monitored:
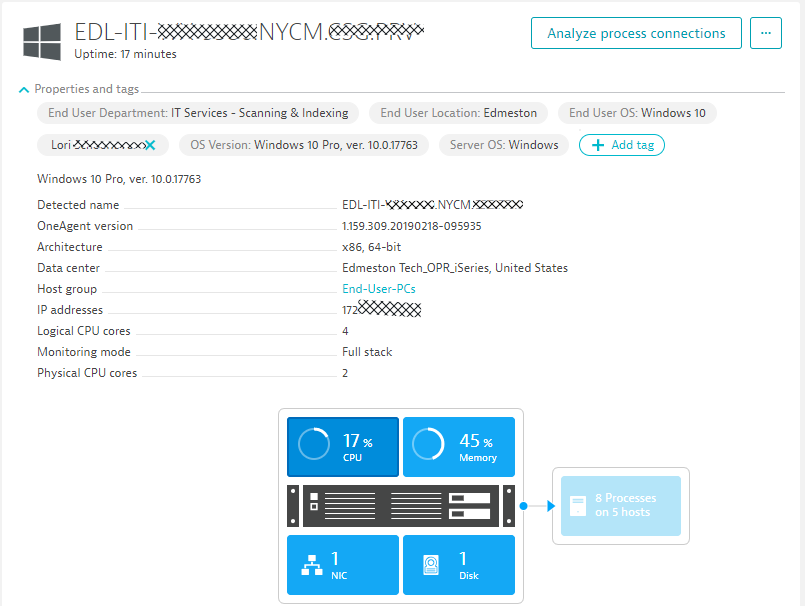
The OneAgent also monitors all processes running on this machine including all network connections, log files and is also keeping an eye on key events on that machine, e.g: deployment changes, process restarts or crashes. The following screenshot shows the second part of the host details dialog:
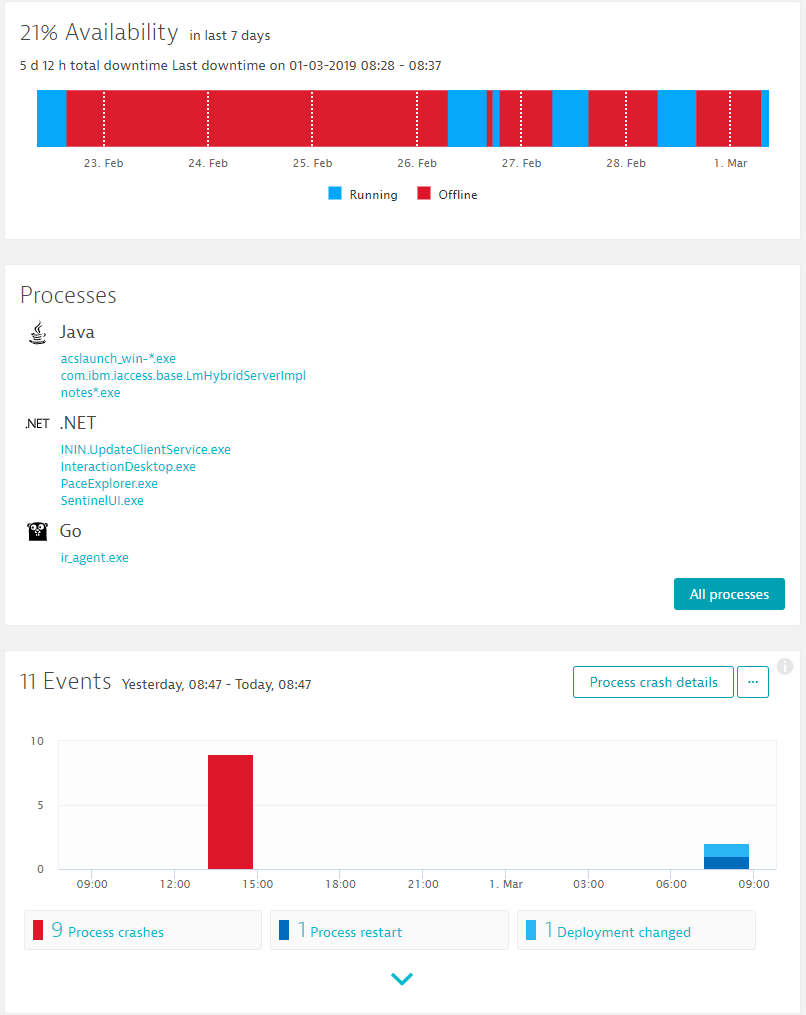
Quick observations: When looking at the data above we can see when this machine was used during business hours and shut down during weekends and nights. We also see a high volume of process crashes which are automatically detected. Let’s dig deeper in this!
Analysis: Crashing custom application leads to user experience problem
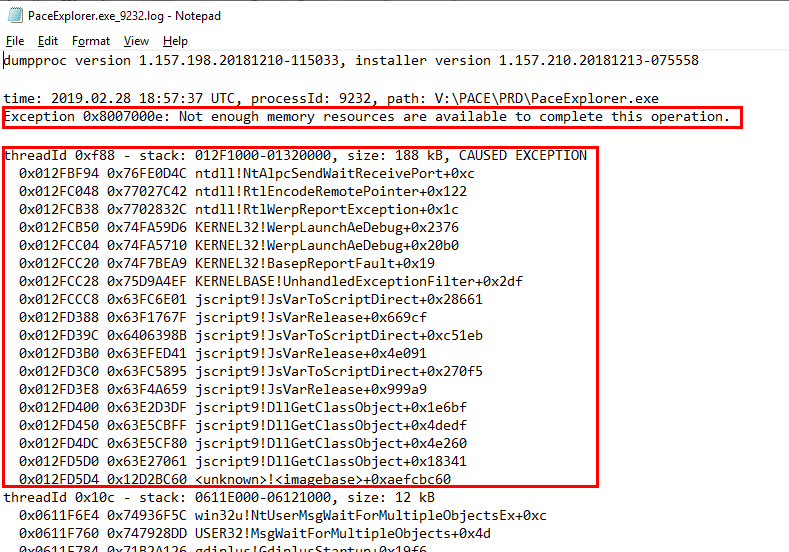
As we said in the beginning – the bad user experience explanation given to the Helpdesk team was never detailed enough to pinpoint the problem to a specific area. With the data that the OneAgent collected and analyzed, the customer and his team could immediately point to the problem (the crashing home-grown application) and the root cause (exhausted process memory).
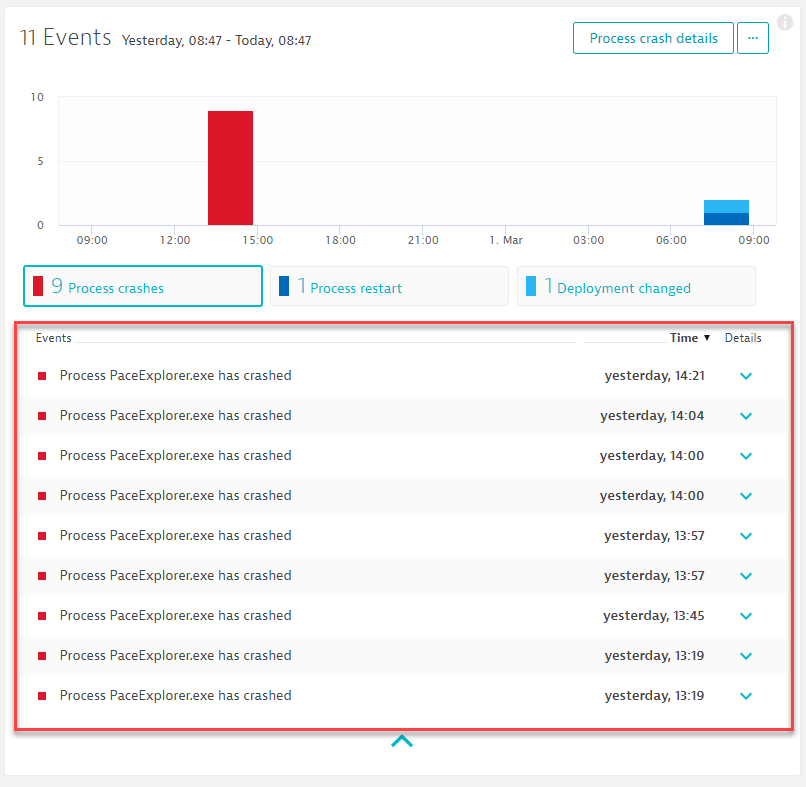
Step 1: Explore the process crashes
Step 2: Explore the crash dump
In the screenshot above we can see the “Process crash details” button which is a convenient feature of Dynatrace as it provides crash details – fully automatic. Here is the first part of the crash dump – including information about the exception that caused the process to crash:
The crash information alone is already great to pass on to developers. Additionally, the customer and his team looked into traffic patterns of the Pace Application at the time of the crash. Dynatrace is also recording this type of data. In their instance, it showed them that the problem was not a result of high or unusual traffic or transactions.
Step 3: Pass the information to development
Here is the information they could pass on to the application development team to address the problem
- Actual user who experienced the issue: user is captured as Dynatrace Tag
- The traffic behavior of the app when it crashed: basic metrics OneAgent captures for every process
- Full Crash dump of all crashes that occurred
Conclusion: OneAgent’s to support IT helpdesks
In most of our use cases and stories, we write about monitoring microservice applications in hybrid-cloud environments and how Dynatrace Davis® – the deterministic AI – detects problems and root cause in these very complex environments. Thanks to the customer – who was willing to share his story – we get to learn about these other use cases that are very critical to any enterprise organization.
If you want to give this a try yourself simply sign up for the Dynatrace Trial (either SaaS or On-Premises), install the OneAgents on your workstations, and dig into the data it provides in case your end users experience any problems. Remember leveraging metadata, tags & host groups to better organize your monitoring data as well as to streamline your alerting!
If you happen to have your own stories just drop me a note – happy to share it!


Looking for answers?
Start a new discussion or ask for help in our Q&A forum.
Go to forum