
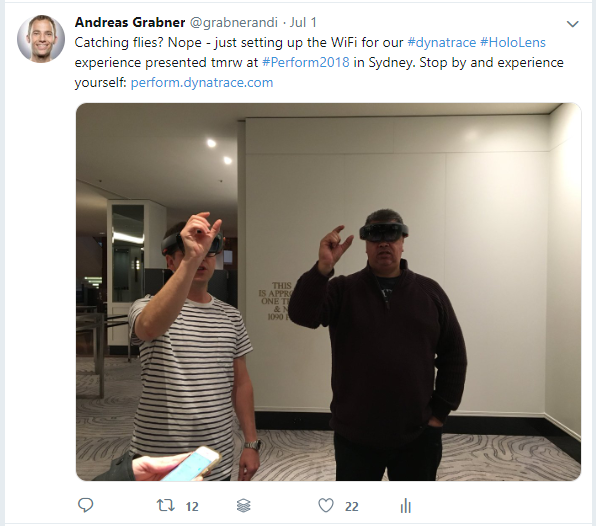
Since we lifted the curtain of our Dynatrace HoloLens experience in January at our PERFORM Global User Conference, the HoloLens made its tour around the world, being demoed at different local Dynatrace PERFORM events as well as at partner or industry conferences.
While the HoloLens shows how we at Dynatrace envision the future of collaboration, it also shows our development team that this technology is still missing some key capabilities, e.g: proper monitoring and error analytics. The team required more analytics on things such as:
- Who is using the HoloLens App and in which particular way?
- What’s the perceived performance?
- Are there any issues with the Dynatrace HoloLens app that need to be addressed?
I remember supporting our Dynatrace PERFORM APAC series this summer and our team in Austria had to remote into the local demo stations in the early morning hours for some troubleshooting, as the demo didn’t work as expected. We experienced some crashes and issues when connecting the HoloLens to the backend Dynatrace Tenant from where it pulled the data through our Dynatrace API to generate the amazing visualizations.
Troubleshooting these problems used to be painful. Our dev team had a couple of frustrating moments prior to bringing our HoloLens on tour. They couldn’t get answers to some of the basic questions when developing and operating software due to the limited monitoring capabilities of the HoloLens:
- “Why did the app crash? I can’t reproduce it!”
- “Why does registration not work from Sydney when it works for me in our lab?”
- “How did the user make it to this point? I don’t understand their navigation patterns!”
- “Debugging in VS is so painful – isn’t there a better solution?”
Stefan Wasserbauer and Philipp Raab fortunately found a great solution to answer all these questions before sending the HoloLens on its world tour. They started to instrument the Dynatrace HoloLens app with Dynatrace OpenKit, which gives them all the data they need to answer these questions. Stefan and Philipp shared a couple of more insights and screenshots for me to use for this blog. This shows that Dynatrace is not only a useful instrument for your Linux, Windows, PaaS, Kubernetes, OpenShift or CloudFoundry environments, the OpenKit is a great way to instrument devices such as the HoloLens with a couple of small code modifications. Let’s dive into the details!
Choosing OpenKit vs OneAgent
Why did they choose OpenKit vs OneAgent? Because (for several technical reasons) installing a full Dynatrace OneAgent on the HoloLens isn’t an option. After consulting with Christoph Neumüller, our .NET Agent Technology Lead Philipp started to research on the possibility to leverage the Dynatrace OpenKit. It overcame some of the limitations but opened up two additionally challenges. In cross-team collaboration between Philipp and the OpenKit team they solved the following two items to make the OpenKit work for the HoloLens:
- In order to support UWP, the OpenKit team extended the capabilities to leverage Threading.Tasks instead of System.Thread
- In order to make OpenKit work with Unity they had to add the file rsp with the content -r:System.Net.Http.dll – then recompile OpenKit.dll for UWP.
For those of you familiar with the internals of UWP and Unity feel free to leave a comment to learn more about how Philipp ended up with this solution which worked like a charm!
Explaining the Dynatrace HoloLens Architecture
Before we dig into how they use the Dynatrace OpenKit collected data, lets first have a quick glance at the Dynatrace HoloLens architecture. After they explained to me how the architecture looks like I drew the following diagram that shows the involved components and the communication flow:
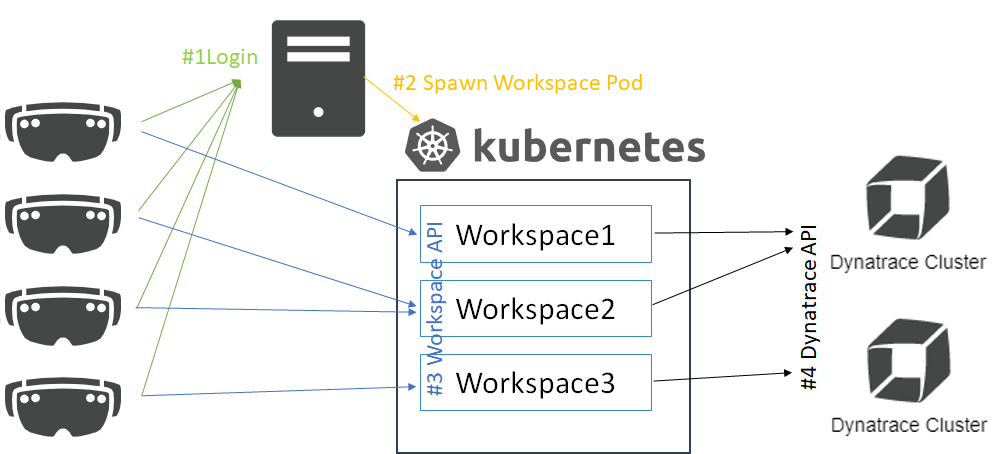
The HoloLens App connects to a web portal application that manages users and the so called “Workspace Servers”. Every time a user logs in, a new Workspace Server is launched in a Kubernetes Pod. This Workspace Server is pulling metrics from the Dynatrace Tenants via the public Dynatrace API and provides data to the HoloLens for visualization.
The critical components of this architecture are login and spawning the Kubernetes pods. If these take too long, the HoloLens will run into timeout issues which impacts user experience!
Knowing more about the architecture, lets start to dig into the use cases!
Use Cases for the Instrumented HoloLens App
Instrumenting an application with OpenKit is straight forward. If you want to learn more check out the OpenKit documentation. Philipp instrumented key user actions in their HoloLens app such as Login, Registration, Pull Data, Post Request, …
Now let’s see how they use the Dynatrace captured data and analytics screens to answer the pressing questions:
#1: Analyzing Connection Issues
Last week our colleagues in Brazil brought the HoloLens to their local PERFORM Sao Paulo. They reported issues when connecting the HoloLens to the Dynatrace Demo Tenant.
To analyze that problem, we simply opened the User Sessions for the HoloX application – which is the Dynatrace application Stefan & Philipp configured that aggregates all captured data. They also configured to capture the username when a user signs into the HoloLens app. This makes it very easy to pick an individual user that complains:
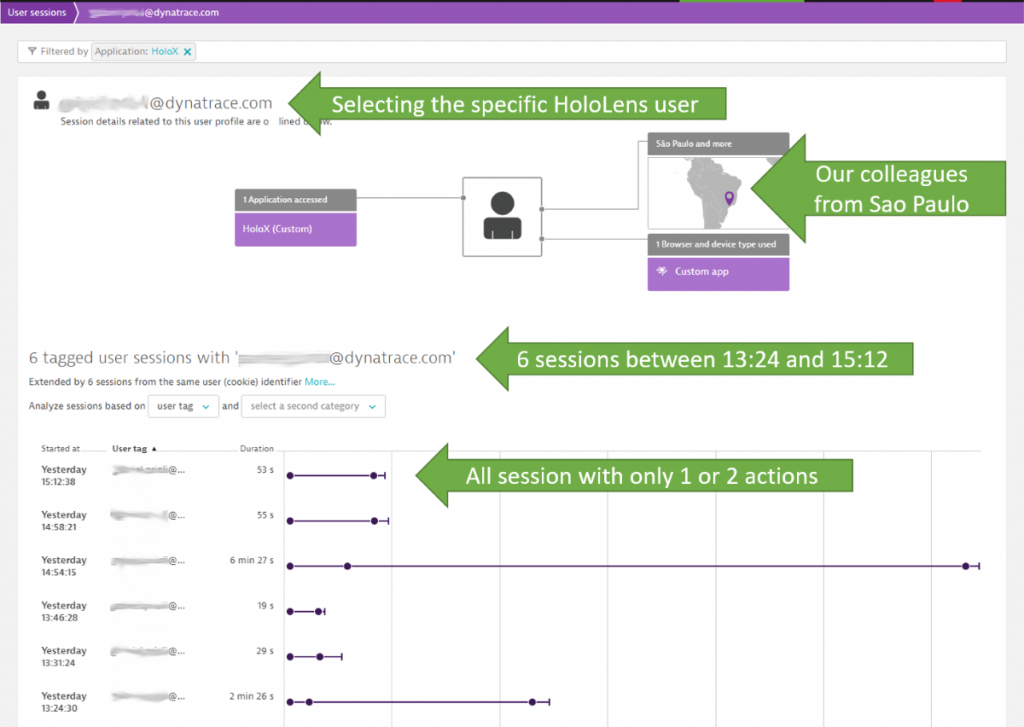
The list of sessions already shows that most sessions only have two actions, some three. But it seems none of these users actually interacted with the HoloLens in the way it was intended, e.g: creating dashboards in mid-air and interacting with a floating SmartScape view!
A closer look at one of these sessions reveals that our colleagues indeed has issues when connecting the HoloLens to the web portal. The Cloud Connect action was really slow:
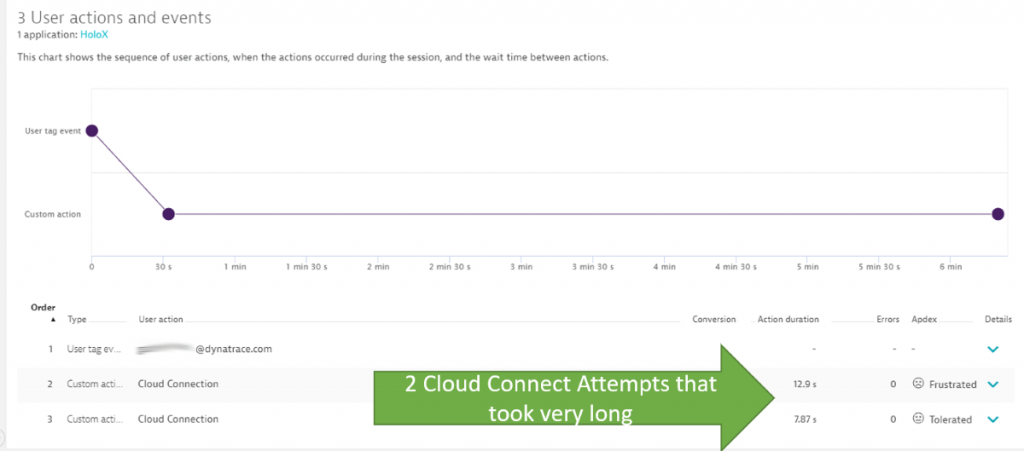
A click on the Cloud Connection action that took 12.9s shows additional timing information as well as context data that was captured by Stefan and Philipp, e.g: TenantId, Host and Port information, …:
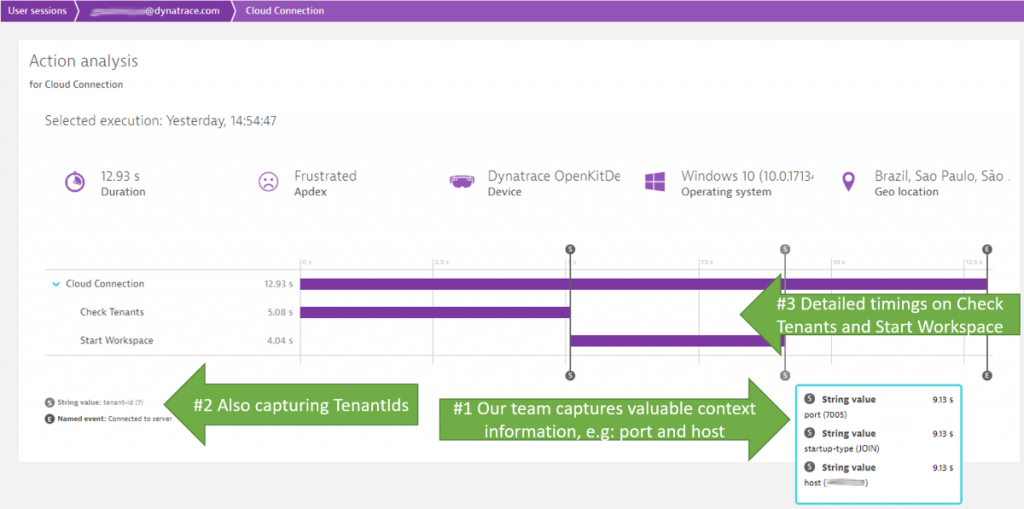
This level of detail and context information for every single user that uses the HoloLens app is exactly what the developers were asking for.
What was the problem? Turned out that the problem was related to the fact that the end user was in Sao Paulo, Brazil, while our Web Portal that the HoloLens connected to was deployed in a data center located in Amsterdam, Netherlands. A classical problem that can be solved by deploying Workspace Servers in data centers closer to the actual end user.
#2: Analyzing Individual User Navigation
When developing any type of application, you want to know how the application is actually used by your end users. The same holds true for the Dynatrace HoloLens app.
As Dynatrace captures every single user and every single interaction the development team can pick individual users and learn from their navigation behavior by simply opening up the User’s Session details:
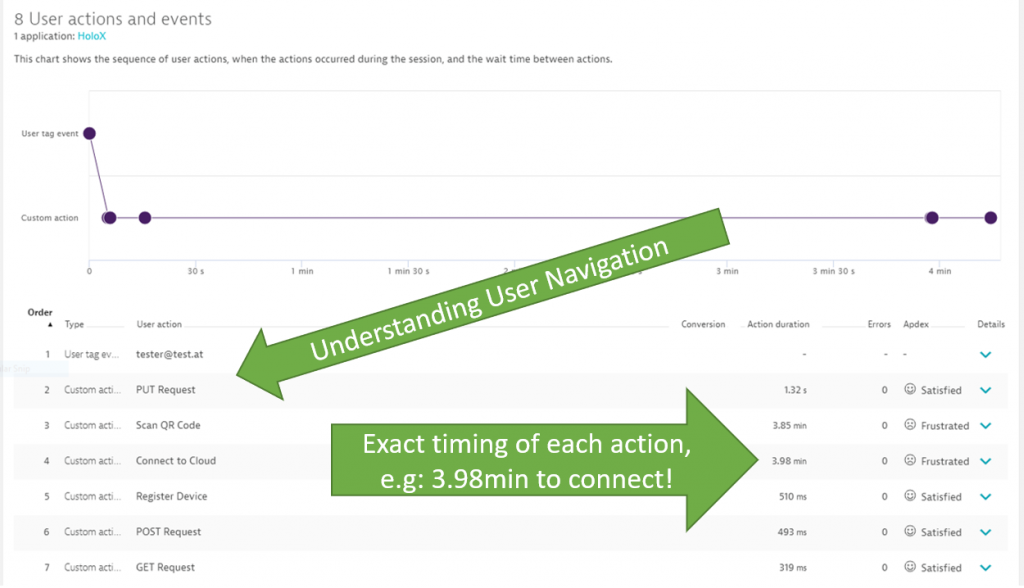
This is great way to learn user behavior, popular features or features that are not working that well and users have to retry certain steps. You also see where users get frustrated. Like the “Connect to Cloud” which tool 3.98min in the screenshot above!
If the team wants to learn more about what happens within one of these user interactions simply open the waterfall view of the User Action. This reveals detail timings as well as any error or exception information:
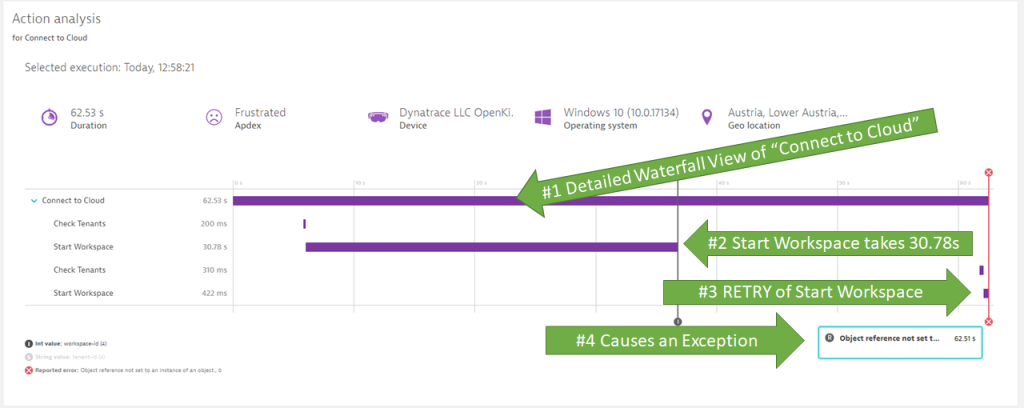
In the last screenshot we see that the “Start Workspace” REST API call Web Portal takes more than 30s. After 30 seconds, the HoloLens app triggers a timeout and the app simply retries. In the second attempt the “Start Workspace” actually results in an Exception fairly quickly. To dig deeper into the exception, we simply open the Exception details. For more details on this, see Use Case #4 where I go into more details on Crash and Error Analytics!
#3: Analyzing Application Performance & Behavior
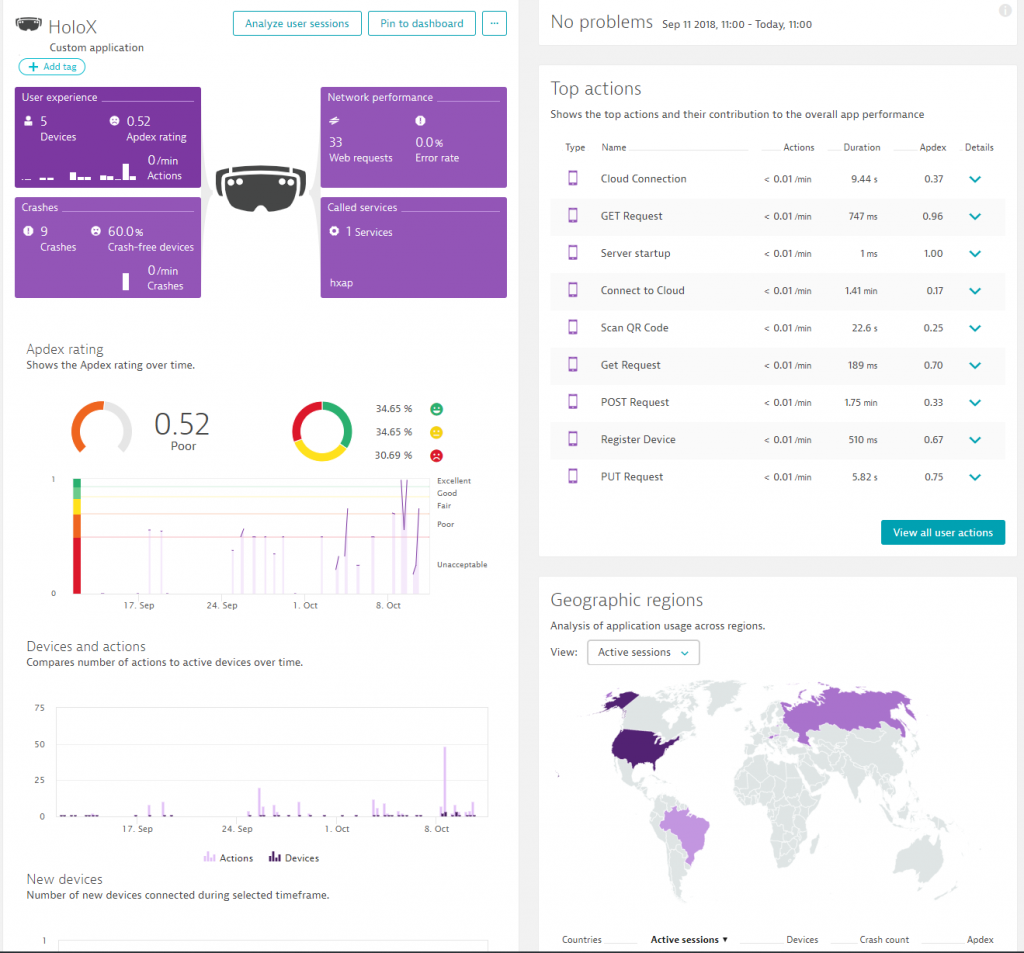
Until now we focused on individual user sessions or user actions to analyze behavior or performance problems from our individual users. Dynatrace also provides the Application Overview for each Mobile, Web and in this case “Custom application” – giving us analytics dashboards to answer questions such as
- Where are our users from?
- What are the top actions and which ones take long?
- How many crashes do we have?
- What’s the performance to the backend system?
The Dynatrace RUM data provides a wealth of information to answer all the questions listed above. If you want to learn more about Dynatrace RUM check out my Performance Clinic on Unlocking the power of Dynatrace RUM on YouTube.
#4: Crash Analytics
In the previous screen, you have probably noticed the infographic that said 9 crashes and 60% crash-free devices. When an app crashes, Dynatrace captures the crash details to better analyze which crashes occurred, on which devices these crashes occur and how many users are actually impacted by them. Check out this screenshot:
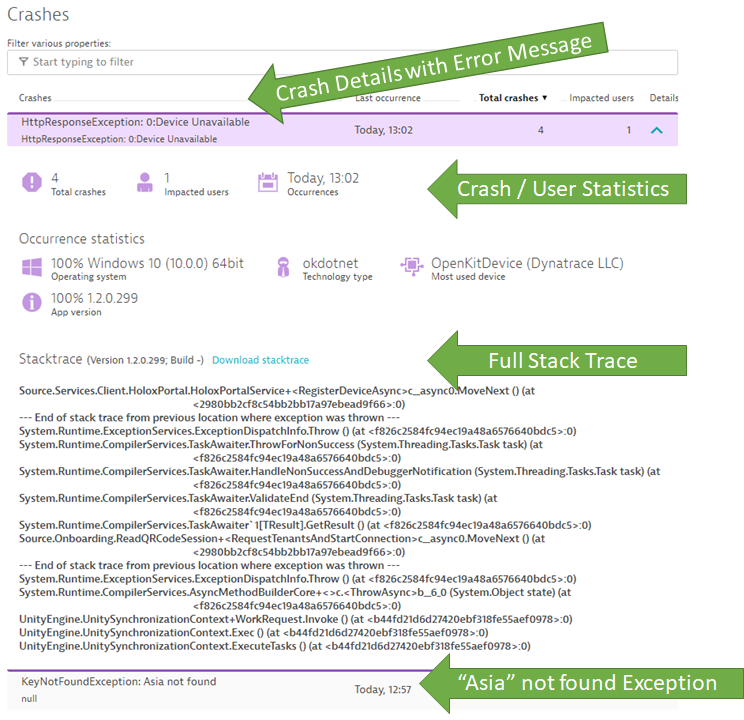
Exception details like this make it very easy to figure out what happened within each individual HoloLens user session.
The error “Asia not found,” was the one that haunted us in our APAC tour, I mentioned in the beginning.
Turned out it was the first time we did a HoloLens demo in that region. Our users obviously selected Asia as their default region. Unfortunately, nobody seemed to have tested the HoloLens with that regional setting before we went on tour. Fortunately, the instrumented HoloLens app provided all this rich diagnostics data which made it easy for Stefan & Philipp to provide a solution to the problem and therefore save the demo station. We simply selected a region that was tested. 😊
Conclusion
Thanks Stefan and Philipp for sharing the way you use “Dynatrace on Dynatrace”. Special thanks to the effort of Philipp who triggered the extension to the Dynatrace OpenKit. Now it is a solution that overcomes the limited support for monitoring and crash analytics that comes out-of-the-box with Microsoft’s HoloLens. It perfectly proves that Dynatrace as a platform is not only great for your enterprise or cloud native apps, but also for your IoT or Augmented Reality applications.
If you would like to learn more about our Dynatrace HoloLens project let us know. Simply leave us a comment on the blog, send us a tweet or connect on LinkedIn (yeah – email is also ok 😊).
If you have your own “non-standard” application that you want to instrument take a look at Dynatrace, the OneAgent, OpenKit and our extension options through our APIs and Plugins! All it takes is to register for the Dynatrace SaaS Trial.

Looking for answers?
Start a new discussion or ask for help in our Q&A forum.
Go to forum