
When Klaus Enzenhofer published his recent article about the value of using Dynatrace real user monitoring to troubleshoot JavaScript errors in web applications, he asked me how we here on the Dynatrace web development team handle our own performance challenges and errors related to the web entities at Dynatrace.com. Klaus wondered if the powerful monitoring abilities of Dynatrace could be used to monitor, find, and solve problems within “mere websites” like ours. My response was a resounding “yes!”
So, in the tradition of “eating our own dog food” (and shamelessly plugging Andy Grabner’s “Dynatrace on Dynatrace” article series), let me show you how we use Dynatrace to monitor dynatrace.com and related web entities.
Not your average website
It should be no surprise for you to learn that performance is a top priority for us here at Dynatrace. So is data security. To ensure that we achieve both of these ideals at high levels, most of our websites are what we call “static sites with dynamic extensions” (for details, see my article in Smashing Magazine on this topic). Instead of generating content dynamically for each individual request, our system proactively pushes pre-rendered markup to a read-only content disk. This cuts down backend rendering time to the blink of an eye—the Nginx network only has to deliver HTML pages that are on disk. A properly configured Nginx cache shoots the pages directly from super-fast memory, which reduces access to the hard disk itself. All deployed HTML pages are roughly 50 megabytes in size (including all related assets). Meanwhile, each of our Nginx servers has multiple gigabytes of memory. You don’t need a math degree to see for yourself that our servers are intentionally under-utilized in this respect.
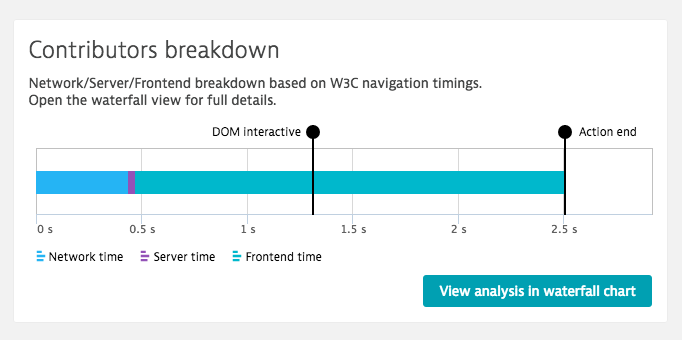
By analyzing the loading action of each URL using the Dynatrace response time contributors’ breakdown (see below), you can see that server time has been reduced to the absolute minimum (less than 0.1 secs).
So, everything that is completely within our control has been optimized to the fullest. Things get a bit more interesting (and fun!) however once we investigate what happens outside in the great unknown, within our user’s web browsers.
Browserland: The great unknown
I think Forrest Gump once said, “Each user’s environment is like a box of chocolates. You never know what you’ll get.” How right he was. During my entire career as a web developer (spanning nearly 20 years), I’ve always taken one thing for granted: No matter how many browsers you test your site against, there’s always at least one exotic bird out there that you never considered.
The new Dynatrace visually complete and speed index metrics for real user monitoring—an industry first—are a tremendous help in this regard. These metrics provide laser focus into what’s going on within each of your user’s browsers. The visually complete and speed index metrics measure the visual progress of content as it renders on each user’s screen. The results are simple and easy to understand. If you’re interested, you can watch me explain the Speed Index metric at Topconf Tallinn.
Waterfall analysis view includes a timeline that shows aggregated load times of all downloaded resources that are associated with a given user action during a specific time frame. Key loading milestones are indicated with callouts on the timeline (for example, Visually complete [V], Speed index (S), and User interaction possible [C]).
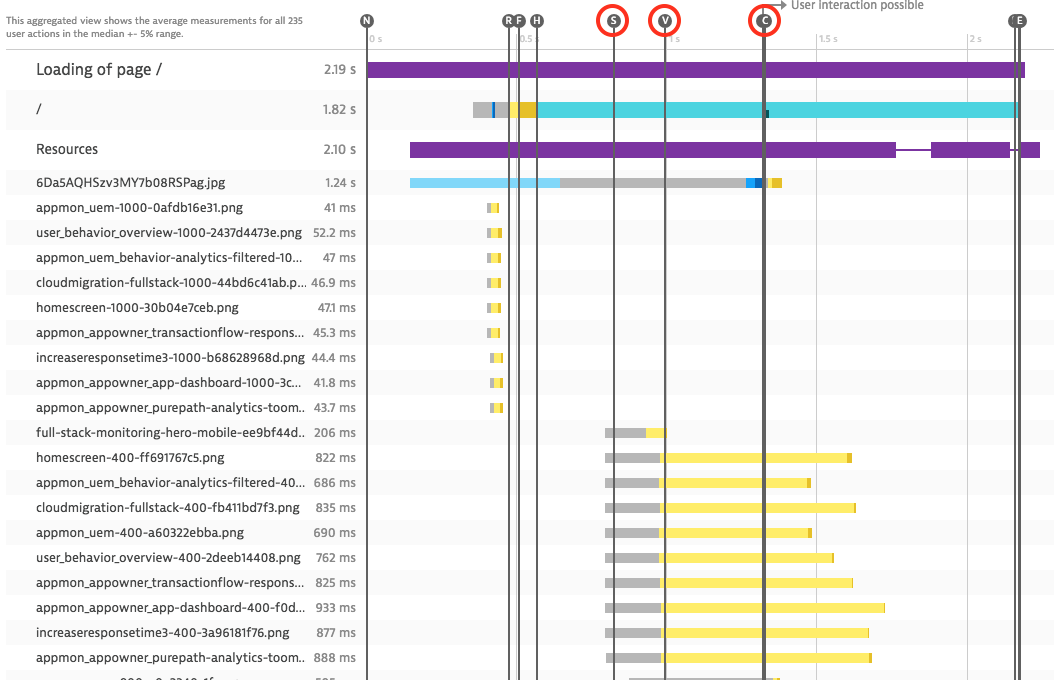
Dynatrace collects Visually complete and Speed index metrics across all screen sizes. Let that sink in for a moment. With aggregated waterfall view, we not only know when pages are visually complete across all sessions, we also know which resources have loaded before and after the above-the-fold content is visually complete!
The unexpected error
Up to this point, everything seems to be hunky dory. Fast pages, an excellent speed index measure, and a satisfying visually complete measure that’s lower than one second. But what if something goes wrong? What if an unexpected error occurs? What if an error is caused by a browser configuration that wasn’t tested thoroughly, or we simply overlooked something?
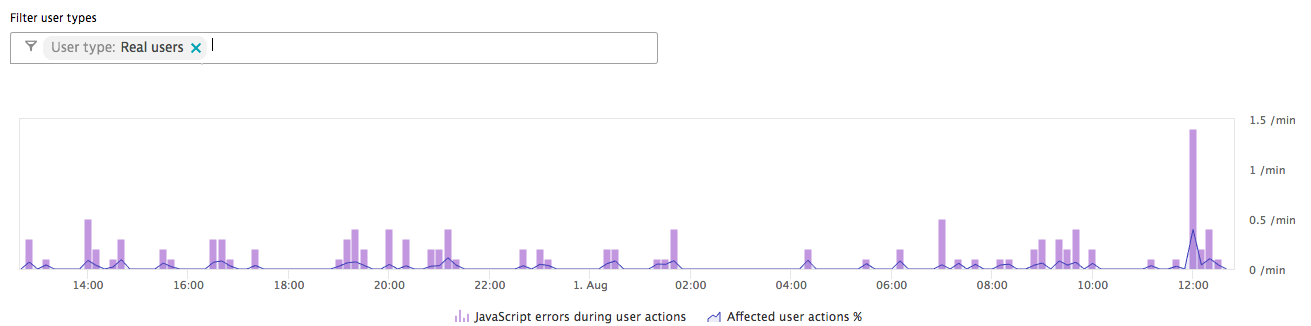
Dynatrace makes the detection and tracking of JavaScript errors a snap. Filtering features make it easy to find the proverbial needle in the haystack. The first thing I typically do is filter all reported errors by user type. Generally speaking, I’m only interested in performance impact on real users, not bots.
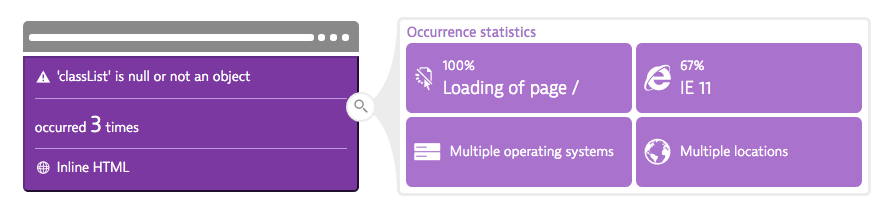
After applying the Real users filter, the list is much more focused. There’s one error in the list that catches my eye immediately. Internet Explorer 11 is throwing errors on our main application. This is odd because Internet Explorer 11 is a well supported browser that implements the classList API very well. How could this error happen? Let’s investigate.
As responsible web developers, our team produces well crafted and highly optimized client-side code. Our client-side JavaScript is minified and obfuscated on deployment (see example below), which reduces the transfer size and parsing time. However, obfuscated code is difficult to read, let alone debug. Debugging minified code is particularly challenging when issues are reported by a third-party or an automated tool.
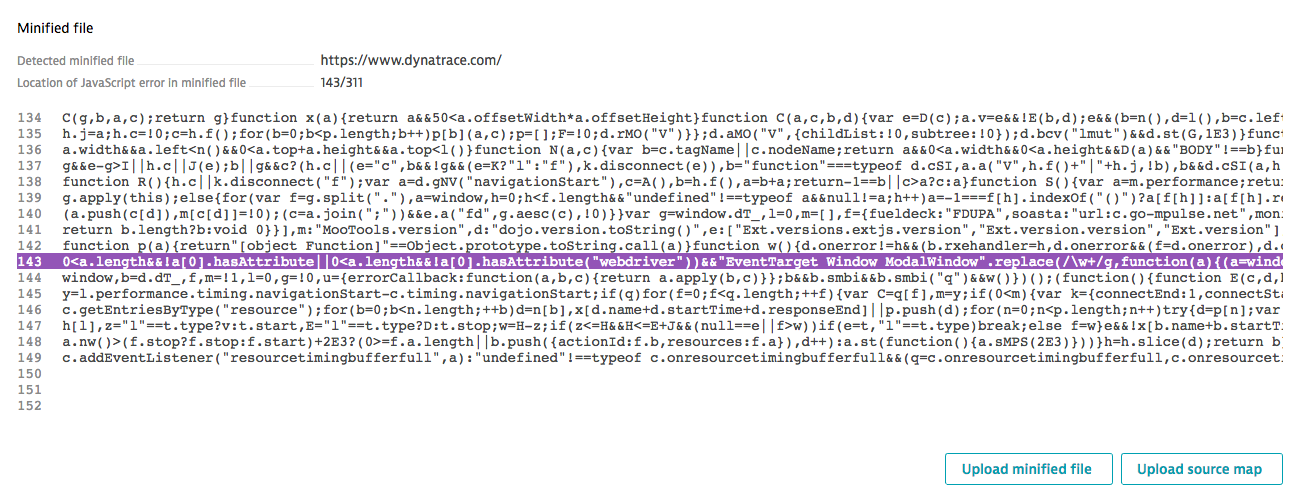
However, with the Dynatrace source map analysis feature we have an easy means of making our source code available for error reporting. Source maps are a way to map compressed and minified JavaScript and CSS code back to their original sources. We upload a source map that’s generated at build time to see in which file exactly the issue occurs.
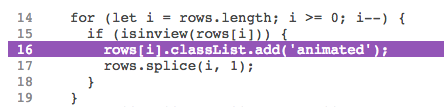
By cross-checking this code with the application itself and taking a quick look into Can I use, we see that classList is well supported for IE11, but not on SVG nodes. This call affects an SVG node. While this is something that’s easy to fix, it’s the sort of thing that’s easy to overlook during development.
The bottom line
A lot has happened in the two years since I wrote my last article about how our web team uses Dynatrace to monitor our web entities. While our website has certainly grown in complexity, Dynatrace has evolved exponentially. New, more advanced Dynatrace features provide invaluable insights to our day-to-day workflow that we can now not live without. Without Dynatrace, we would never be able to develop our web entities as effectively and efficiently as we do. See for yourself with our free Dynatrace trial!


Looking for answers?
Start a new discussion or ask for help in our Q&A forum.
Go to forum