


Logs are where observability gets real — and where it gets messy. Volumes spike without warning. A rule that looked right yesterday can silently drop a critical source after source code changes, or go completely silent if an API token rotates and expires.
Imagine it’s 2 AM and a critical log pipeline of a hardened appliance just went quiet. Nobody notices until an on-call engineer gets paged, and by then, the gap in the data may be the least of anyone’s problems.
With the current release, Dynatrace ships a sharper toolkit, ranging from OneAgent enhancements to new platform and dashboard capabilities, for exactly these moments.
You can see and troubleshoot your log pipelines end to end, identify the moment something breaks, and learn why. You can now size your Dynatrace edge infrastructure even more precisely and configure the OneAgent log module within the modern Dynatrace platform.
In this blog post, we’ll walk through four scenarios pulled straight from the log practitioner’s day-to-day operations feedback, and show how we take you from question to answer — fully self-serviced.
What’s new for log practitioners
See your log pipeline end to end.
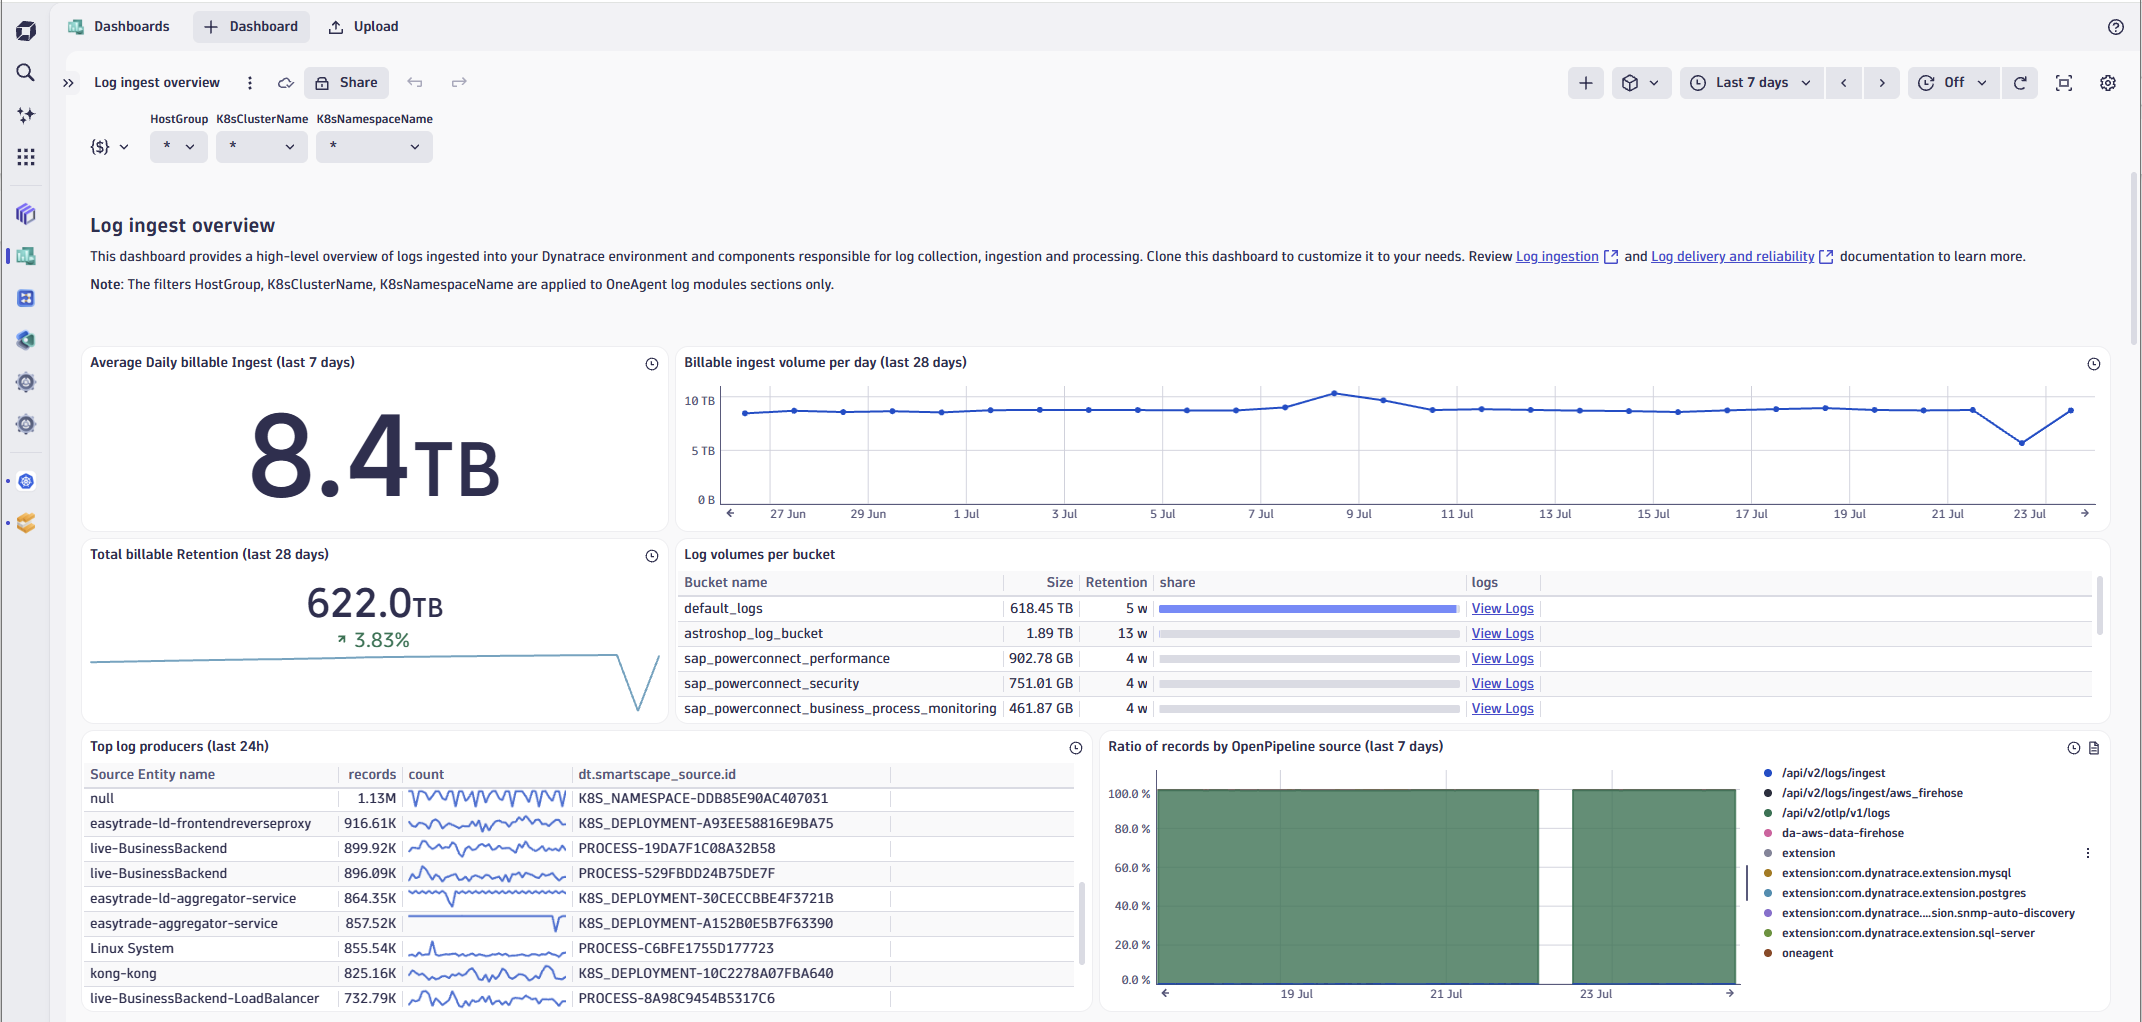
The upgraded Log ingest overview dashboard and new self-service troubleshooting guides help you more easily see source health signals, where data volumes are dropping/changing, and where a misconfiguration might be quietly costing you visibility.
Your OneAgent log modules now tell you what they’re doing.
OneAgent self-monitoring events stream from every agent into a fleet-wide health view, stored alongside your other observability data in Grail. You can see when and why a log source goes silent. You can take action manually or automatically using Dynatrace Workflow automation.
Sizing your Environment ActiveGate is no longer trial and error.
Official sizing guides for the Environment ActiveGate log ingestion API, covering JSON and OTLP (OpenTelemetry Protocol), containerized and host-based deployments (Windows and Linux) have been enhanced with new insights and even larger environment scaling numbers.
Configuring the log module is all included in the Settings app.
Log ingest rules, custom sources, masking, and timestamp patterns all now live together in the Settings app, with a new autodiscovery overview that answers the question every admin asks first: “What is Dynatrace actually capturing right now?” Oh, and you can ask Dynatrace Assist this question too!
Scenario 1: “My logs went silent, where do I start?”
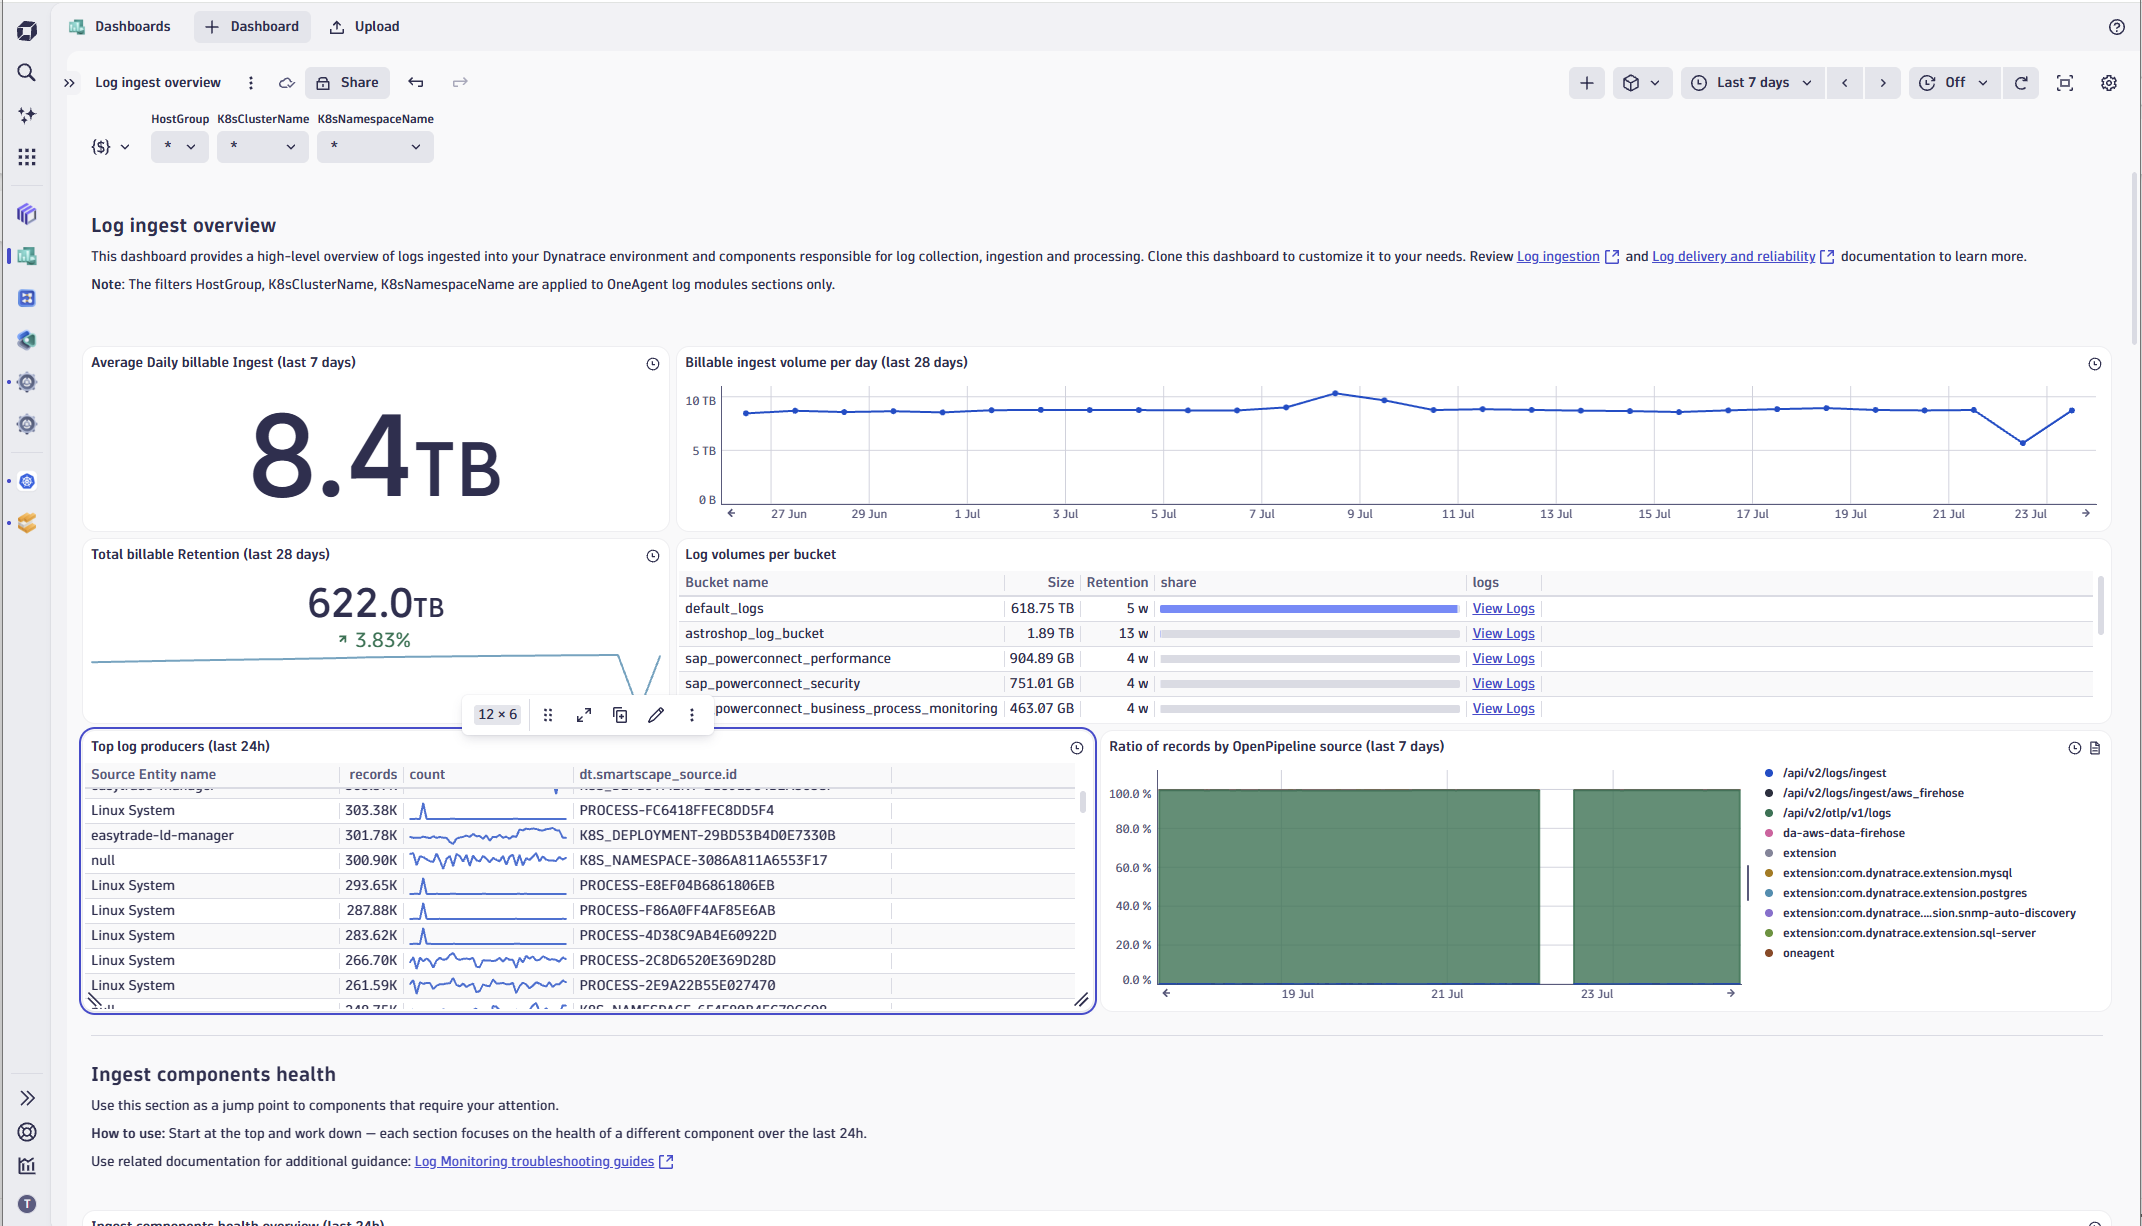
A team reports that their logs went quiet overnight. You can proactively open the Log ingest overview dashboard. Now upgraded with a component health view for both OneAgent log modules and Environment ActiveGate, you get a clear view of log source health without having to inspect each source individually.
- Scroll to “Ingest components health.”
The dashboard highlights components that may need attention, so you can start with the likely problem areas instead of building a query from scratch.
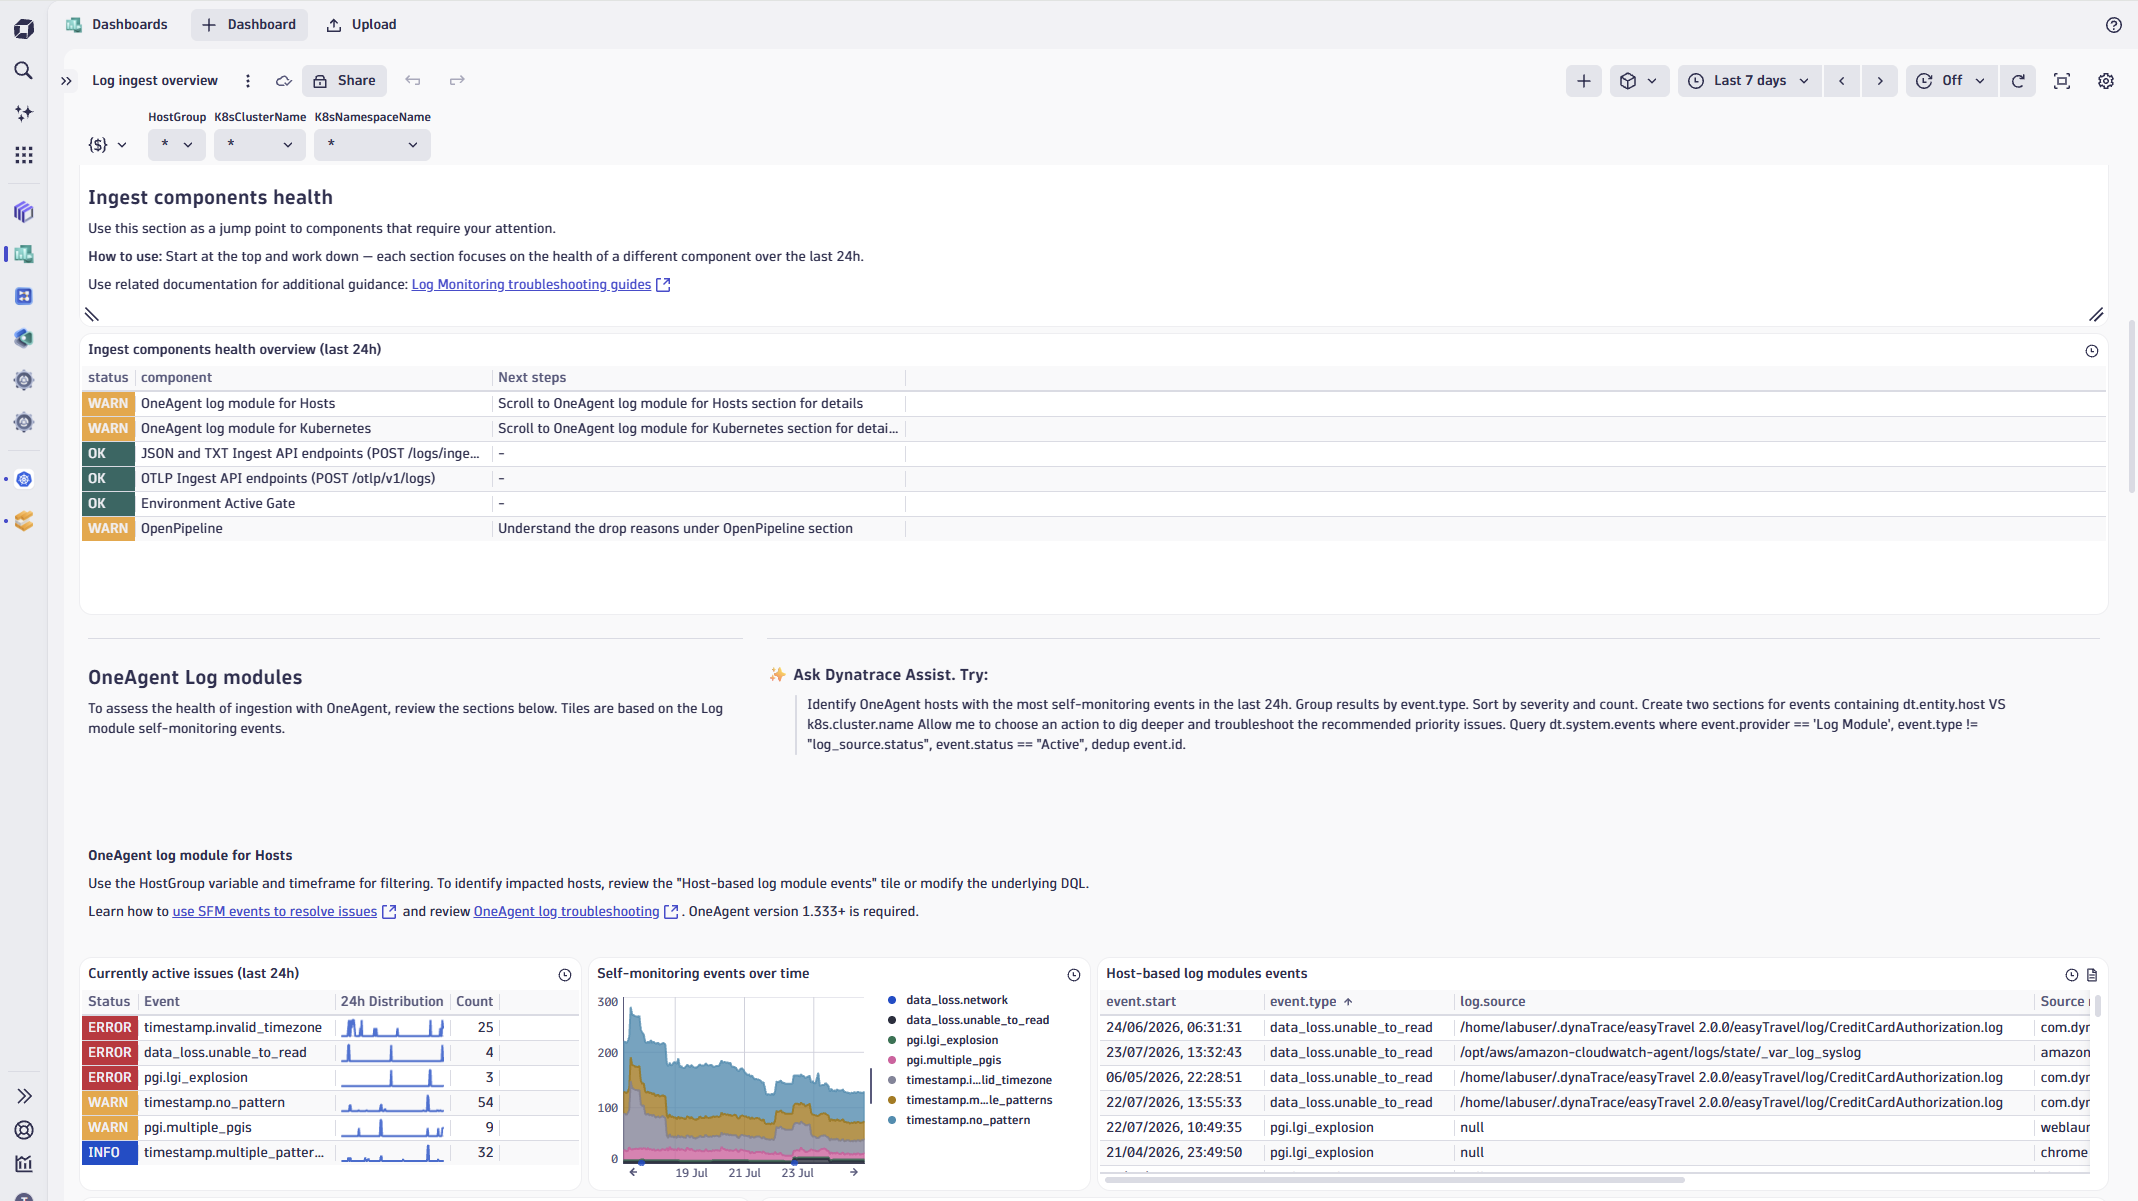
- Drill into the unhealthy component.
The OneAgent log module now emits self-monitoring (SFM) events for exactly this purpose. Health signals and log source status, written straight to Grail asdt.system.events. The event doesn’t just say something’s wrong; it’s designed to point to the root cause.
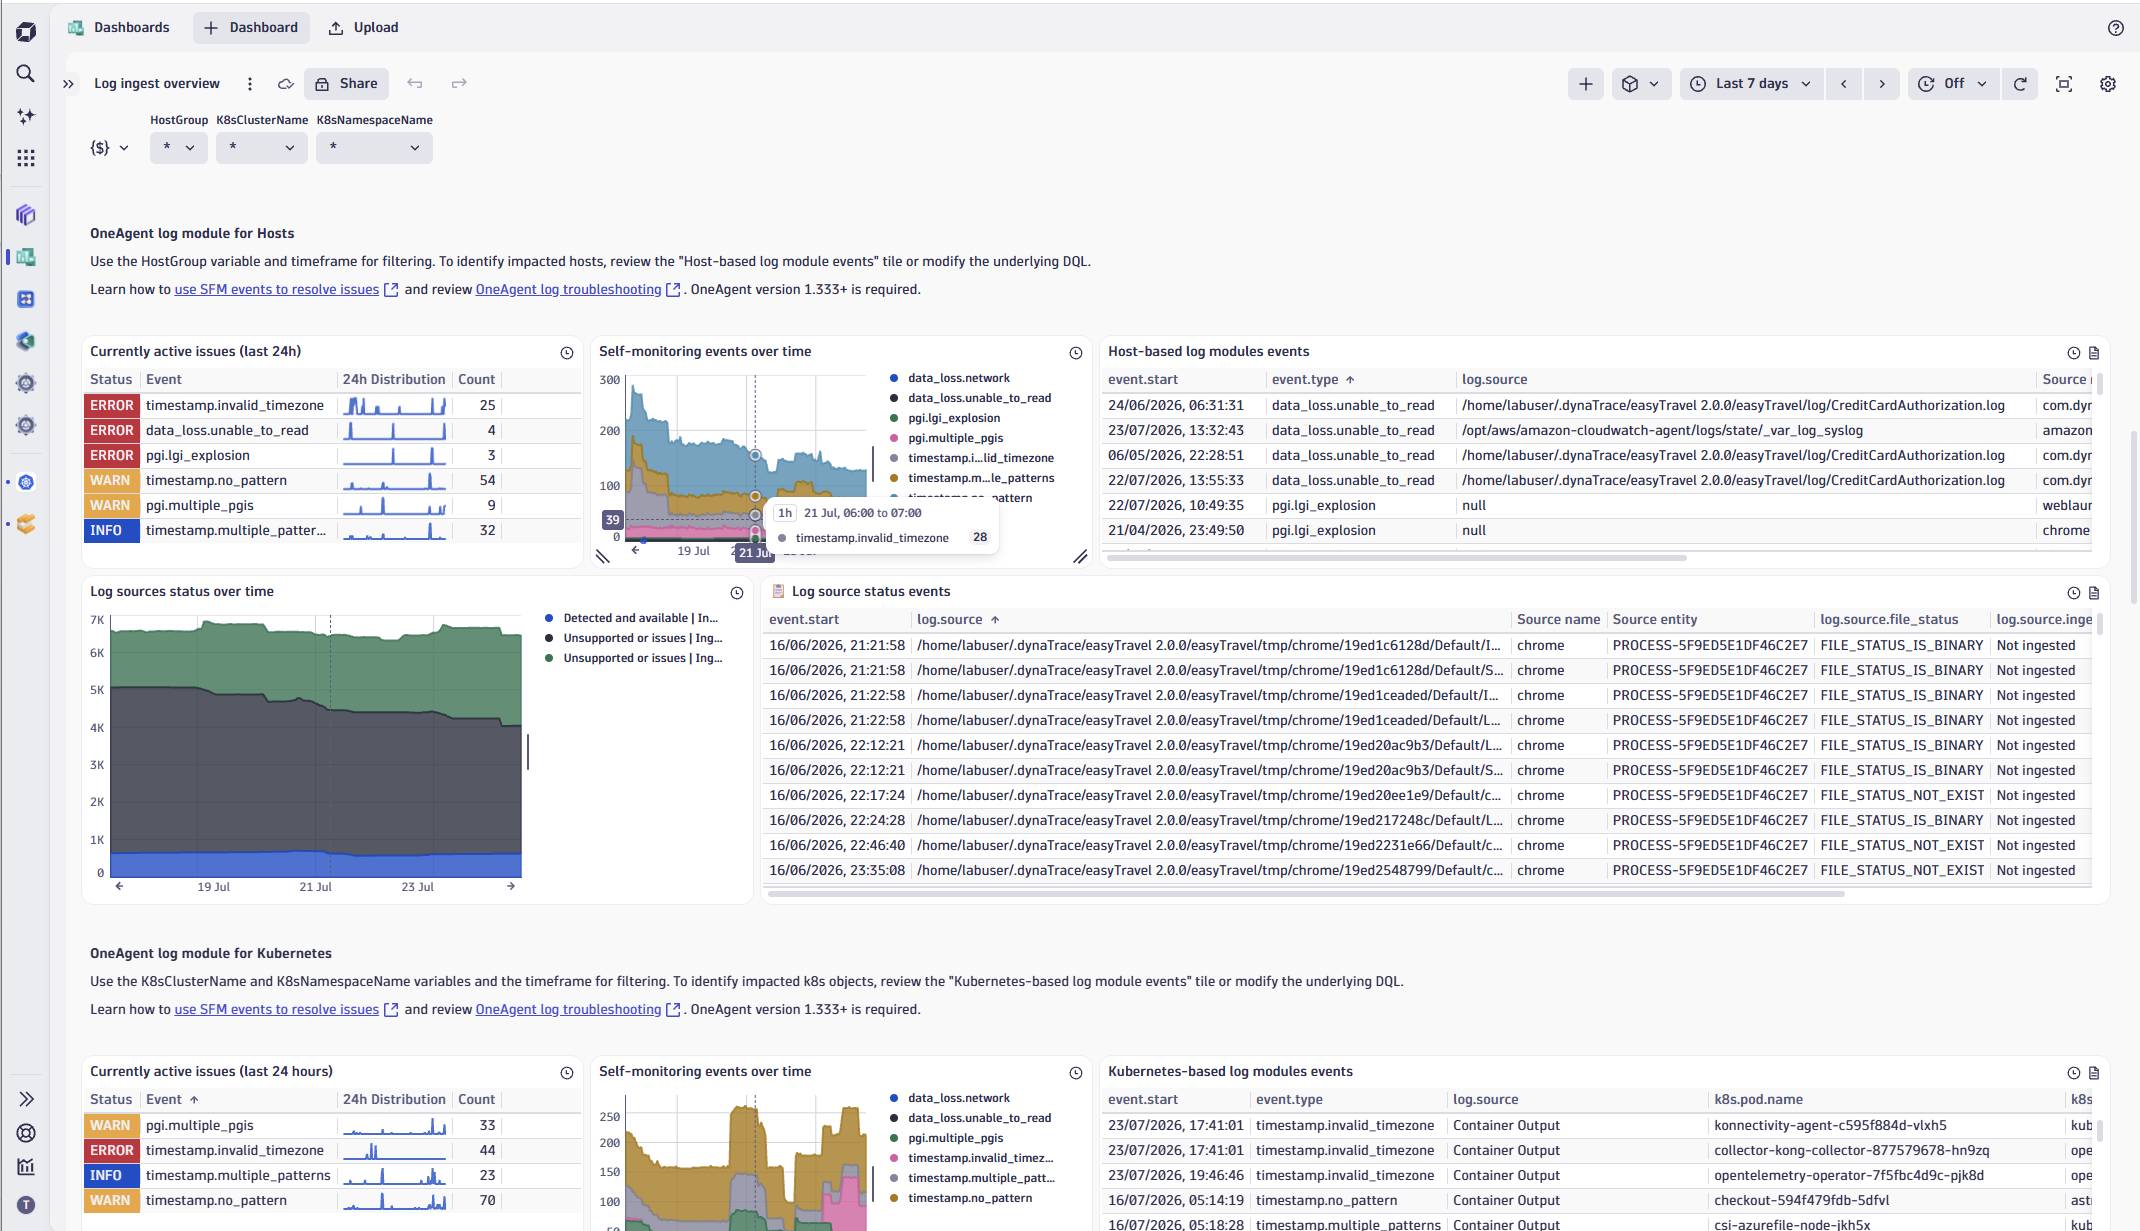
- Follow the remediation, not a runbook you have to hunt for.
Every event type is backed by documentation that explains its meaning and suggests a fix — from a compressed or rotated file, to an unsupported encoding, to a missing timestamp pattern.
From dashboard, to root cause, to fix in one flow!
Scenario 2: “What is Dynatrace actually capturing right now?”
Your team captain pings you: one of their services is missing logs. You need to find out what Dynatrace is capturing, what it isn’t, and why – fast!
- Open the “Configure log module” in the Settings app.
This is the latest Dynatrace UX for the OneAgent log module configuration. All in one place for your configuration and policy requirements, just like before, centrally managed within the platform. - Start with coverage, not configuration.
The Sources tab opens with an environment-wide overview: how many host groups, Kubernetes clusters, hosts, and log sources are autodiscovered, and what percentage of each is actually covered by an ingest rule? The question “what are we capturing?” is answered before you touch a single setting.
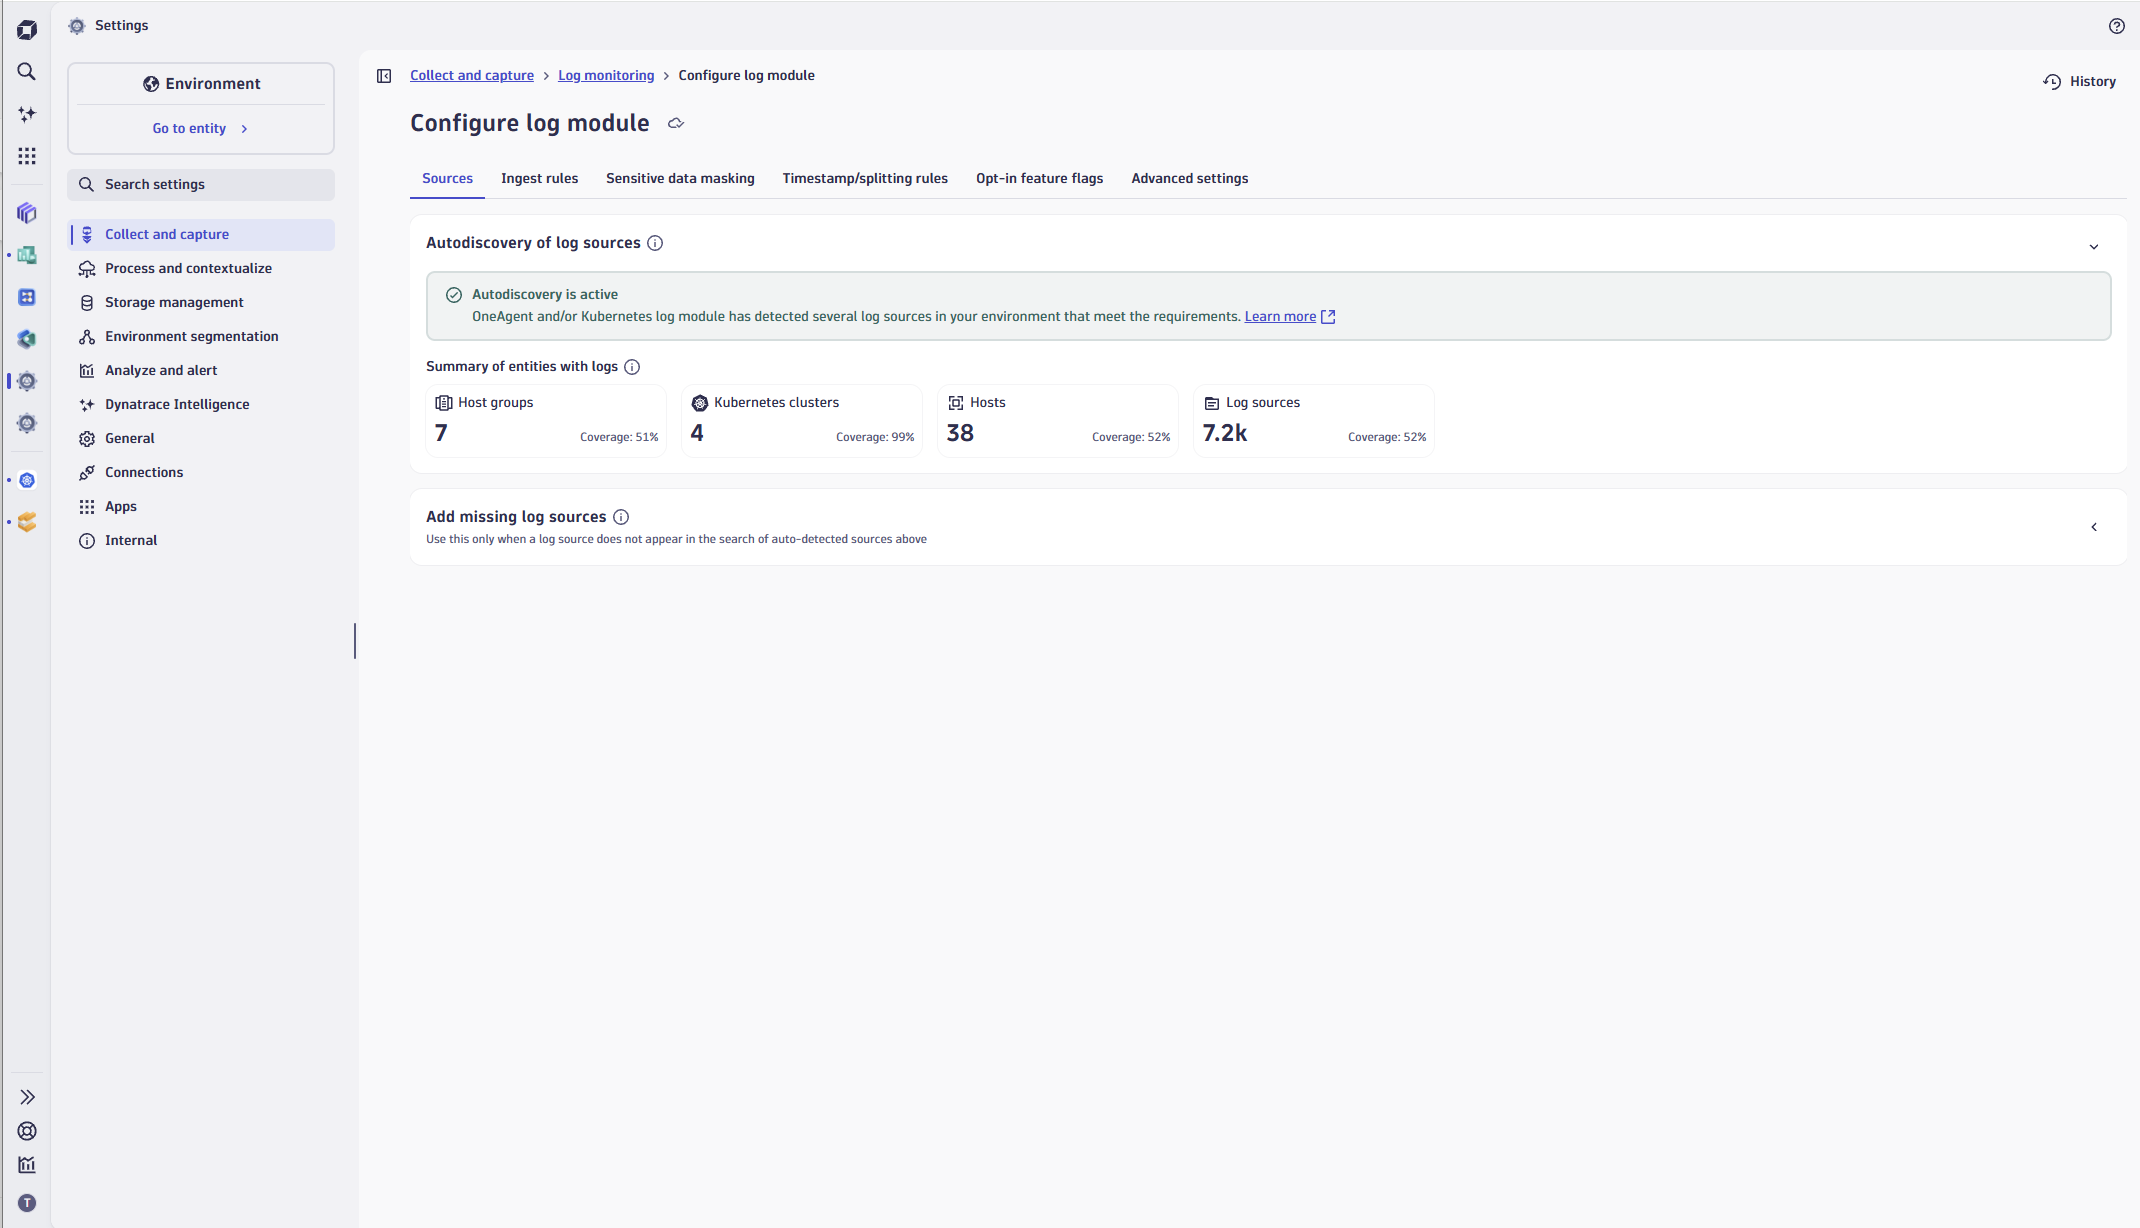
- Drill into the low-coverage host group.
That’s your gap, and likely why your team is missing logs. From the same row, open the action menu, review the entity configuration, and create an ingest rule directly. You go from spotting a gap to fixing it without leaving the page. - See the full picture: active and inherited rules, together.
This is the upgrade that used to require tracing across multiple pages — what’s defined at this scope, plus everything inherited from the environment or a higher host group — is now shown in one place. Select any inherited rule to jump straight to its definition.

From “logs are missing” to fixed, in one flow — whether you’ve run Dynatrace for years or this is your first week.
Scenario 3: “Log volume spiked overnight — where’s it coming from?”
A monitoring budget owner flags that consumption spiked — or you spot it first, proactively, on the dashboard.
- Check “Top log producers.”
A new entry jumps out: a source you don’t recognize, suddenly dominating volume.
- Open it in the Logs app.
Filtering on the source shows mostly debug-level chatter — verbose logging that shouldn’t be reaching production volume. - Check recent ingest rule changes.
A debug-logs rule was meant to scope to a dev environment, but the matcher caught production too. The lesson — scope your matchers carefully — is now visible in minutes, not after the invoice arrives. - Fix the scope, then close the loop.
Create a log metric for the source and add a Dynatrace Intelligence AI alert on volume drops and spikes, so the next spike is a notification, not a surprise on the bill.
From budget alert, to root cause, to prevention — in one sitting.
Scenario 4: “Sizing an Environment ActiveGate for a cluster migration”
Your team is migrating a chatty service from a legacy log platform. They already know it pushes roughly 800 MB of log events per minute, and they want those logs landing in Dynatrace by the end of the sprint. You’re sizing the Environment ActiveGate that has to carry it, alongside the OneAgent traffic. That’s the mix scenario the new guides are built for: one Environment ActiveGate, two traffic types, sized together instead of guessed at separately.
- Step 1 — start from the base configuration.
Use the ActiveGate sizing guide for OneAgent traffic routing and proxying to establish the base ActiveGate configuration for your cluster size. - Step 2 — add replicas for OTLP log traffic.
The official sizing documentation gives you per-replica capacity for OTLP log ingestion. For a medium-sized cluster (1,000–5,000 pods) pushing around 800 MB per minute, that’s roughly one additional replica on top of the base configuration.
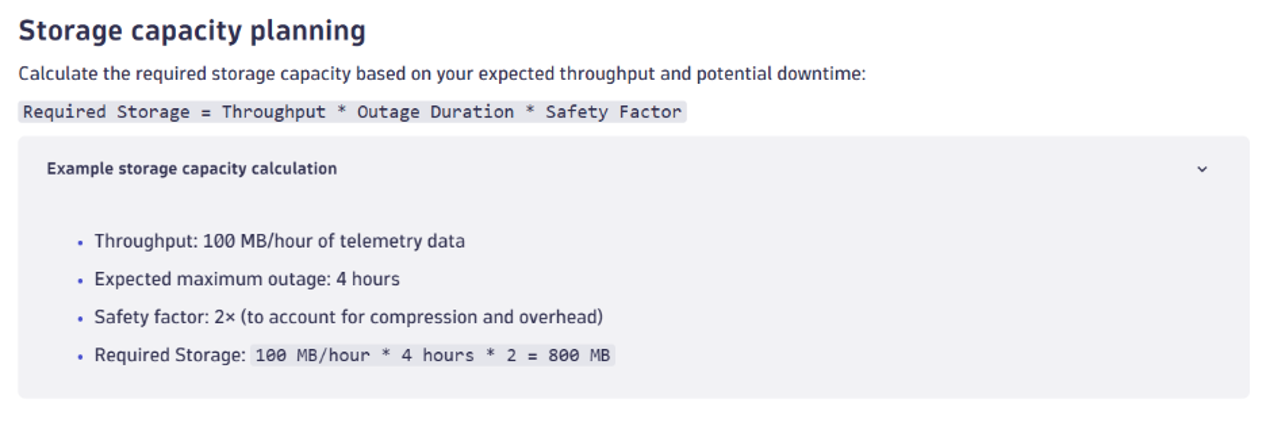
Two steps, one documented calculation, no spreadsheet. Sized once, deployed with confidence.
Why this matters for you
If you’re a Dynatrace admin running logs at enterprise scale: fewer support tickets, faster resolution, optimized budgets, and ActiveGate deployments – and a real answer when leadership asks, “are we losing data?”
If you’re an observability or config owner: a single, modern surface for log configuration, with the hierarchy and overrides that used to require a tribal-knowledge handoff now visible on page.
Suppose you’re a small team trying Dynatrace for the first time, and you’re looking for an onboarding path that doesn’t require a specialist. See your sources, pick one, and ingest. The journey from “logs off” to “logs working” is short enough that one engineer can champion it for the whole team.
Get started
The Log ingest overview dashboard and OneAgent log module self-monitoring events are available today to all Dynatrace SaaS customers using Grail and the latest Dynatrace.
Log Monitoring Classic customers can opt in to self-monitoring events; for all others, no configuration is required.
The new Sources and log ingest configuration experience is provided in Settings app > Collect and capture > Log monitoring > Configure log module.
- Explore the dashboard: Open Log ingest overview in the Dashboards.
- Configure your log module: Go to
Settings app > Collect and capture > Log monitoring > Configure log module. - Size your Environment ActiveGate: Review the ActiveGate resource management and sizing guides.
- New to Dynatrace logs? Start a free trial and get your first log source ingesting today.
If you have specific improvements in mind or want to share feedback, visit our Dynatrace Community feedback channel — we’re building this resilience and UX roadmap directly from what practitioners tell us.



Looking for answers?
Start a new discussion or ask for help in our Q&A forum.
Go to forum