


Logs provide the ground truth of what's happening across your systems — but finding meaningful signals in that data can feel like searching for a needle in a haystack. A single Kubernetes cluster can generate thousands of nearly identical log messages within minutes, originating from dozens of applications and services that often lack a consistent structure.
Making sense of that volume of data typically requires extensive filtering, manual exploration, or complex queries. Instead of spending time searching for patterns, teams should focus on understanding and resolving issues.
Dynatrace log pattern analysis, now in preview, makes it easy to identify recurring patterns in free-text log data. With a single click, you can analyze large volumes of logs, uncover common message structures, and separate meaningful signals from noise — without writing a single line of code.
Pattern analysis automatically groups similar log messages and highlights their variable components to help you understand what’s happening across your environment more quickly than ever.
Go from discovery to action
Identifying a pattern is only the first step. When you discover a pattern worth investigating further, the Logs app automatically generates a Dynatrace Query Language (DQL) query that includes a Dynatrace Pattern Language (DPL) parsing statement. This allows you to operationalize the pattern immediately and reuse it across the Dynatrace platform, without the need to write queries by hand.
Use detected patterns to:
- Build dashboards and visualizations
- Create analytics queries with DQL
- Configure processors in OpenPipeline
- Trigger automations and workflows
- Standardize parsing logic across teams
Whether you’re new to Dynatrace or an experienced power user, Log Pattern Analyzer helps you transform massive volumes of raw log data into structured, reusable insights — faster.
From thousands of log lines to a handful of patterns
Log pattern analysis automatically groups similar logs by analyzing their content structure, extracting and isolating variable fields into distinct tokens, such as timestamps and identifiers from static text. These entries are merged into clusters that share a common message; a repeating pattern. This provides flexibility in how you analyze logs at scale:
- Apply a segment, a pre-filtered condition that your domain experts created.
- Apply filters for exploratory use cases.
- Select a custom timeframe, from minutes up to several days and weeks.
Powered by Dynatrace Intelligence, the dynamic part of a log line is reduced to a distinct token. The results are automatically pre-sorted by severity and pattern frequency.
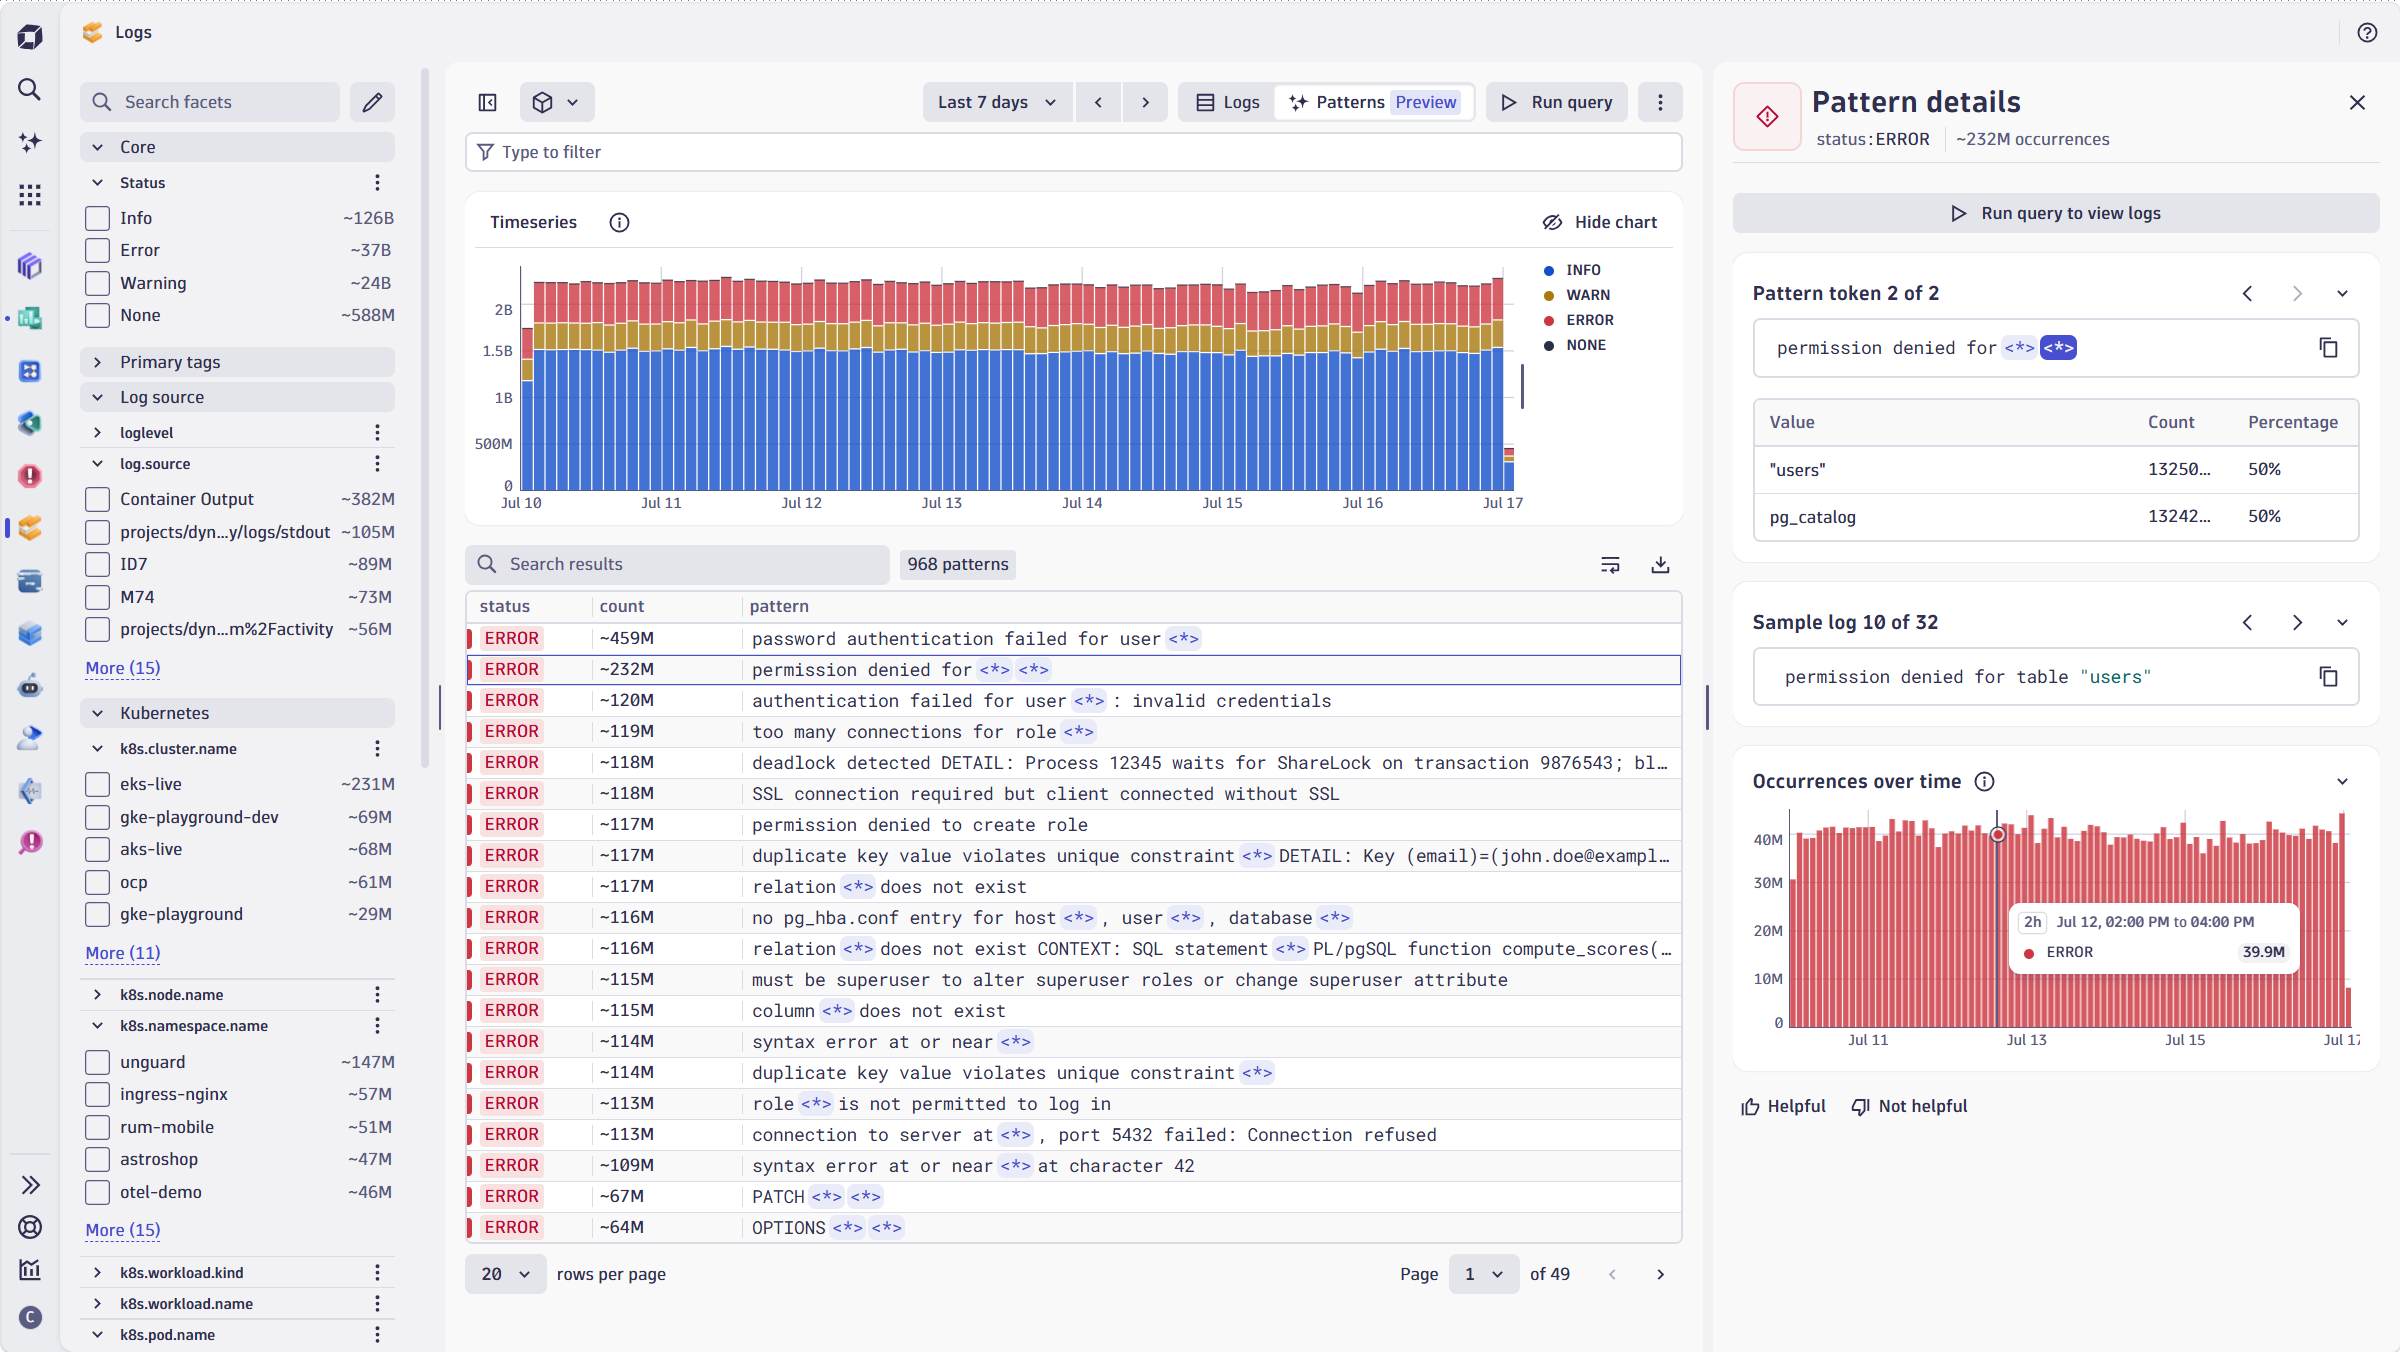
Need to quickly check which IPs contribute to a specific service error? Do all the logs refer to the same error code, or is there an outlier? We’ve got you covered.
What you get with each pattern is not just a distinction between the static part of the log message and a token. Dynatrace also identifies what kind of value that token represents, so you can understand what is changing across similar log records:
- timestamp
- IP address
- number
- free text
Instead of treating each record as unique because the timestamp, IP address, number, or free-text value is different, Dynatrace recognizes the shared structure behind those records and turns it into something you can analyze and reuse. That’s what turns 1,000 log records scattered across a dataset of 100,000 logs into a single log pattern that occurred 1,000 times. This analysis is typically applied in just a few seconds – live and at query time.
The power of the Dynatrace Grail unified data lake house further supports your expedited review of log events – often millions of log events in just a few seconds – and responsive actions.
How log pattern analysis accelerates everyday investigations
Understand error spikes faster
A service failure rate suddenly increases, and thousands of new log records start pouring in. Instead of manually reviewing individual messages, use log pattern analysis to automatically group similar errors. The most common patterns rise to the top, along with their occurrence counts and time trends.
This helps you quickly answer critical questions:
- Which error patterns are driving the spike?
- Is a single error responsible for most failures?
- Did a new error pattern appear recently?
- Which pattern should I investigate first?
By surfacing patterns and their frequency, log pattern analysis helps you move from symptom to root-cause investigation rapidly.
Spot unusual behavior hidden in the noise
The most important signal isn’t always the most frequent one. Imagine an application that appears healthy because 99% of its logs match expected patterns. Buried among them is a small cluster of messages revealing intermittent API timeouts.
When thousands of individual log lines are reduced to a handful of patterns, unusual behavior becomes far easier to detect. Rare, new, or changing patterns stand out immediately, helping you uncover issues that traditional searches can miss.
Find anomalies in high-volume access logs
Web and API access logs often contain millions of successful requests. If most records return HTTP 200 responses, it can be arduous to find problematic requests manually.
Pattern analysis separates common request patterns from outliers, making it easier to identify unusual status codes, unexpected endpoints, authentication failures, or traffic anomalies without building complex queries.
Understand new and unfamiliar log sources with ease
When onboarding a new application, service, or host, one of the first challenges is understanding what its logs actually contain. Similarly, many teams run third-party applications whose logs are, in their own words, “full of information we don’t understand.” Onboarding such a new source usually means reverse-engineering its structure by hand. Pattern analysis lets you grasp the shape of a source at a glance and fingerprint the patterns to automate lifecycle operations and health monitoring.
Instead of reading hundreds of raw log lines, use pattern analysis to automatically reveal the most common message structures.
Log patterns provide you insights into:
- What kinds of events the source generates
- Which fields vary between messages
- How frequently each pattern occurs
- Which patterns might require parsing or enrichment
This makes log onboarding and exploration significantly faster, even when you’re unfamiliar with the application generating the logs.
Quickly explore variable values within patterns
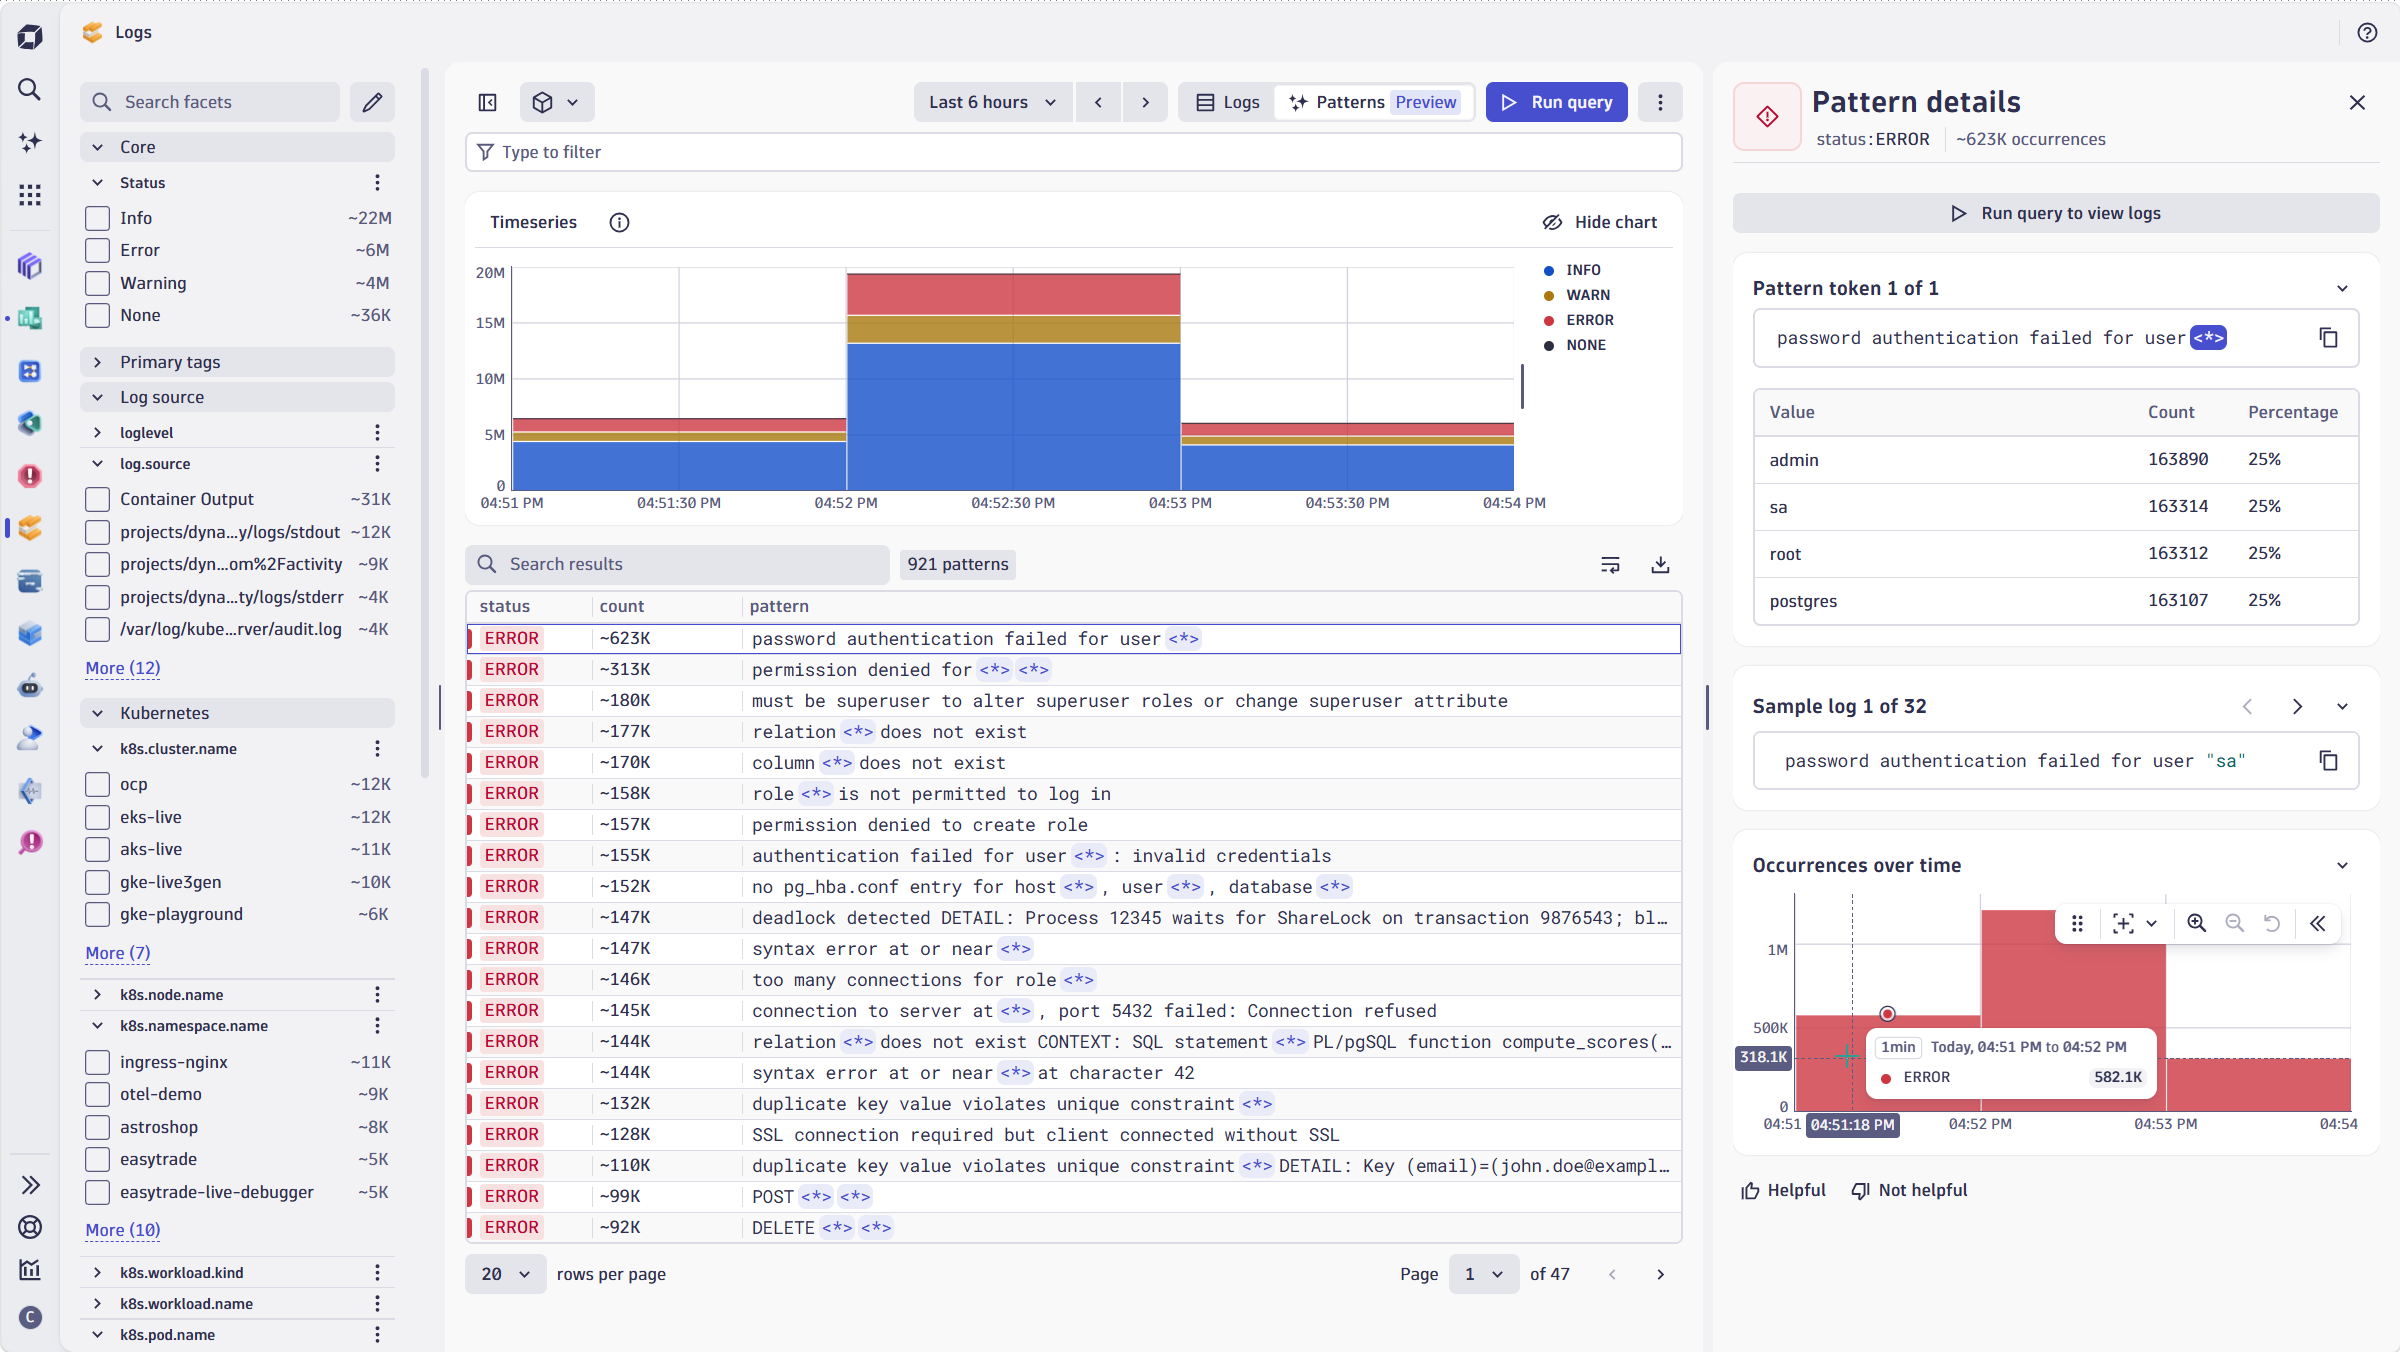
Expand any pattern to inspect the distribution of its tokens. Condense thousands of networking log events and browse the tokens and their entities within a detected pattern. See which IP addresses are behind an error and how they distribute in volume, and over time. It’s the answer to the question, “which host, which ID, which code” is really relevant, all without a fuzzy text search or a complex parse.
Get the power of DQL without writing DQL
You no longer need to be a DQL expert to extract structure from unstructured logs.
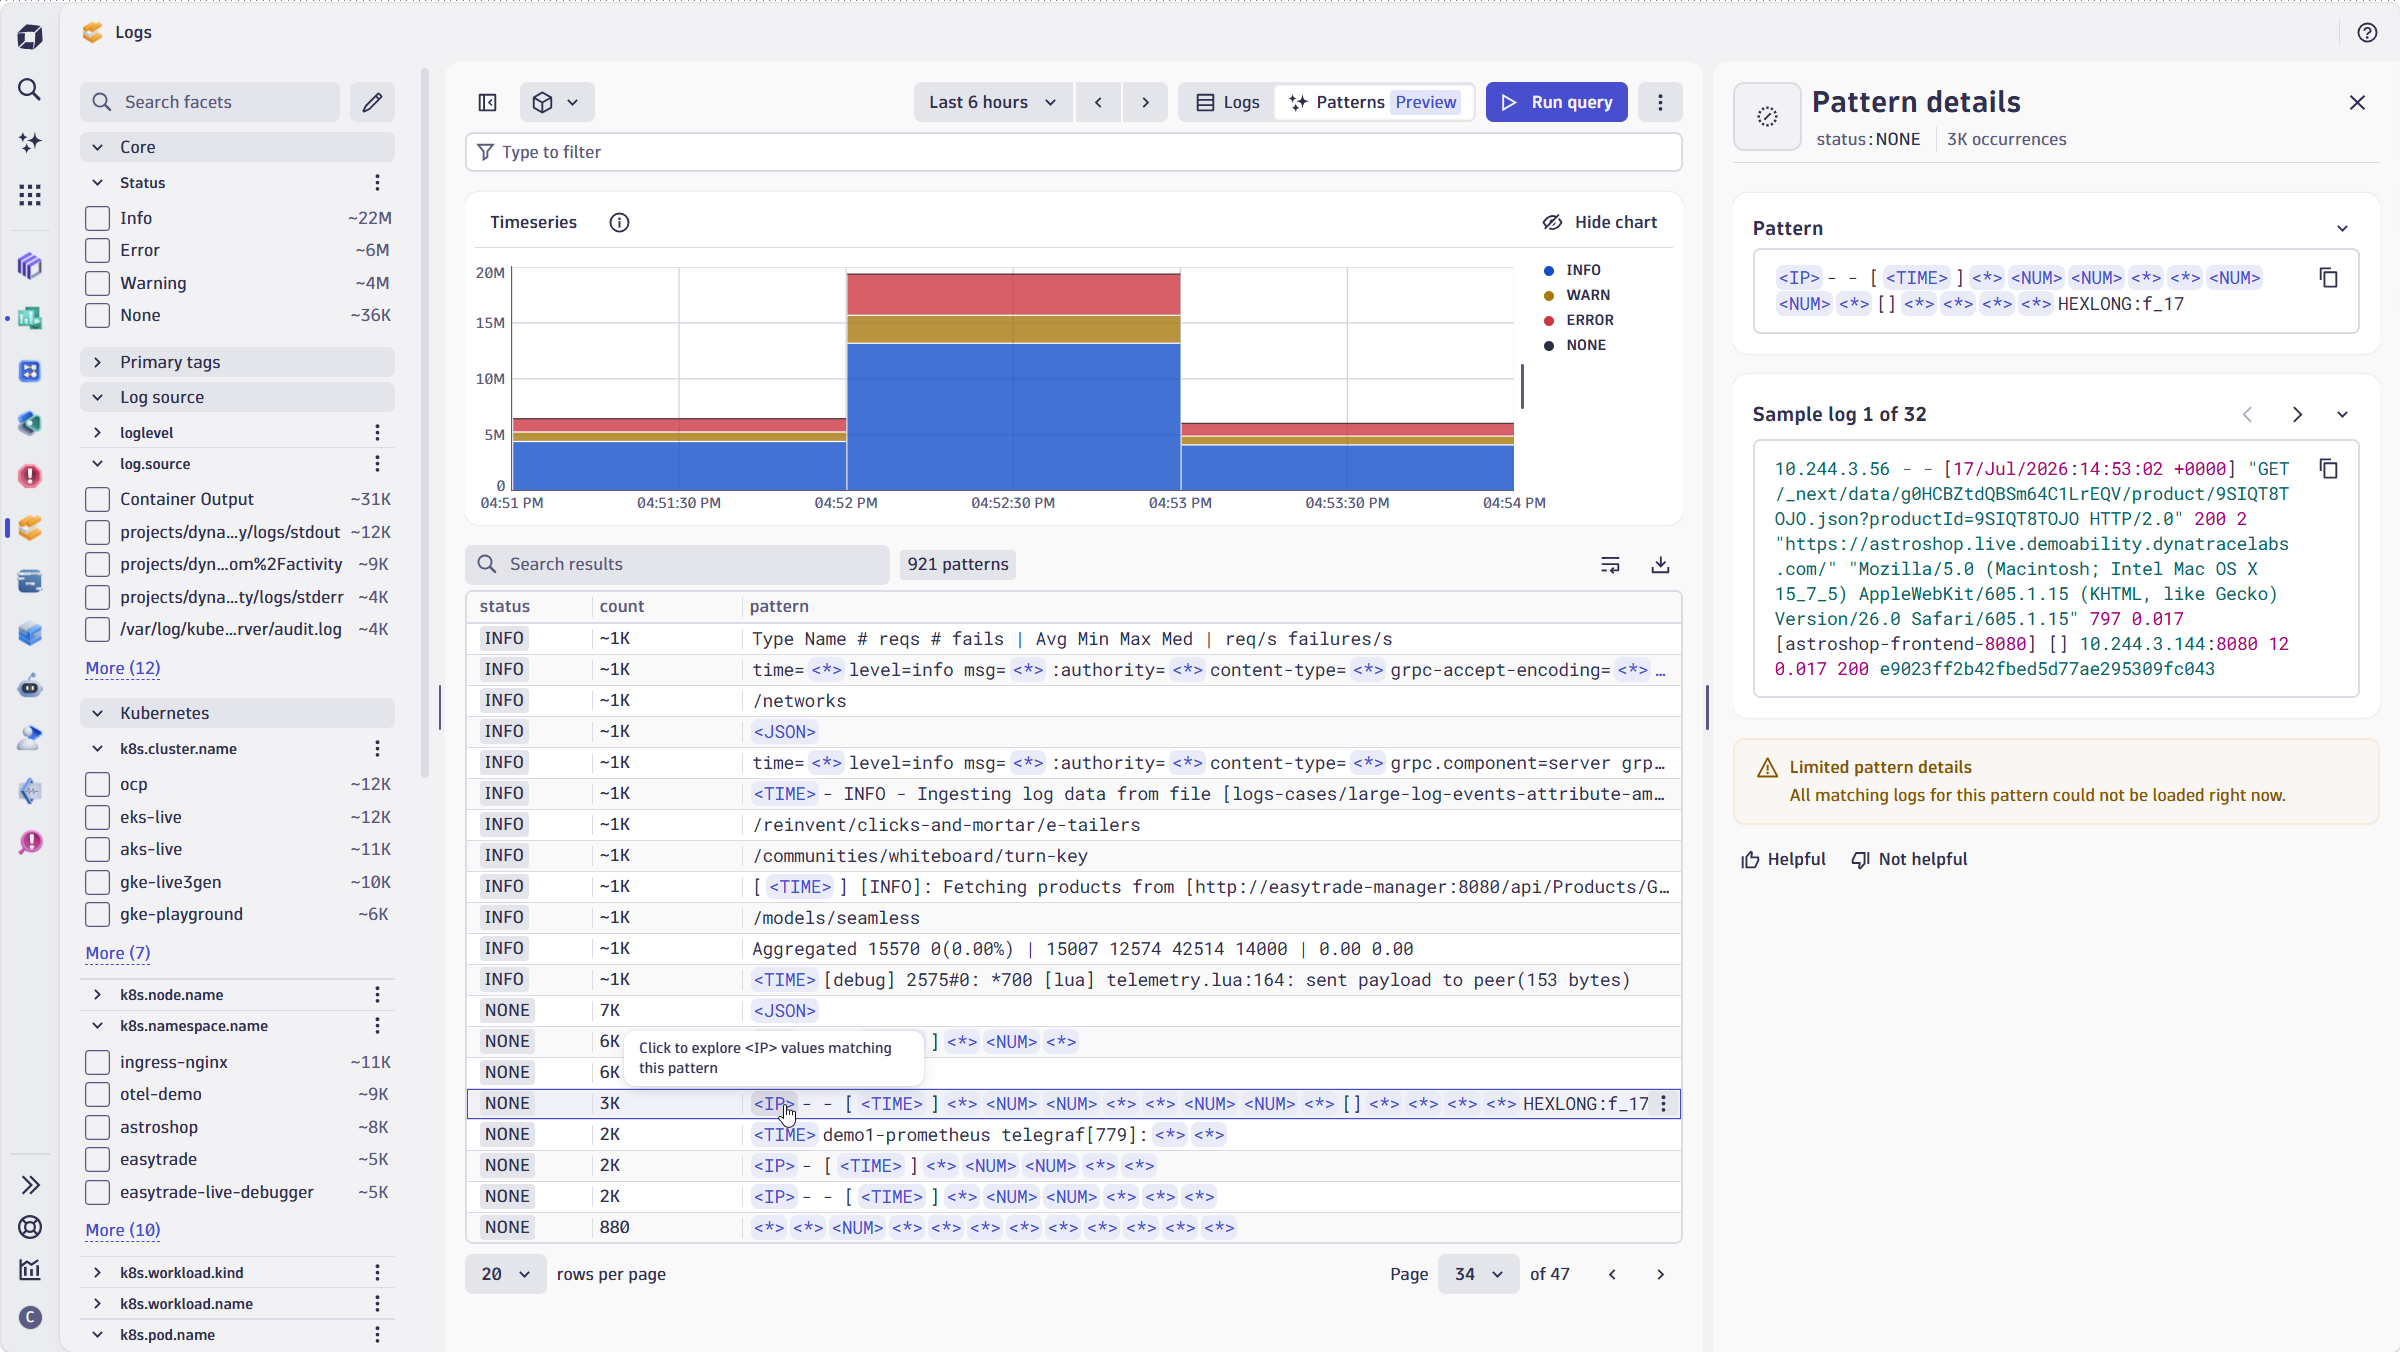
With log pattern analysis, Dynatrace automatically identifies patterns in your logs and generates the corresponding Dynatrace Pattern Language (DPL) parsing statement for you. What once required pattern-writing experience is now available with a single click.
For newer users, this removes one of the biggest barriers to log analysis: figuring out how to parse and structure free-text log data. For experienced users, it eliminates repetitive pattern-authoring work and accelerates investigation workflows.
Simply copy the generated DPL pattern and use it anywhere Dynatrace Query Language (DQL) is supported, including:
- Dashboards
- Notebooks
- OpenPipeline processors
- Log analytics queries
- Workflows and automation
Instead of spending time crafting parsing logic, you can move directly from discovery to analysis and action. Log pattern analysis turns advanced log parsing into a capability anyone can use, regardless of their DQL experience.
Get started with log pattern analysis today
Log pattern analysis is available as a preview for all Dynatrace SaaS customers with Grail and DPS. After registering for the preview, the Dynatrace product documentation provides all the information you need on filtering and analysis capabilities.
Sign up for the log pattern analysis preview program.
We’d love your feedback. Tell us what works and what you’d improve in the Dynatrace Community.




Looking for answers?
Start a new discussion or ask for help in our Q&A forum.
Go to forum