
Imagine a friend pings you, asking to meet them at a new restaurant whose location you don’t know. Would you simply step outside and start walking, hoping that you’ll somehow find the restaurant by luck? More likely, you’ll open a navigation app on your mobile device, search for the address, and set your route. A critical incident in your IT stack is no different. You shouldn’t have to guess your way through the dark alleys of logs, traces, and warnings, asking passersby for assistance, just to be bounced from one guess to the next. This is where Dynatrace comes in: curating what’s most relevant, guiding engineers to the next best steps, and confidently guiding them from alert to resolution.
At Dynatrace, we’ve long led the way in root cause analysis, automatically detecting when something’s wrong and identifying why. These AI-powered insights form the intelligent backbone of how Dynatrace guides engineers through complex, entangled problems, turning a confusing cityscape of data into a focused remediation journey.
In this blog post, we follow Omar, a fictitious SRE working on Astroshop, the Dynatrace OpenTelemetry demo application. Omar works with Sophie, a developer, to resolve a critical failure.
Dynatrace guides them, and any team, through every step of the incident lifecycle, with speed, precision, and confidence. Here’s how:
- Problem diagnosis – Dynatrace automatically packages the failures into a single correlated problem.
- Alerting – Omar receives a rich, actionable notification, right where he works, with root cause analysis (RCA), ownership, and deep links already in place.
- Triage – The problem details page serves as a “triage and remediation command center,” showing Omar what’s impacted, who’s affected, and which issues to prioritize for remediation.
- Handoff – From within the problem context, a guided Jira ticket populated with RCA insights, logs, and deep links can be created with one click.
- Guided investigations – Problems view lists all incidents related to the context of the problem.
- Remediation – Using Live Debugger and real-time metrics, Sophie fixes the issue and sees immediate confirmation that the fix worked.
- Reinforcement and learning for the future – The fix is automatically documented in a troubleshooting guide, turning today’s incident into tomorrow’s intelligence.
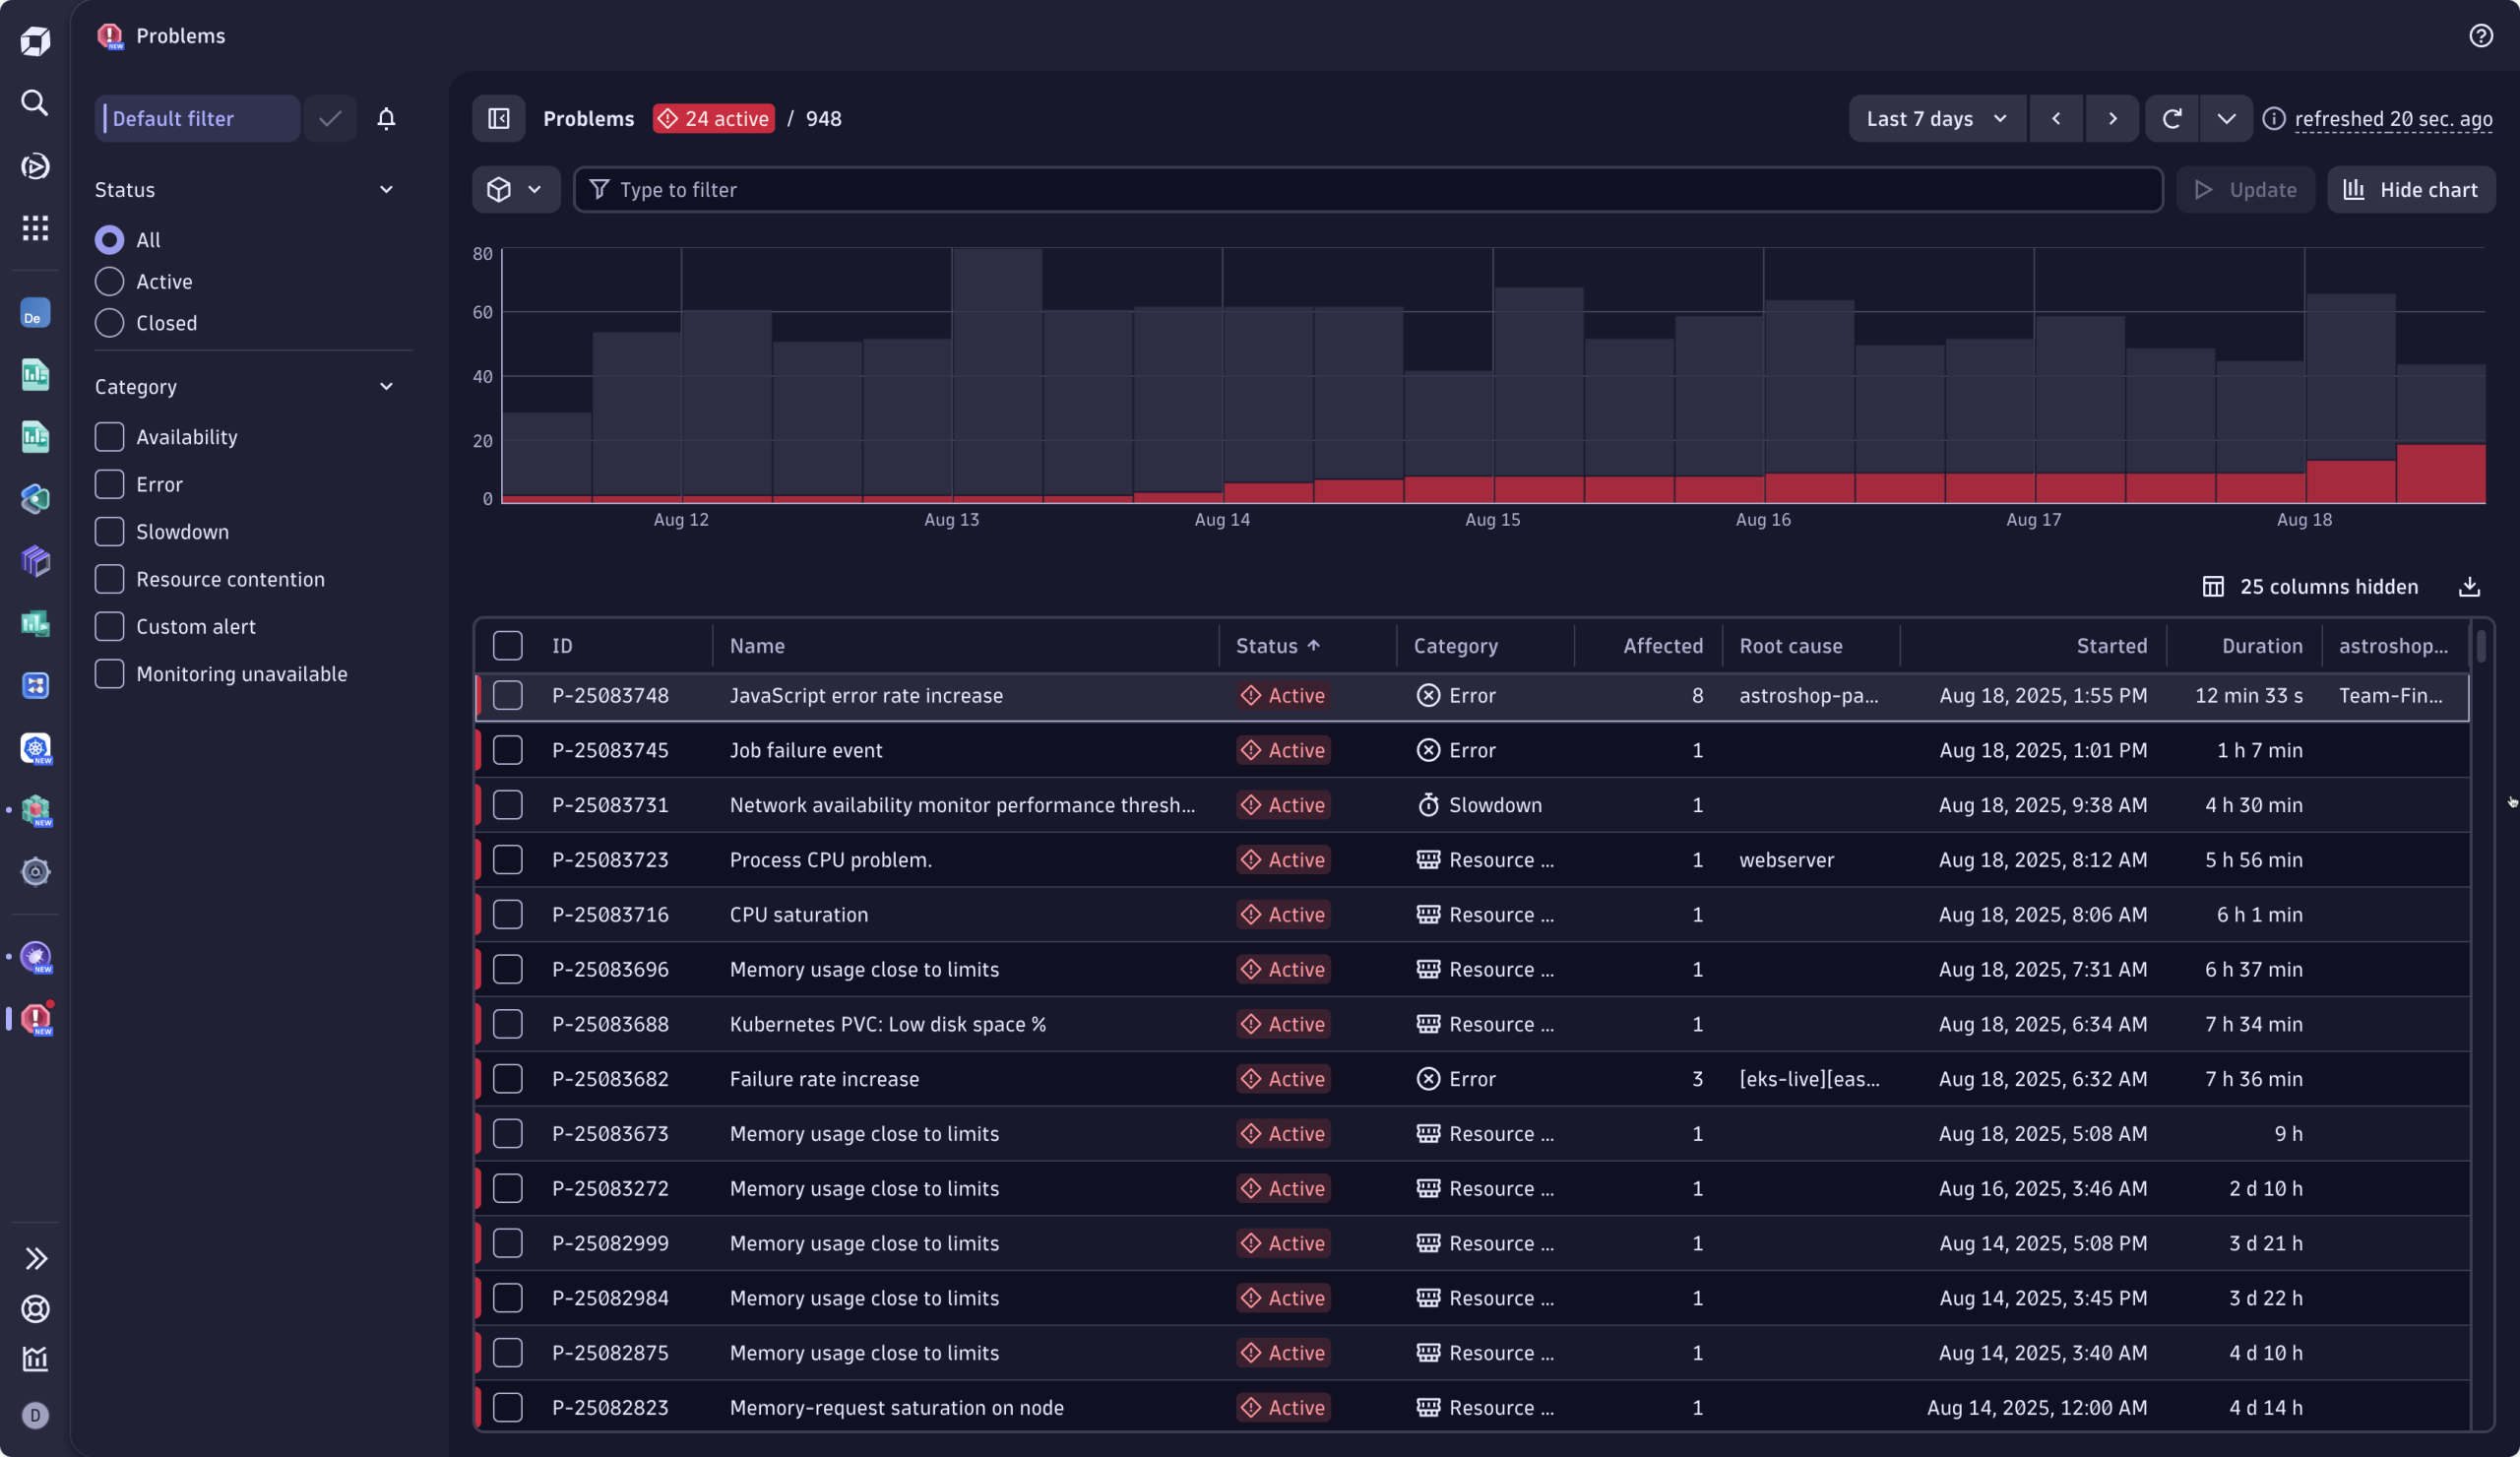
Problem diagnosis: multiple incidents and a stream of signals tied into one cohesive problem
The Astroshop online store recently began experiencing errors when customers attempted to pay using American Express credit cards. Error messages prevent users from completing their purchases. Dynatrace seasonal baselining detected this service health issue, reduced alert noise by clustering all related events into a single problem, and tied all the relevant telemetry (logs, metrics, and traces) to the affected users, infrastructure, and SLOs.
By determining the ownership of the service, based on the Kubernetes label, the problem is automatically routed to the right team: Omar’s SRE team.
Contextual alerting
Meanwhile, Omar, the on-call SRE, receives the notification directly in the context where Omar and his team work, Slack. The notification reads, Failure rate increase in payment service.
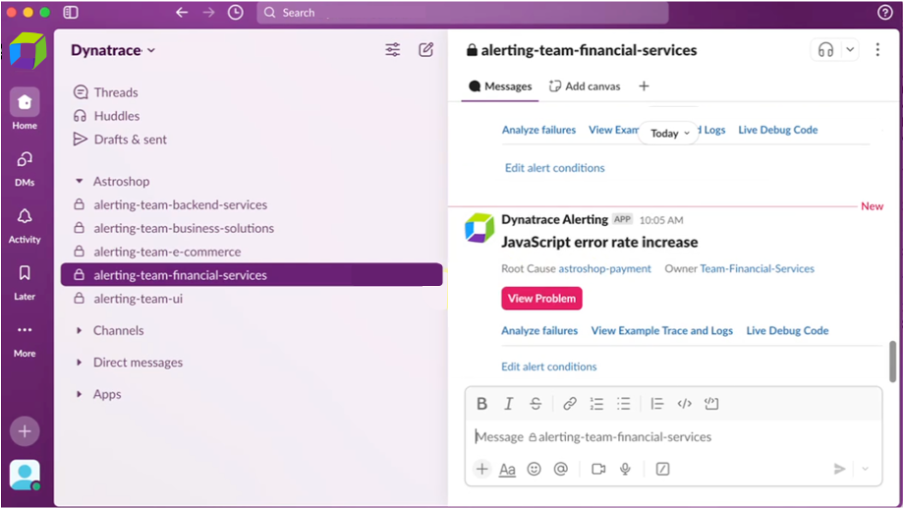
Notifications like these can, of course, also show up in JIRA, ServiceNow, or other tools, depending on where your team works and wants to be notified. The notification provides a link to the full context, where Omar can begin remediation straight away. The notification identifies the root cause and service owners. It also provides directly accessible opinionated drilldowns, removing the need to open different tools. Omar starts his work by investigating the context and responding to the incident.
Triage: understand what, who, and how bad
Selecting the View problem button in the Slack notification brings Omar to the related Problem page, his triage and remediation command center.
At a glance, Omar can answer the following questions: How bad is this problem? Who and what is affected? How long has the problem existed? And, what is my best course of action?
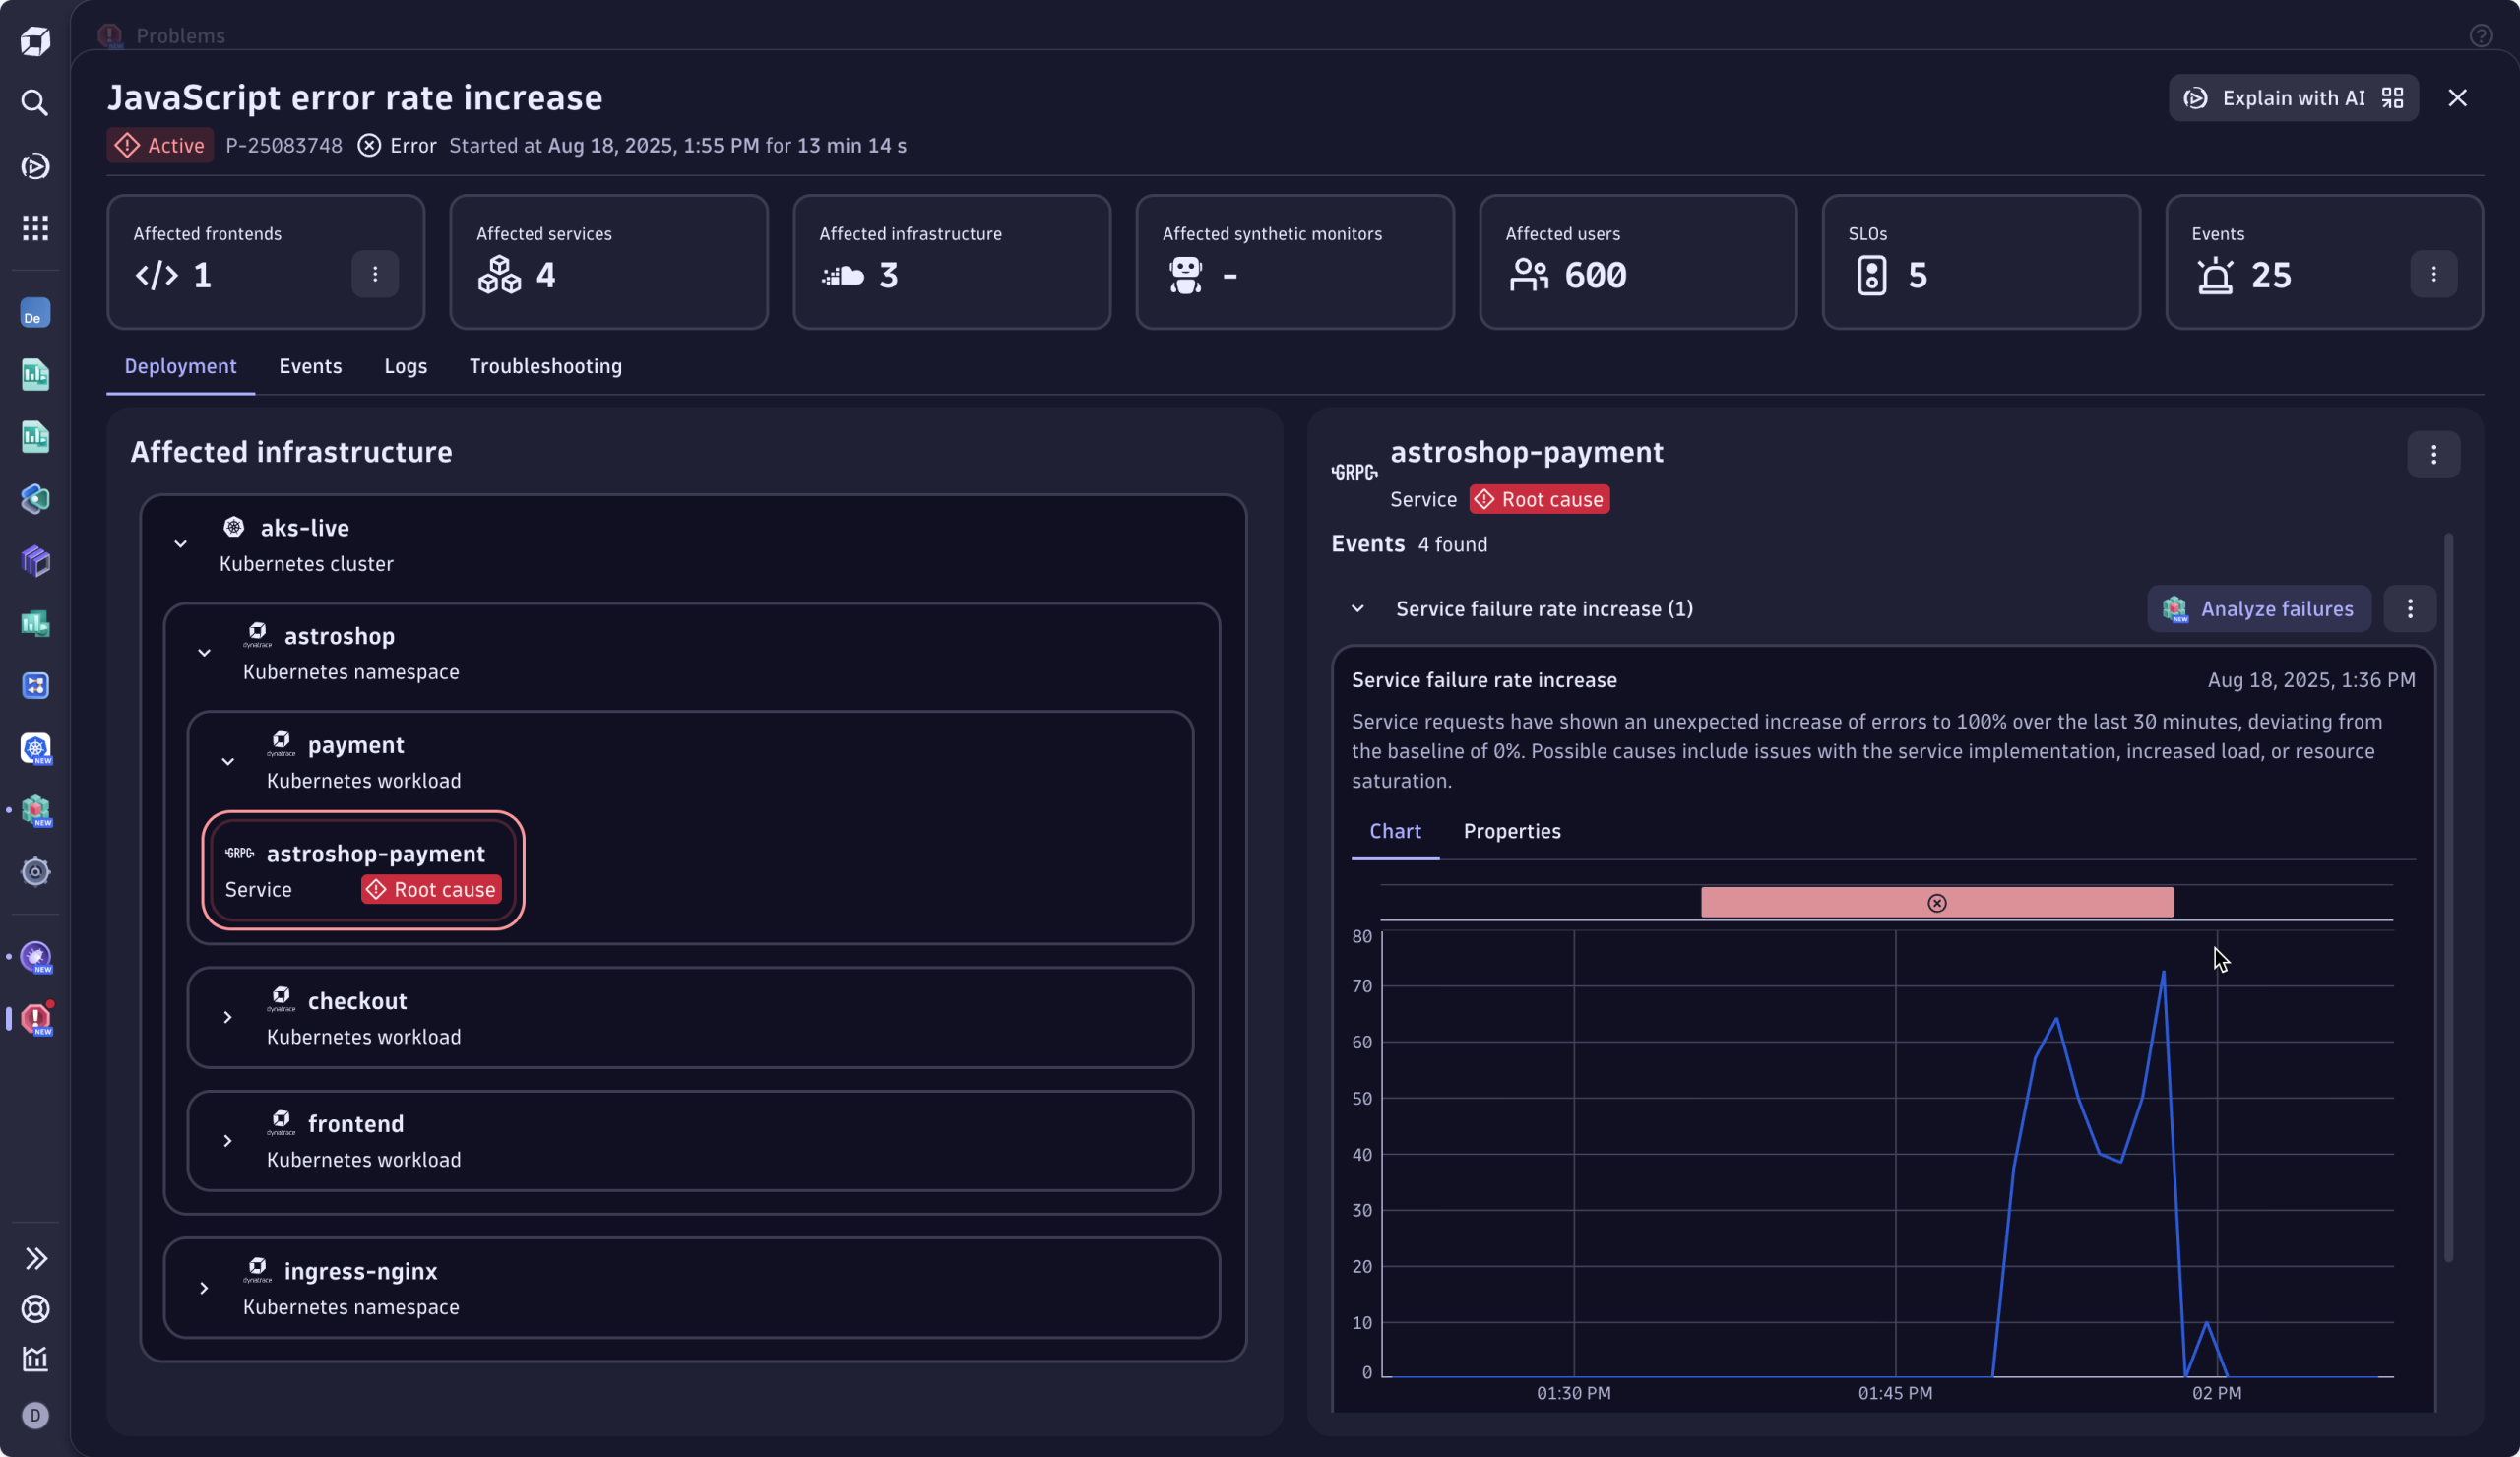
First question: How bad is it, and who’s affected?
From the Problem Incident header, Omar immediately understands that the issue is blocking revenue: 600 users failed to check out their purchase. Furthermore, he sees that there is one frontend and six services are affected, and the error puts five SLOs at risk. Clicking one of the tiles allows the engineer to drill down into further details, offering clear “what to look at next” calls to action.
While unfamiliar with the error, Omar understands that this issue is severe and must be prioritized. Before taking action, he wants to understand the current situation compared to the normal state, which leads to his next question.
Second question: How long has this been going on, and how many checkouts are failing?
The event chart makes it clear: the incident has been ongoing for thirty minutes. Omar sees exactly how the event has evolved over time. The baseline-aware metrics allow him to distinguish between normal fluctuations and true anomalies. Here, the current behavior deviates from normal, with a significant increase in errors, evidently deviating from the baseline, where no errors are expected over that same period, around the same time of the day.
Meaning, for the last thirty minutes, many more people were unable to complete their purchases than usual. The issue is ongoing. In the blink of an eye, he has validated the severity of the incident.
Third question: What’s broken?
The deployment view on the left provides a visual breakdown of the failure by component and cluster. The root cause engine correlated all contributing events and factors, and pinpointed the exact service at fault: the culprit, a Kubernetes workload associated with the “payment service.”
Fourth question: Who can fix it?
This is now easy. The root cause, clearly labeled within the affected infrastructure, clarifies ownership. Omar sees that Sophie, the developer from Team Finance, owns the failing service.
Swiftly guided through the incident, Omar can confidently hand over the issue to the right person.
Handoff: effortless and precise handoff to the responsible team
Omar kicks off a handoff directly from the problem details page within Dynatrace. With a single click, Omar creates a Jira Issue containing all relevant information.
The Jira ticket is populated with the problem identifiers, making it easy to understand the affected services and components at stake without toggling between tools. No ping-pong escalations, just clear, confident delegation with minimal overhead.
Sophie, the owning developer, receives the Jira notification and opens the ticket to find everything she needs: a brief summary with direct links to the problem view, failure analysis, and Live Debugger.
Guided investigation in problem mode
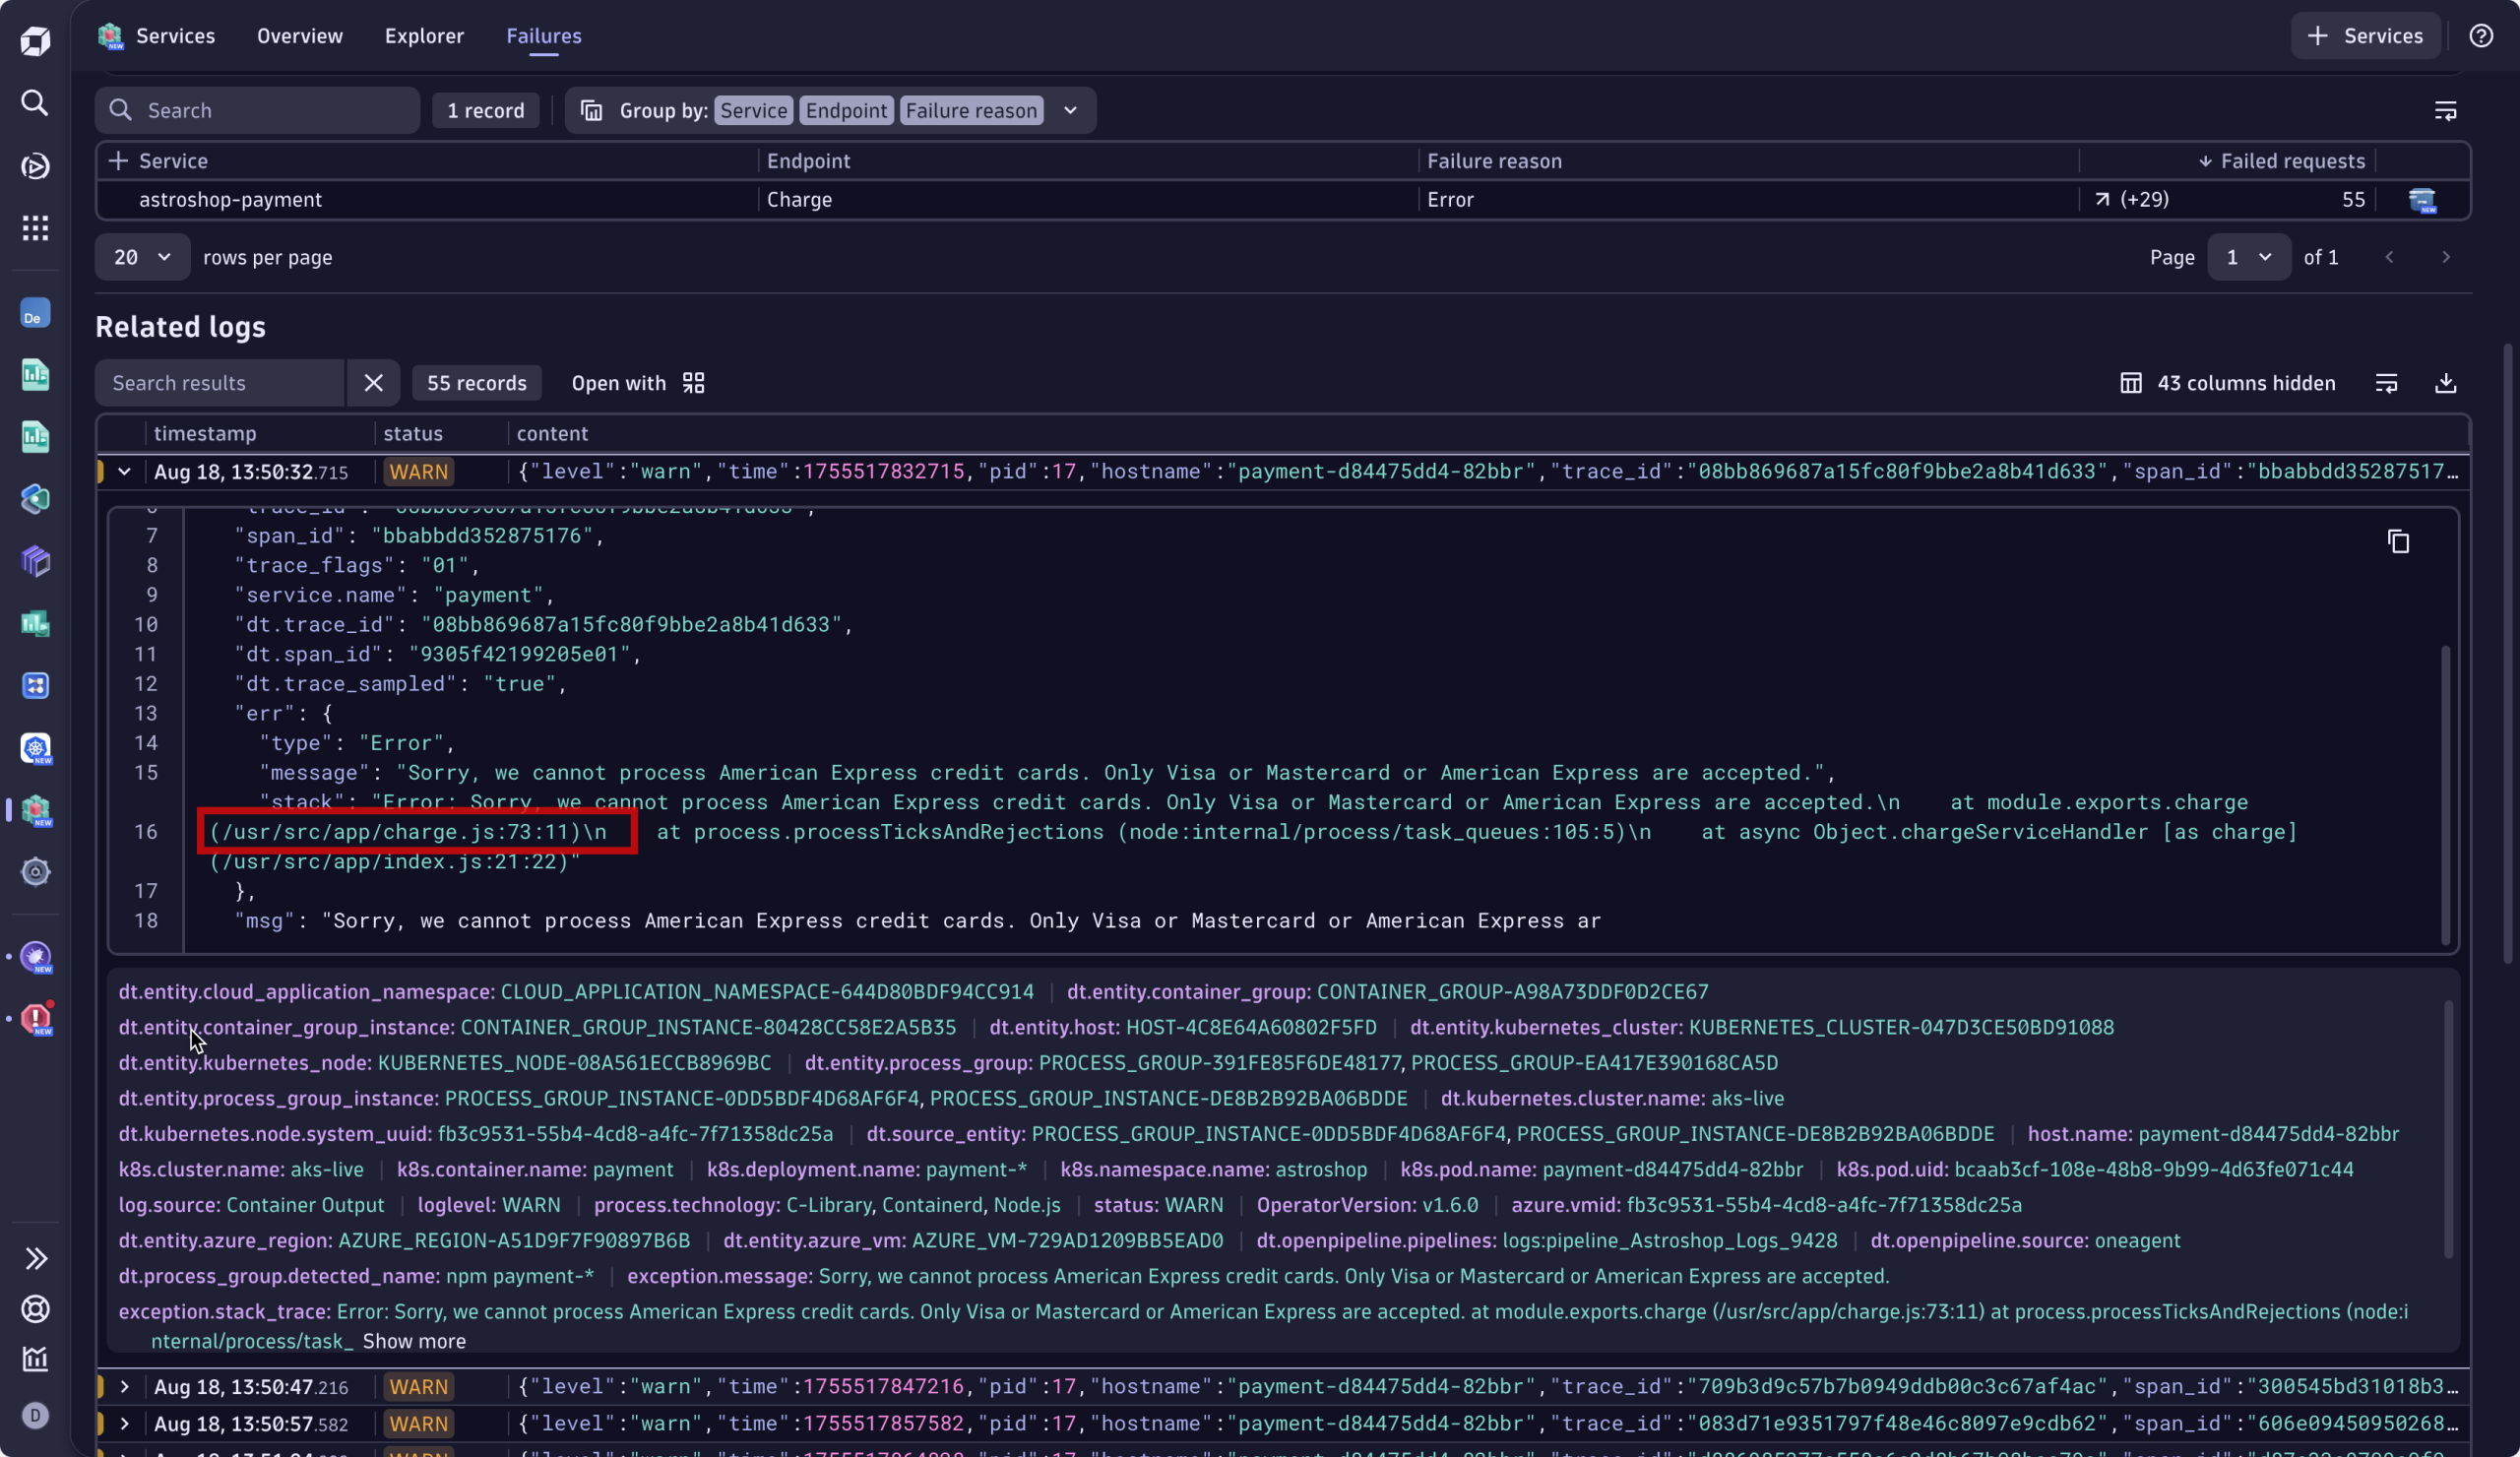
While guided through the next best course of action, Sophie chooses to analyze the failure further using the Services app. This opens problem mode, a visual assistive layer inside the Services app, scoped to the incident’s impact window. It pre-filters all logs, traces, and warnings based on:
- The scope of the incident
- The services and infrastructure involved
- Event severity and user impact
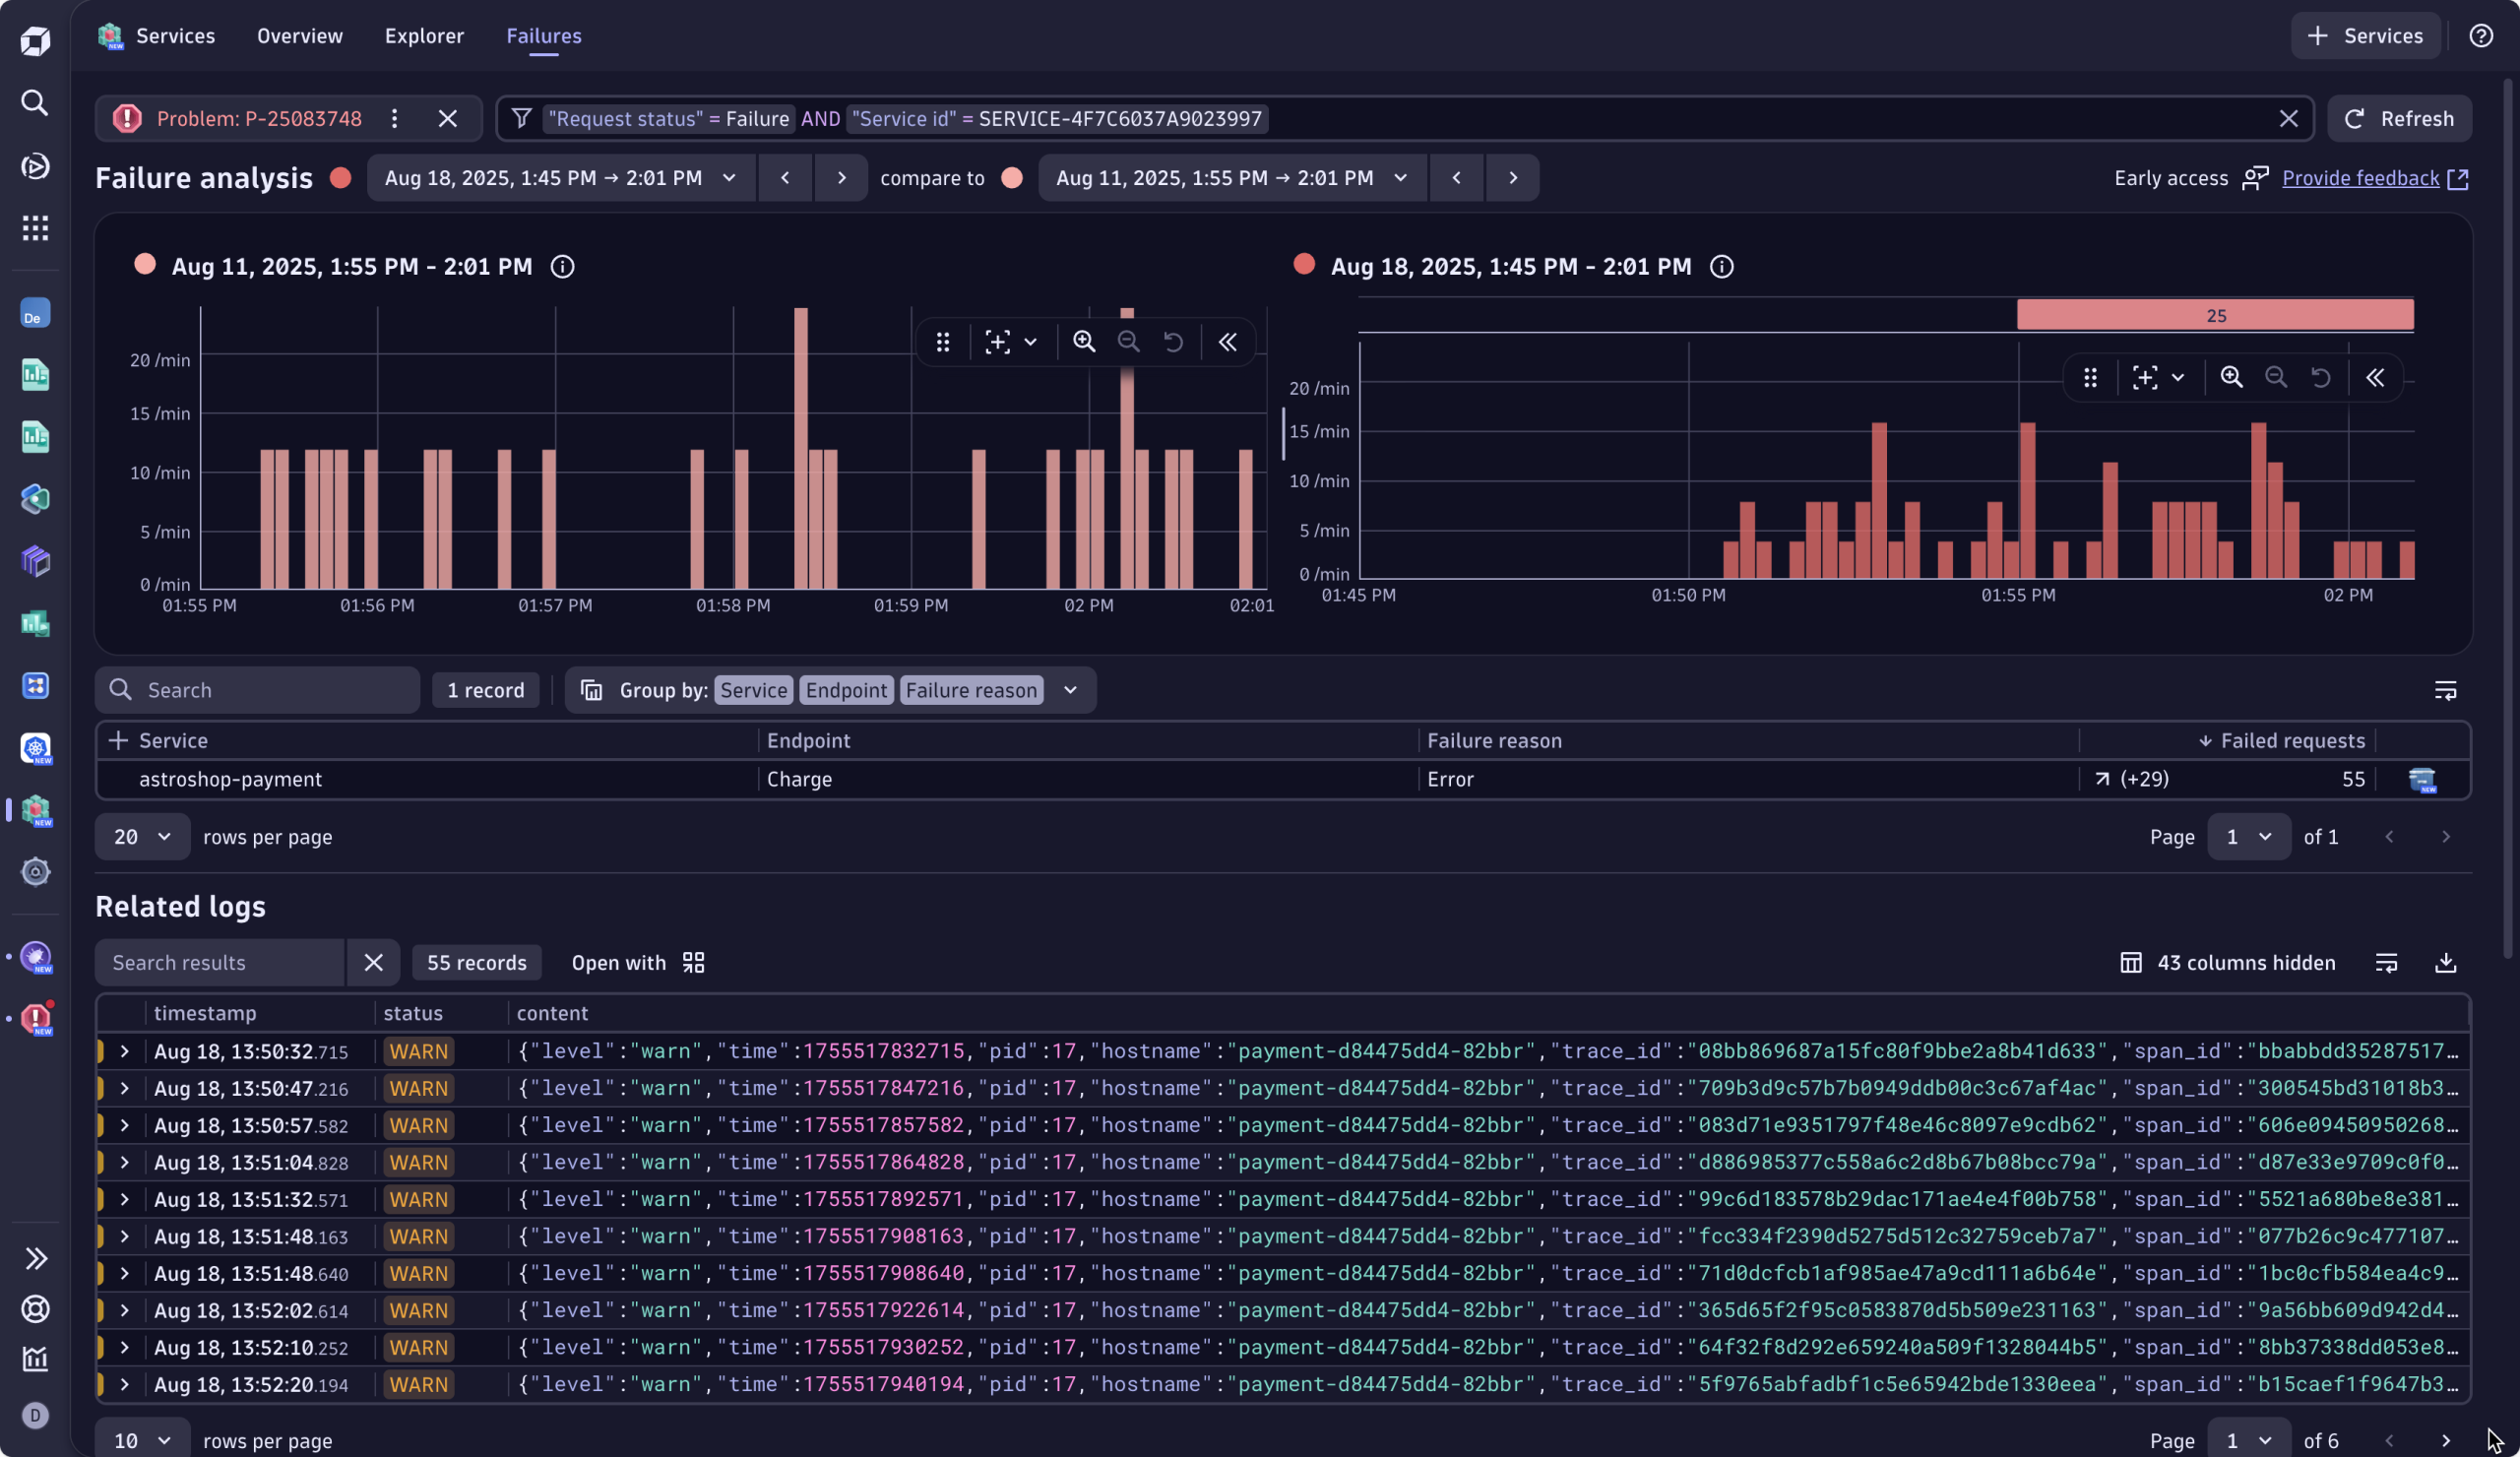
This view automatically prioritizes what matters, highlighting the signals that explain why the failure occurred, not just what broke. Instead of wrestling with contextless, stale, and unrelated logs, Sophie sees error logs and telemetry tied to the exact timeframe of the checkout errors. It cuts to the relevant error logs linked to the failure, including the exact error message. Sophie sees immediately that this is a bug in the code, specifically a JavaScript error at line 73.
Remediation: fix rapidly, validate instantly
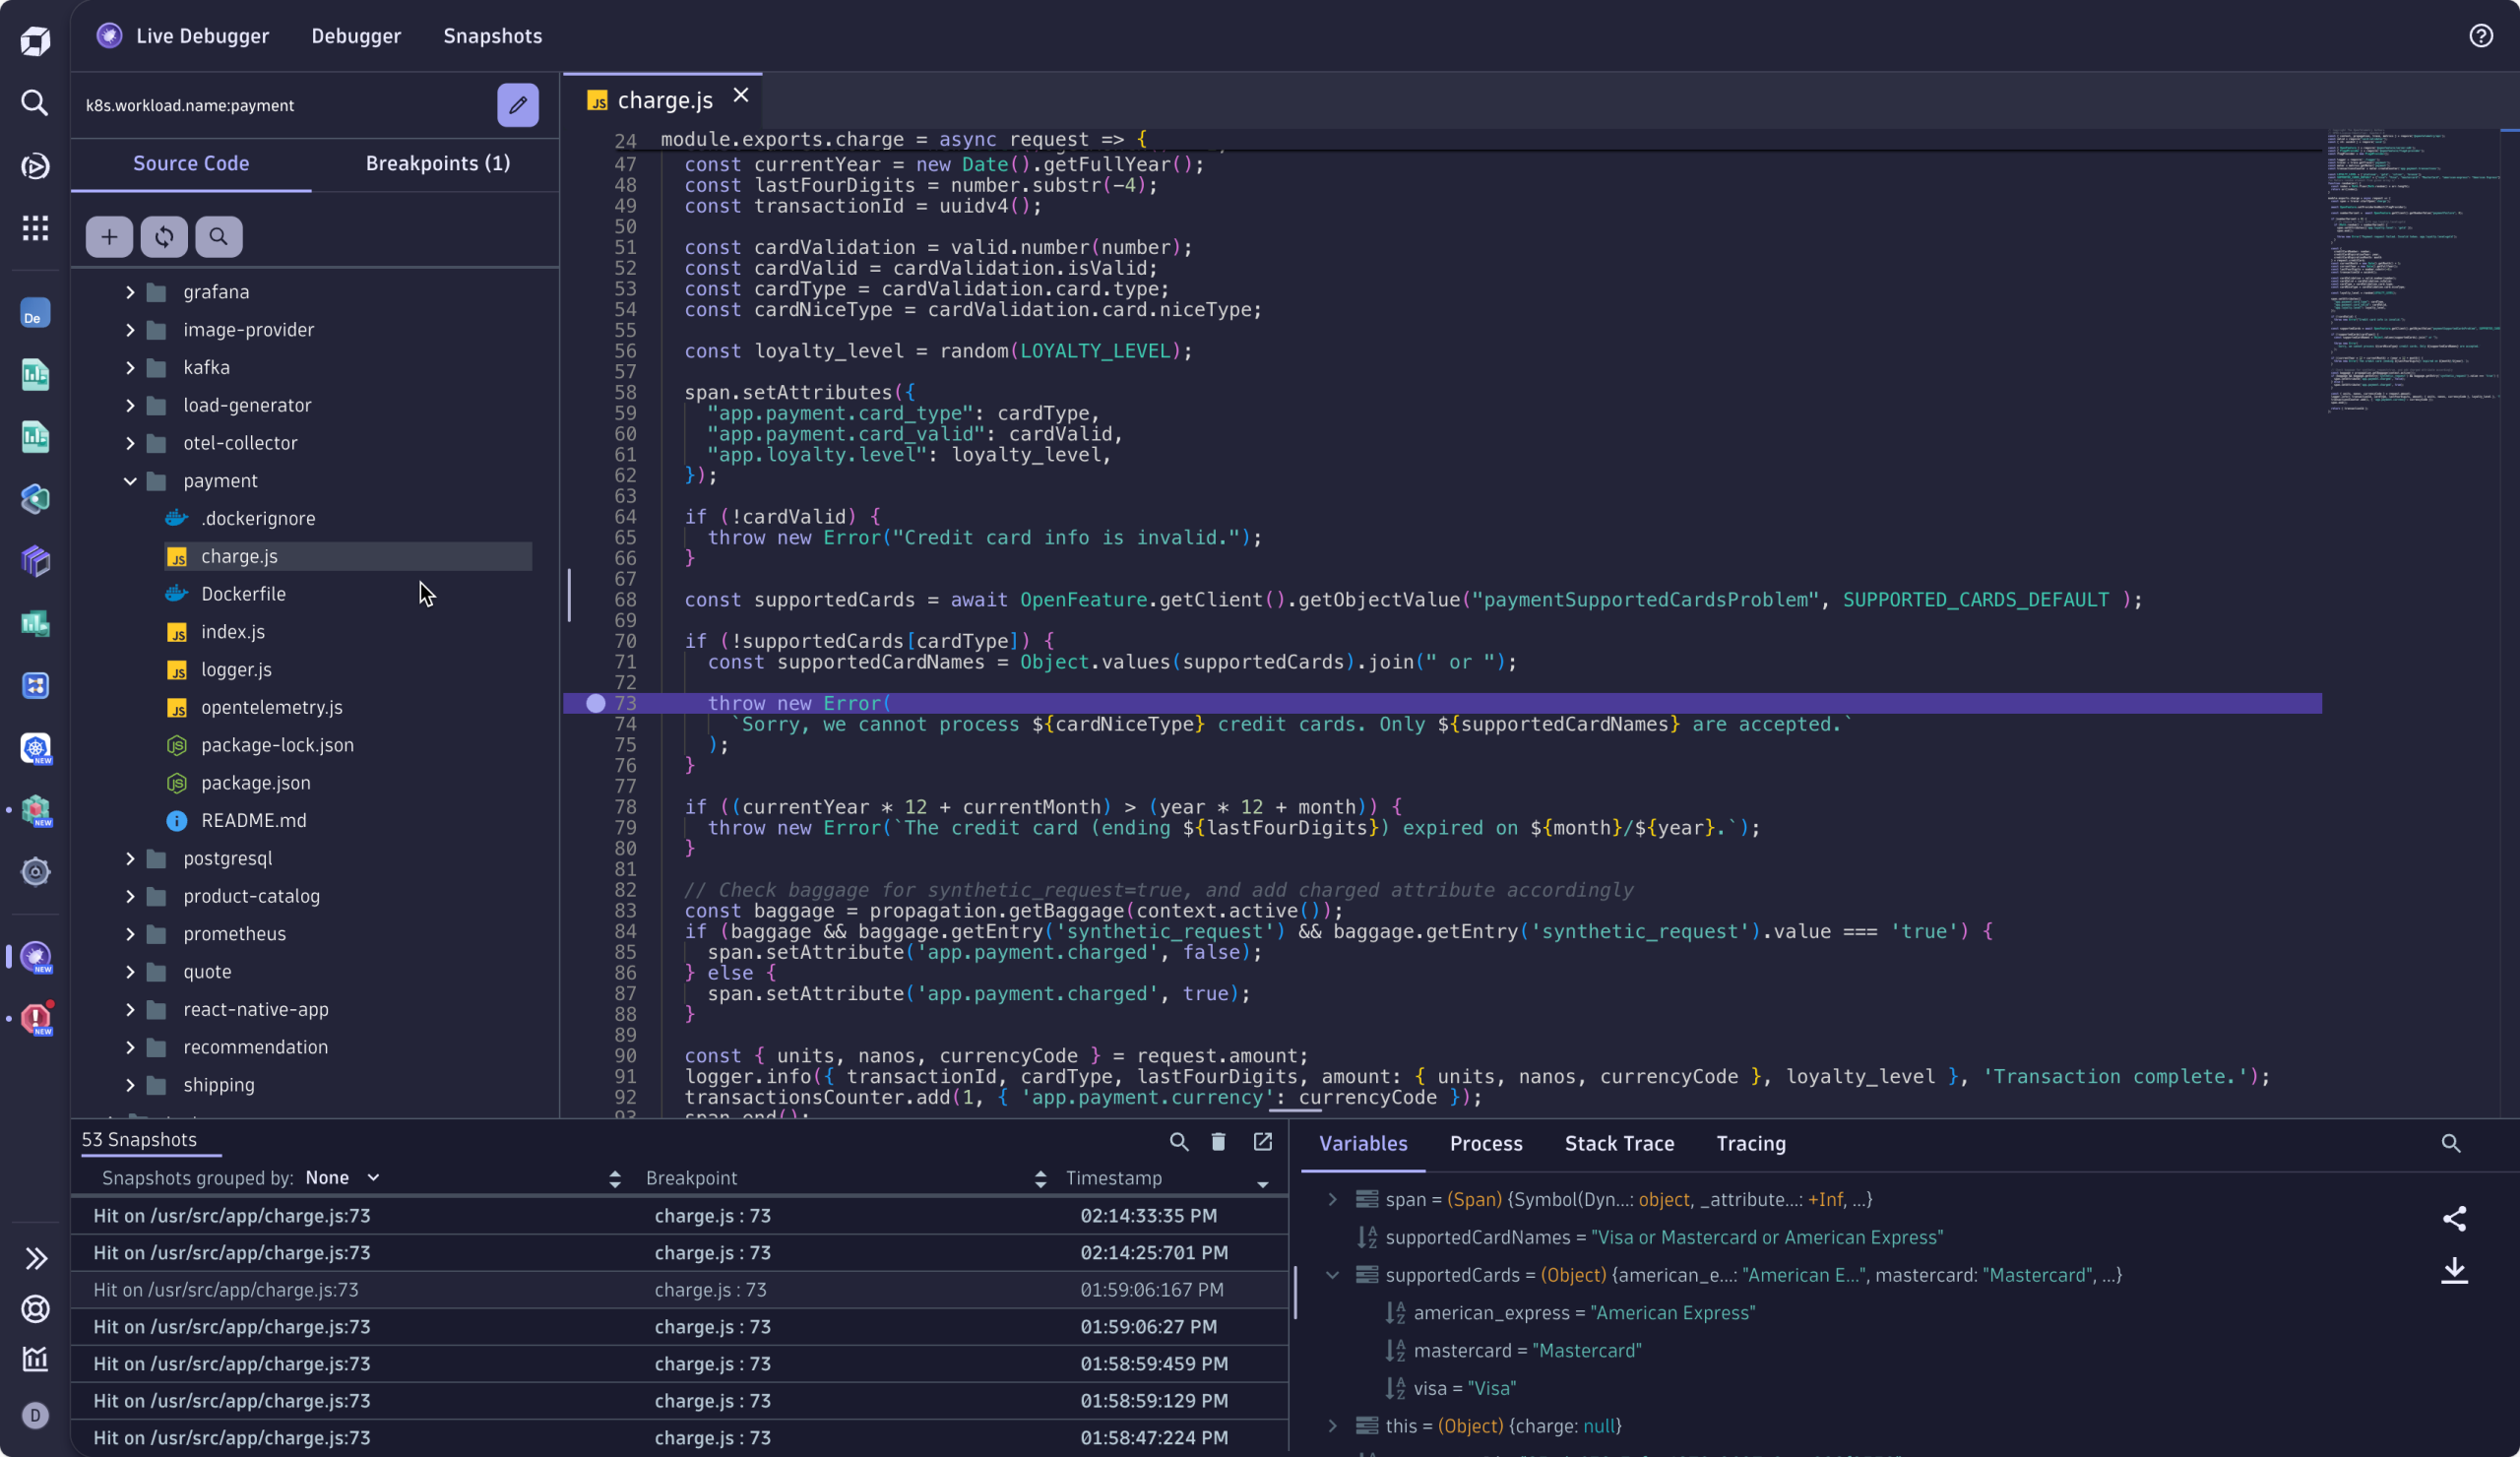
Sophie has enough context to fix the failure. She opens Dynatrace Live Debugger, navigates to where the error logs occurred, and sets a non-breaking breakpoint at line 22, where she knows the error originates. Once Live Debugger captures a snapshot, Sophie is able to quickly identify the culprit: a mismatched character, American-Express vs American_Express, is causing the checkout service to bounce.
Sophie patches the issue and deploys the fix. A couple of minutes later, when having a look at the business metrics dashboard, she validates the remediation action, observing in real-time that checkout failures are gone, and revenue is flowing again.
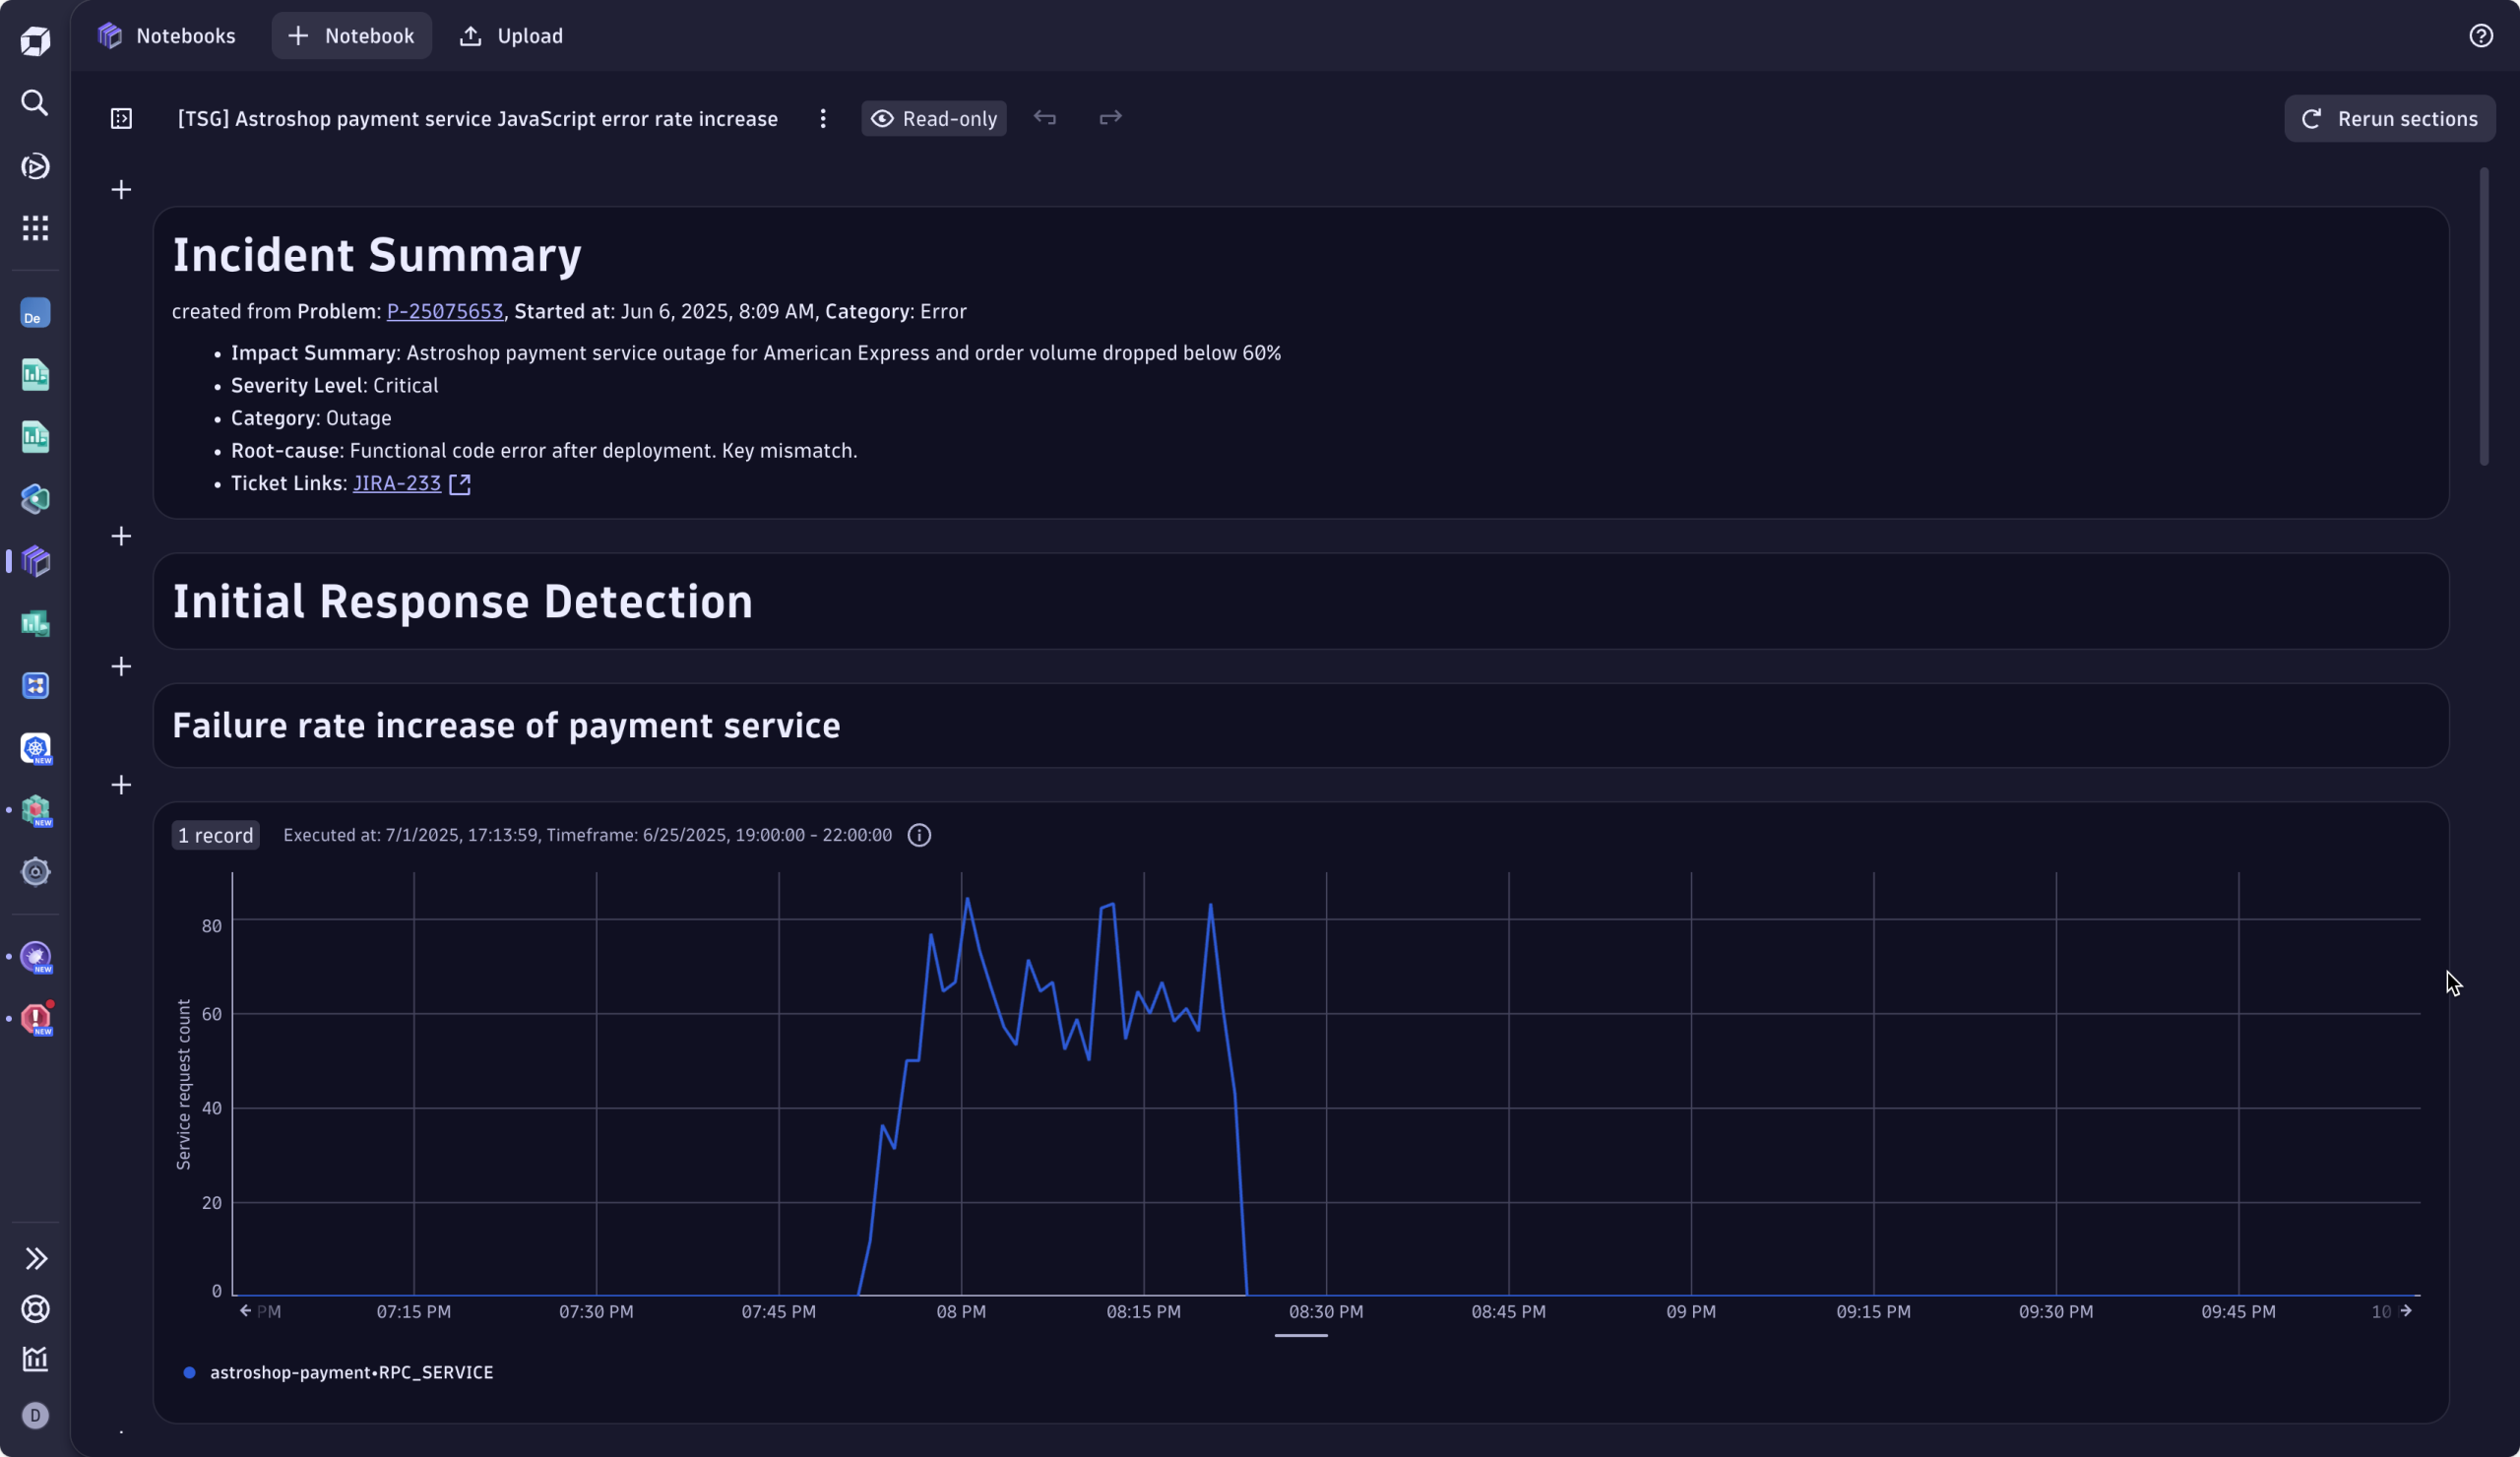
Document the issue for future reinforcement and learning
Once the fix is deployed, Sophie and Omar go to Troubleshooting in the problem details. Together, they jot down details of the errors and their cause: the key mismatch between American-Express and American_Express, and how it was resolved. Sophie adds the link to the dashboard she used for validation, next to the incident details, automatically prefilled by Davis® AI.
Once this is done, Dynatrace automatically
- Indexes the incident’s metadata and telemetry
- Prefills it with Incident details linked to the RCA
- Links it to similar incidents using graph-based AI and vector search
Weeks or months later, when a similar checkout spike appears, Dynatrace remediation intelligence automatically surfaces the relevant troubleshooting guide, providing necessary context and remediation guidance.
Rather than starting from scratch in the future, users benefit from a living knowledge base that not only accelerates problem resolution by reducing repeated investigation but turns every fix into team intelligence.
Try out the Dynatrace problem-remediation journey today
Dynatrace doesn’t just help you detect problems; it guides your teams calmly and confidently from >notification to resolution. Start now, eliminating repetitive war rooms, and try it out yourself:

Looking for answers?
Start a new discussion or ask for help in our Q&A forum.
Go to forum