We’re excited to announce the beta release of Dynatrace Hadoop monitoring! Hadoop server monitoring provides a high-level overview of main Hadoop components within your cluster. Enhanced insights are available for HDFS and MapReduce. Hadoop-specific metrics are presented alongside all infrastructure measurements, providing you with in-depth Hadoop performance analysis of both current and historical data.
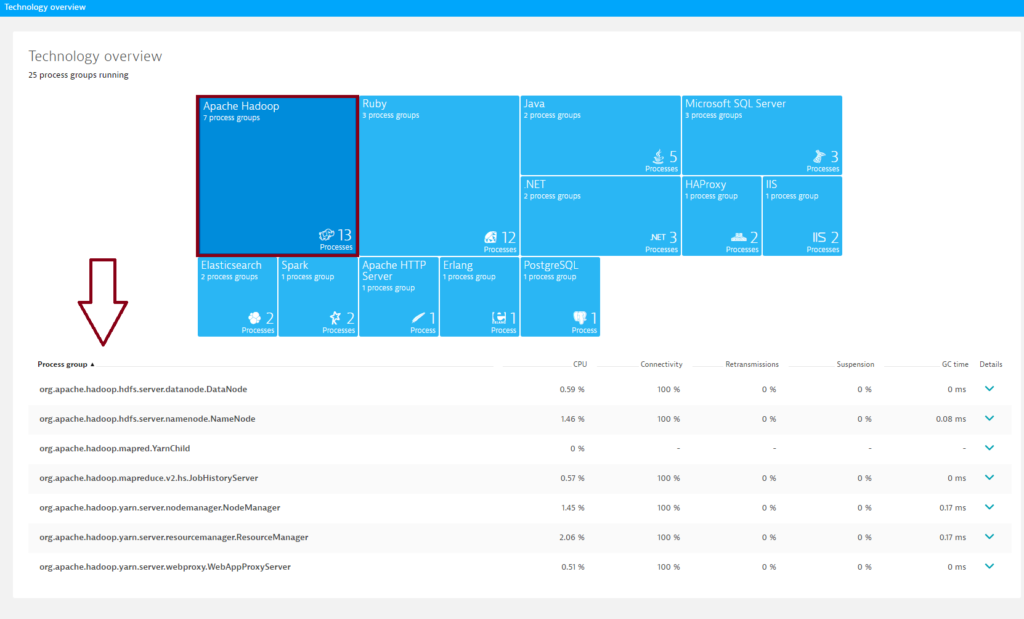
To analyze your Hadoop components
- Click Technologies in the menu.
- Click the Hadoop tile.
- Click an individual Hadoop component in the Process group list to view metrics and a timeline chart specific to that component.
Enhanced insights for HDFS
To view NameNode metrics
- Follow the steps outlined above. Be sure to select a NameNode process group.
- Click the Process group details button.
- On the Process group details page, select the Technology-specific metrics tab to view relevant cluster charts and metrics. Hadoop NameNode pages provide details about your HDFS capacity, usage, blocks, cache, files, and data-node health.
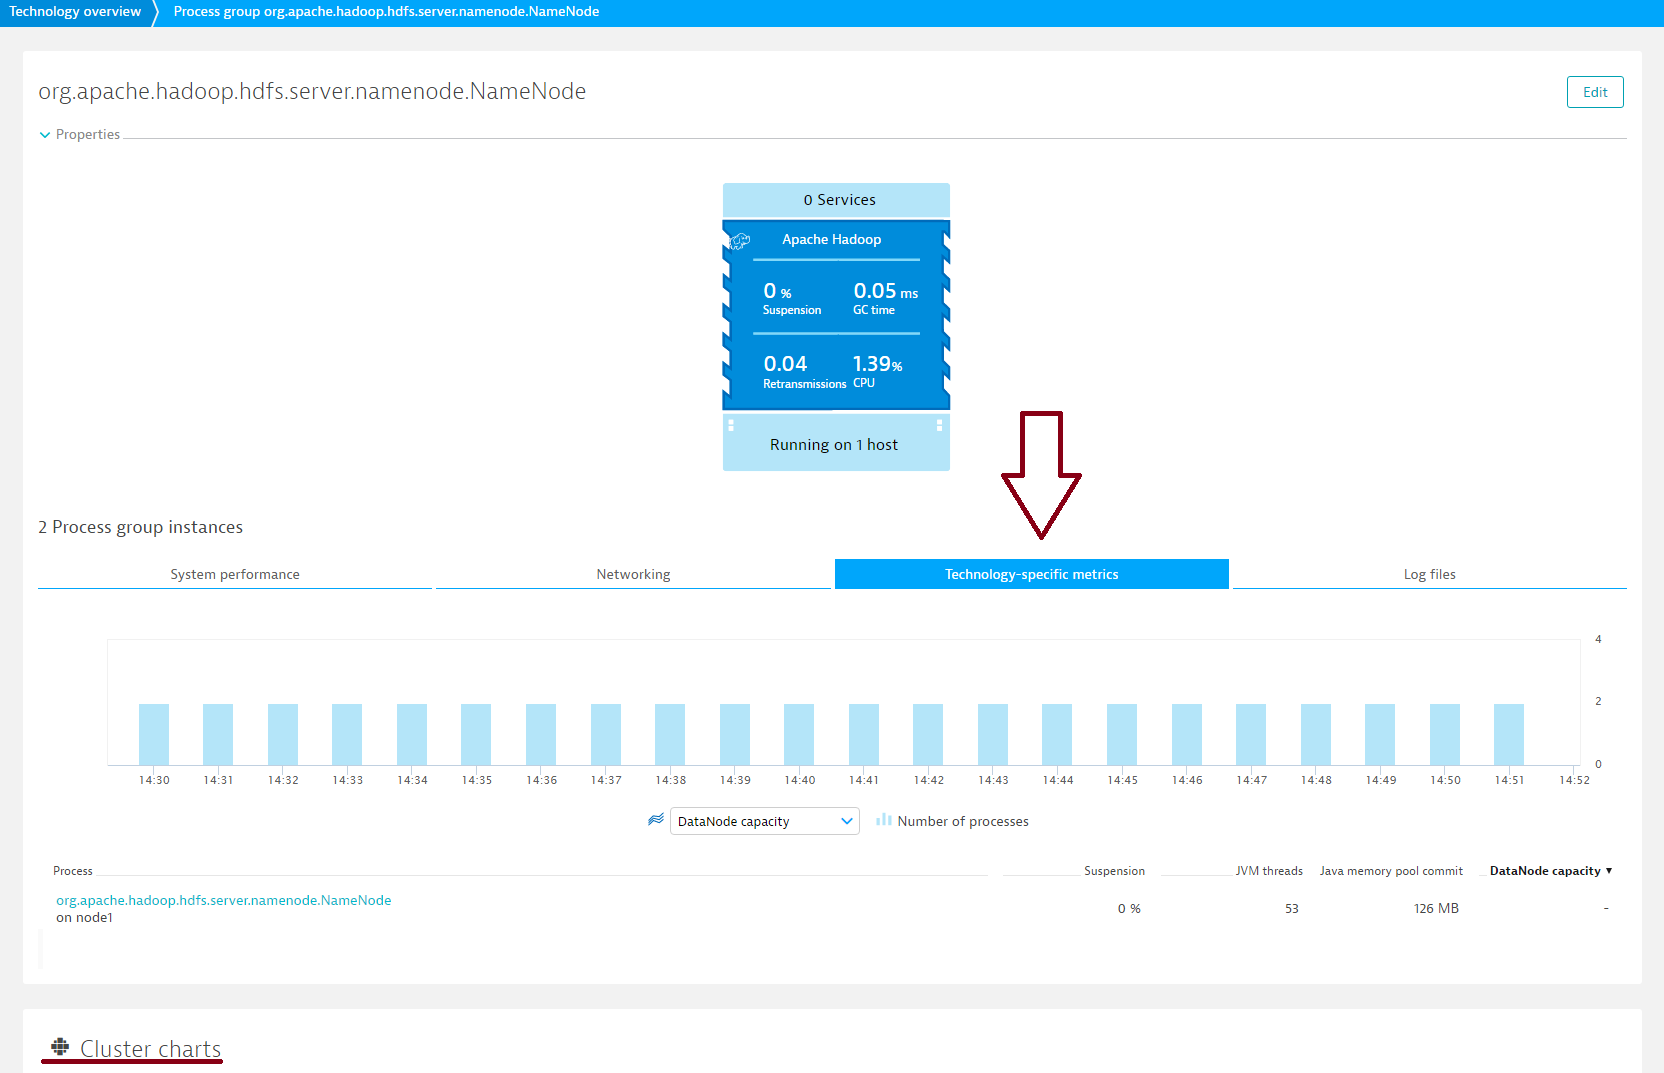
- Further down the page, you’ll find a number of cluster-specific charts.
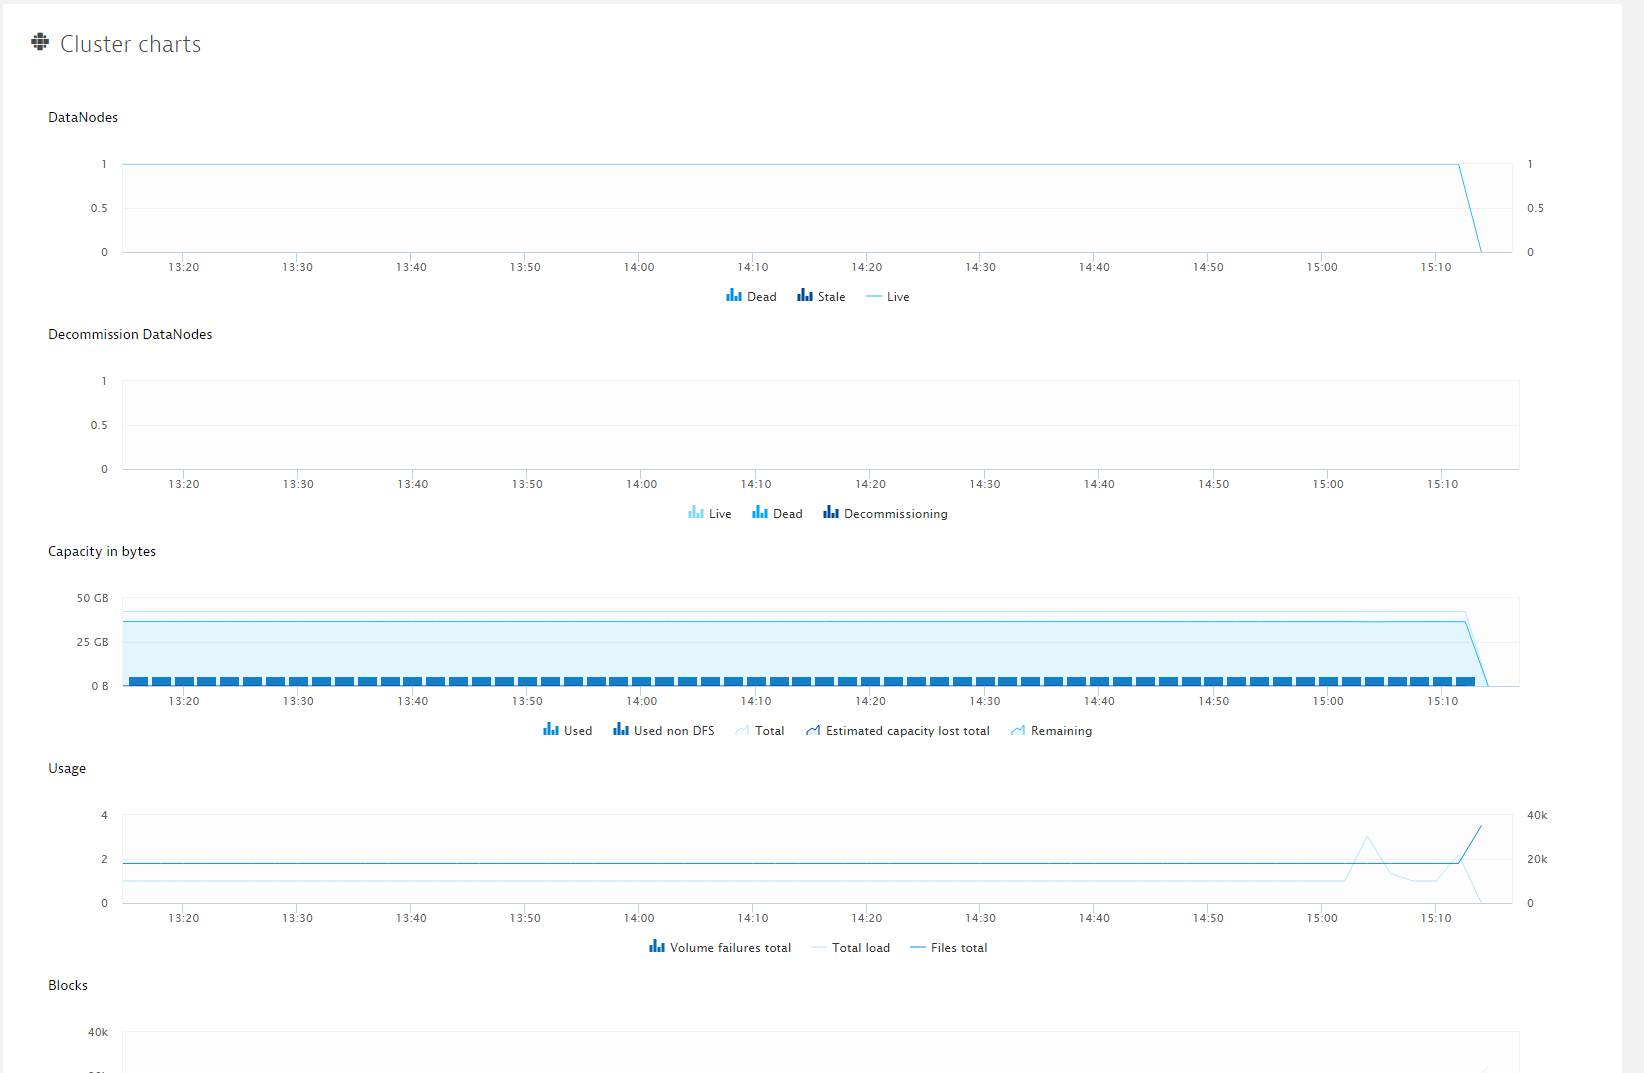
NameNode metrics
| Total |
Raw capacity of DataNodes in bytes |
| Used |
Used capacity across all DataNodes in bytes |
| Remaining |
Remaining capacity in bytes |
| Total load |
The number of connections |
| Total |
The number of allocated blocks in the system |
| Pending deletion |
The number of blocks pending deletion |
| Files total |
Total number of files |
| Pending replication |
The number of blocks pending to be replicated |
| Under replicated |
The number of under-replicated blocks |
| Scheduled replication |
The number of blocks scheduled for replication |
| Live |
The number of live DataNodes |
| Dead |
The number of dead DataNodes |
| Decommission Live |
The number of decommissioning live DataNodes |
| Decommission Dead |
The number of decommissioning dead DataNodes |
| Usage – Volume failures total |
Total volume failures |
| Estimated capacity lost total |
Estimated capacity lost in bytes |
| Decommission Decommissioning |
The number of decommissioning data DataNodes |
| Stale |
The number of stale DataNodes |
| Blocks missing and corrupt – Missing |
The number of missing blocks |
| Capacity |
Cache capacity in bytes |
| Used |
Cache used in bytes |
| Blocks missing and corrupt – Corrupt |
The number of corrupt blocks |
| Capacity in bytes – Used, non-DFS |
Capacity used, non-DFS in bytes |
| Appended |
The number of files appended |
| Created |
The number of files and directories created by create or mkdir operations |
| Deleted |
The number of files and directories deleted by delete or rename operations |
| Renamed |
The number of rename operations |
To view DataNode metrics
- To view DataNode metrics, expand the Details section of a DataNode process group.
- Click the Process group details button.
- On the Process group details page, click the Technology-specific metrics tab and select the DataNode.
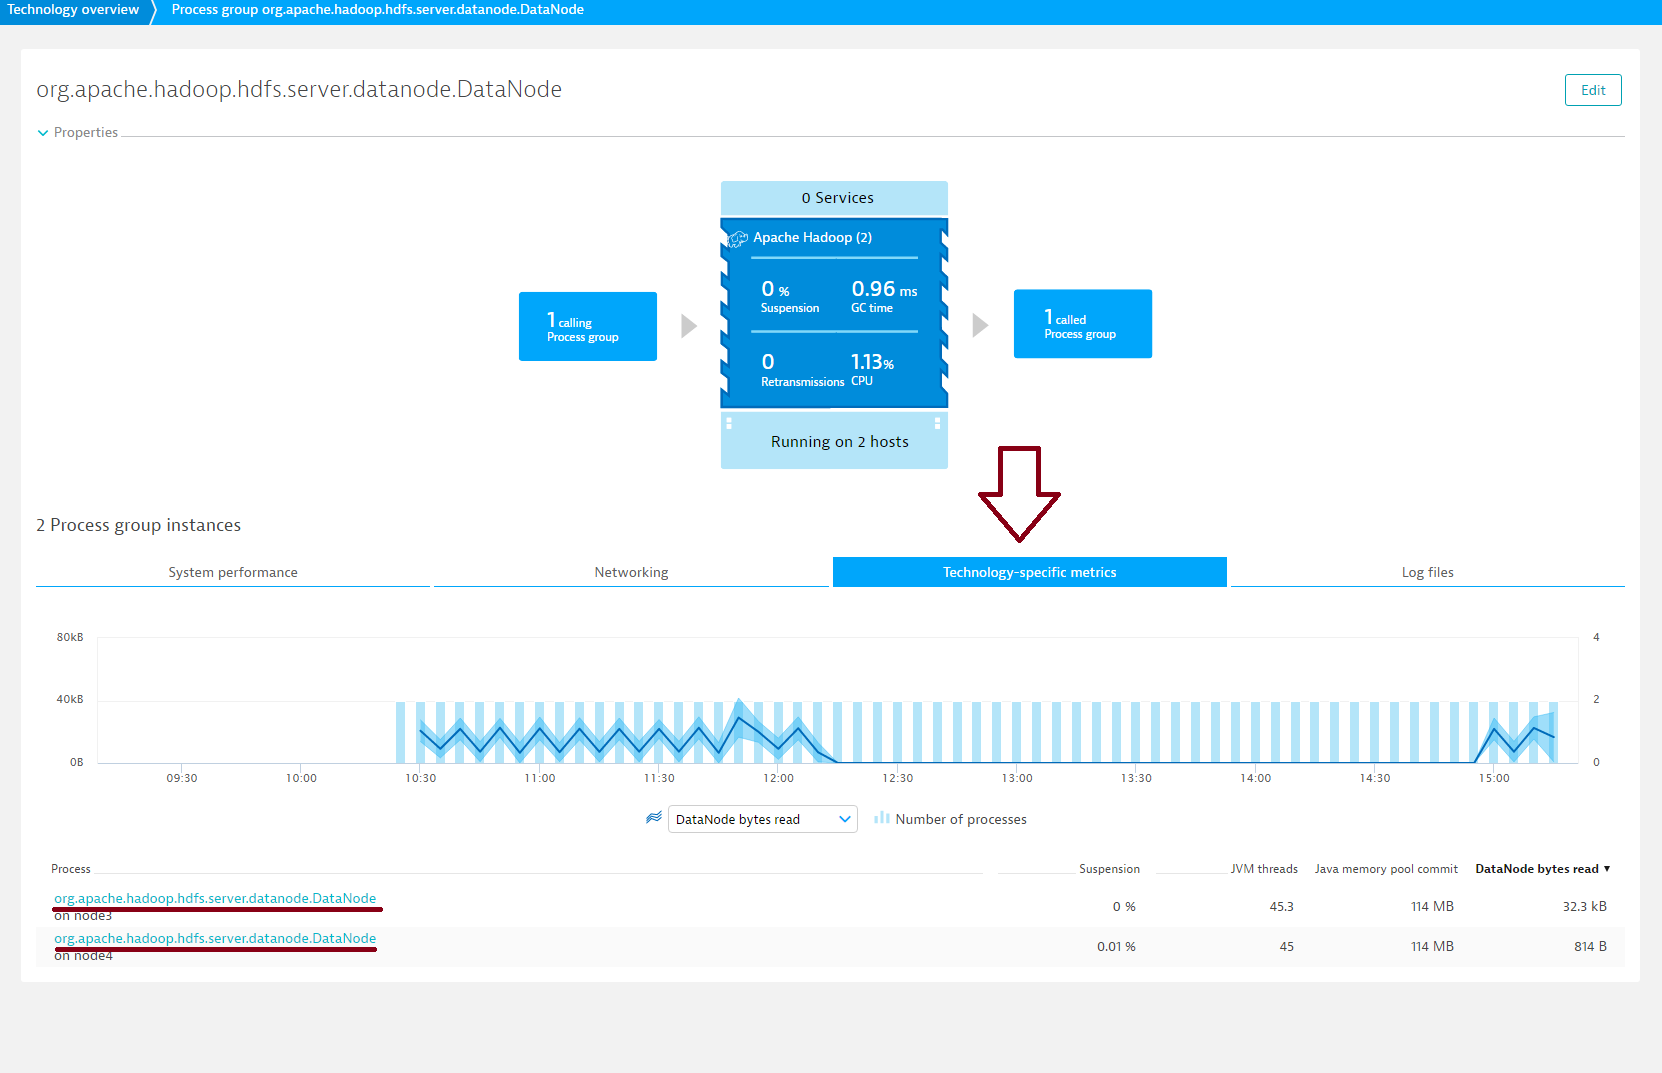
- Select the Hadoop HDFS metrics tab
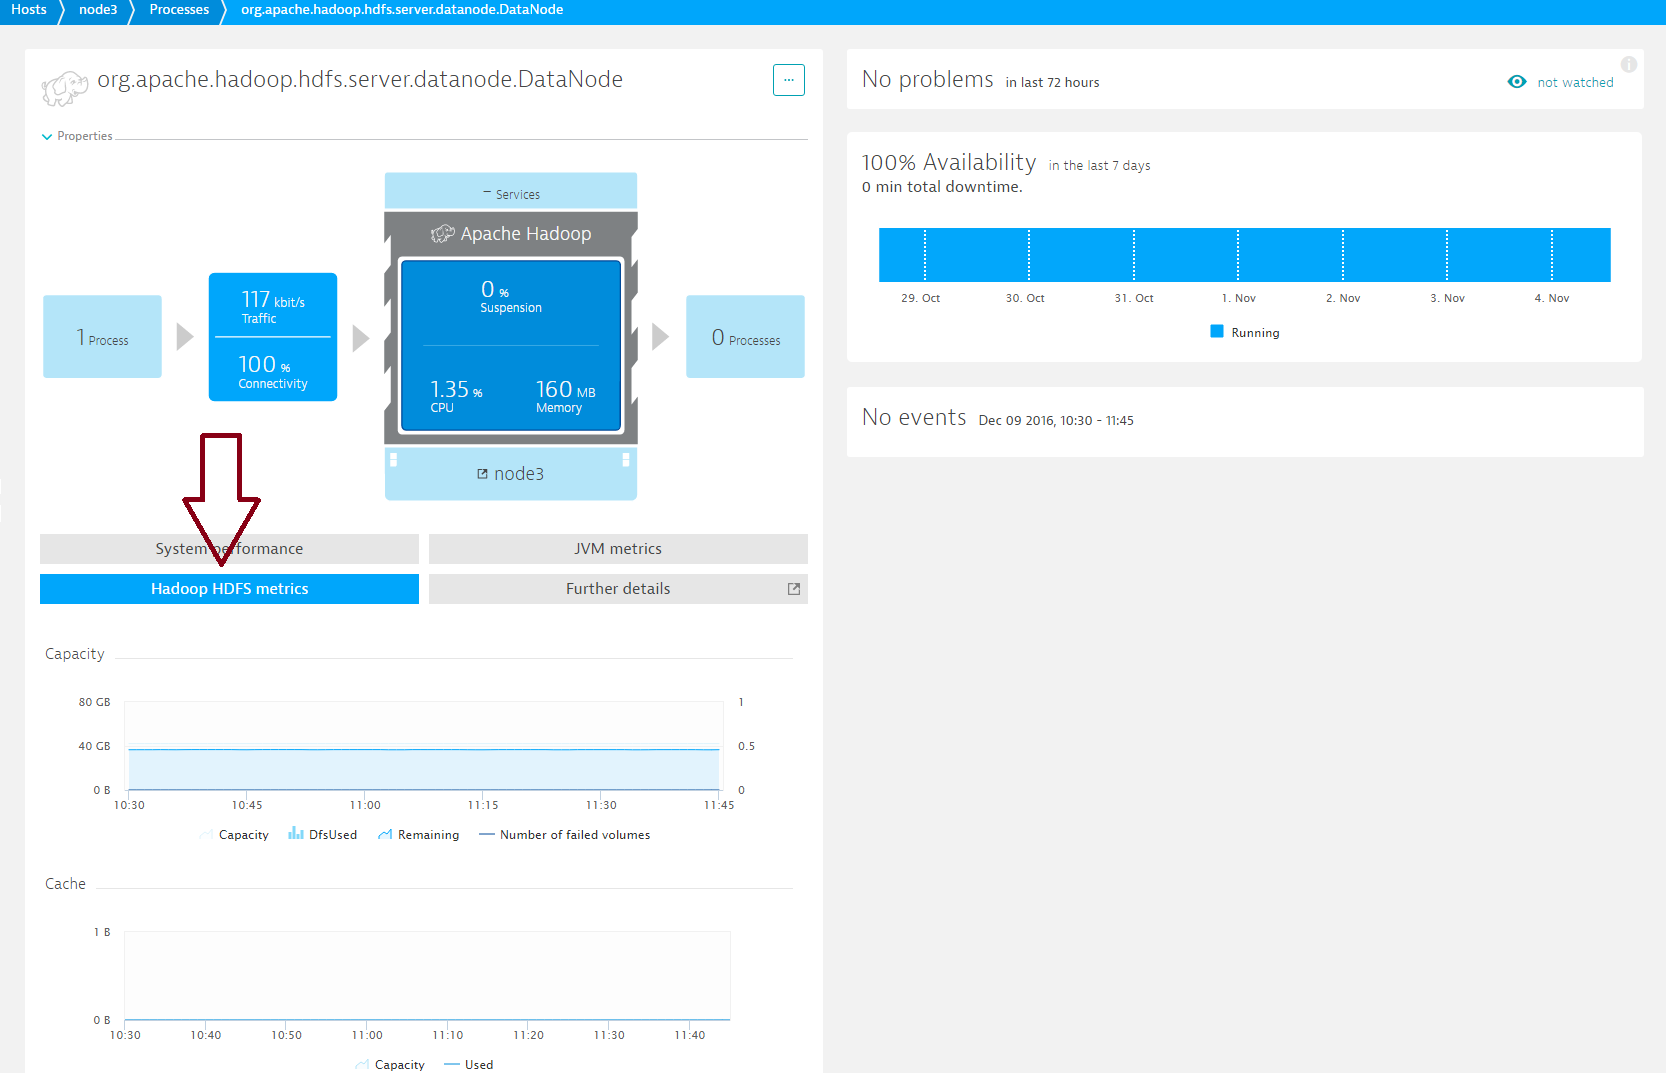
DataNode metrics
| Live |
The number of live DataNodes |
| Dead |
The number of dead DataNodes |
| Decommission Live |
The number of decommissioning live DataNodes |
| Decommission Dead |
The number of decommissioning dead DataNodes |
| Decommission Decommissioning |
The number of decommissioning data DataNodes |
| Stale |
The number of stale DataNodes |
| Capacity |
Cache capacity in bytes |
| Used |
Cache used in bytes |
| Capacity |
Disk capacity in bytes |
| DfsUsed |
Disk usage in bytes |
| Cached |
The number of blocks cached |
| Failed to cache |
The number of blocks that failed to cache |
| Failed to uncache |
The number of blocks that failed to remove from cache |
| Number of failed volumes |
The number of volume failures occurred |
| Capacity in bytes – Remaining |
The remaining disk space left in bytes |
| Blocks |
The number of blocks read from DataNode |
| Removed |
The number of blocks removed |
| Replicated |
The number of blocks replicated |
| Verified |
The number of blocks verified |
| Blocks |
The number of blocks written to DataNode |
| Bytes |
The number of bytes read from DataNode |
| Bytes |
The number of bytes written to DataNode |
Enhanced insights for MapReduce
To view ResourceManager metrics
- To view ResourceManager metrics, expand the Details section of the ResourceManager process group.
- Click the Process group details button.
- On the Process group details page, select the Technology-specific metrics tab to view relevant cluster charts and metrics. Hadoop ResourceManager metrics pages provide information about your nodes, applications, memory, cores, and containers.
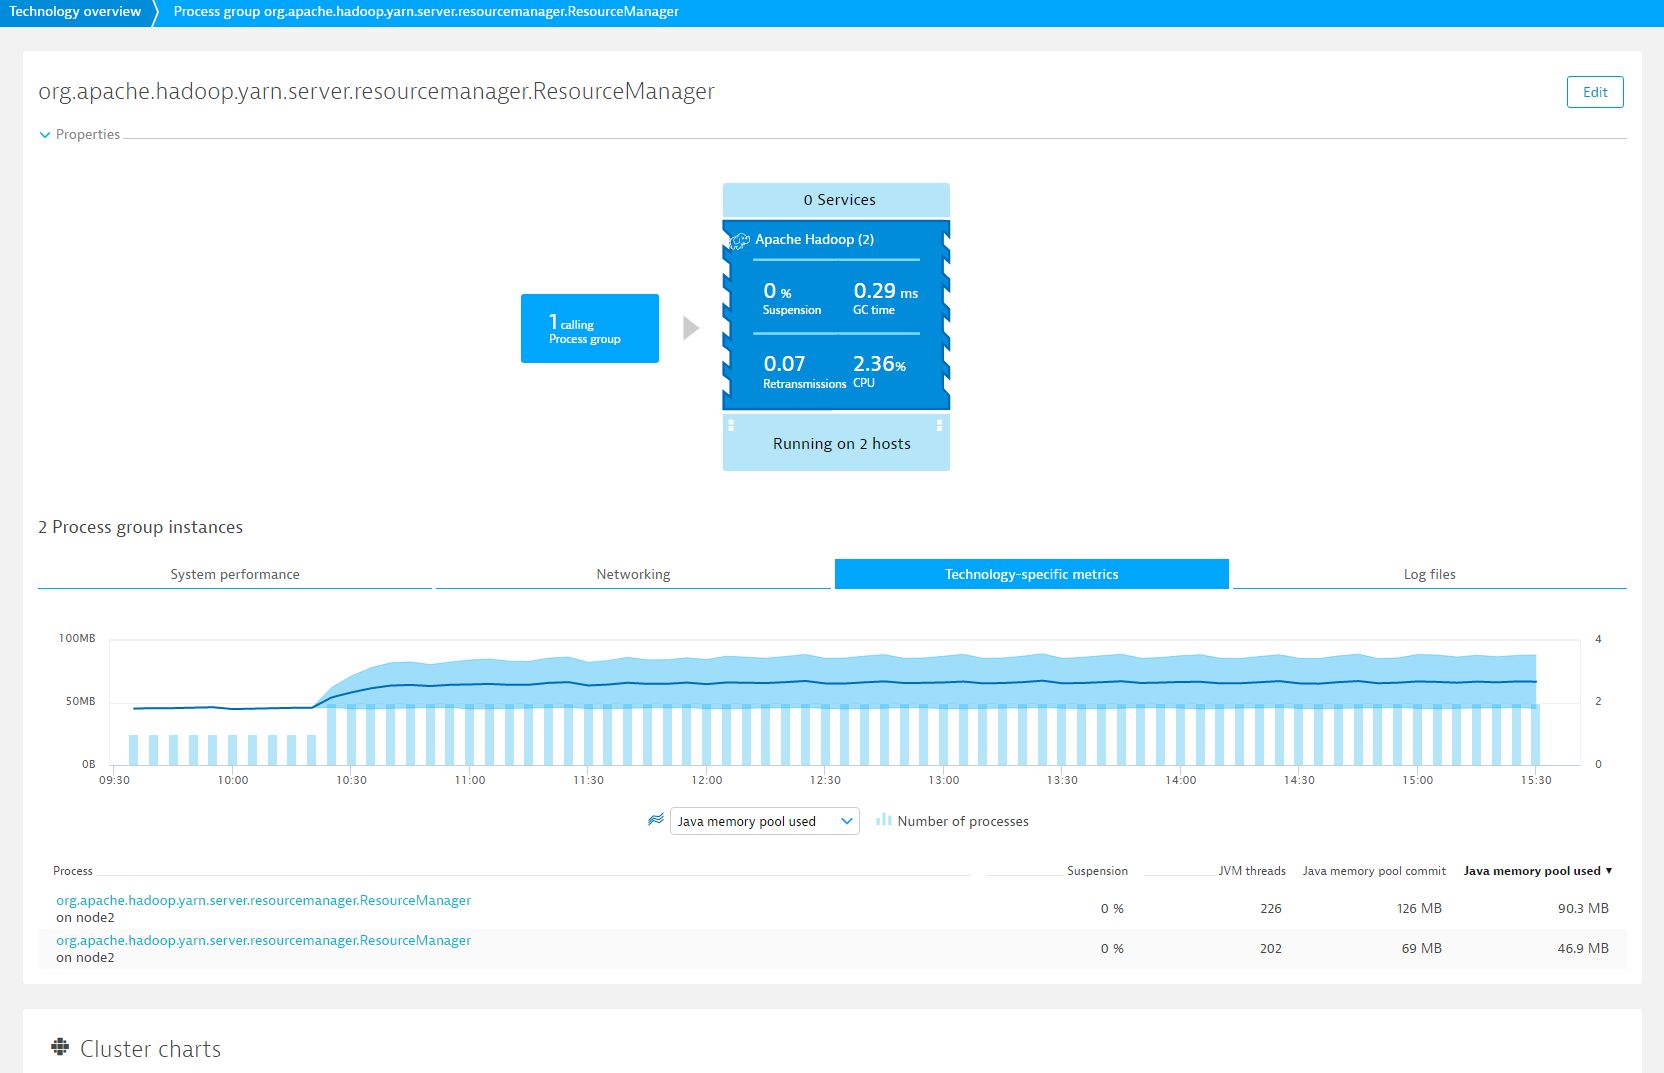
- Further down the page, you’ll find a number of ResourceManager-specific charts.
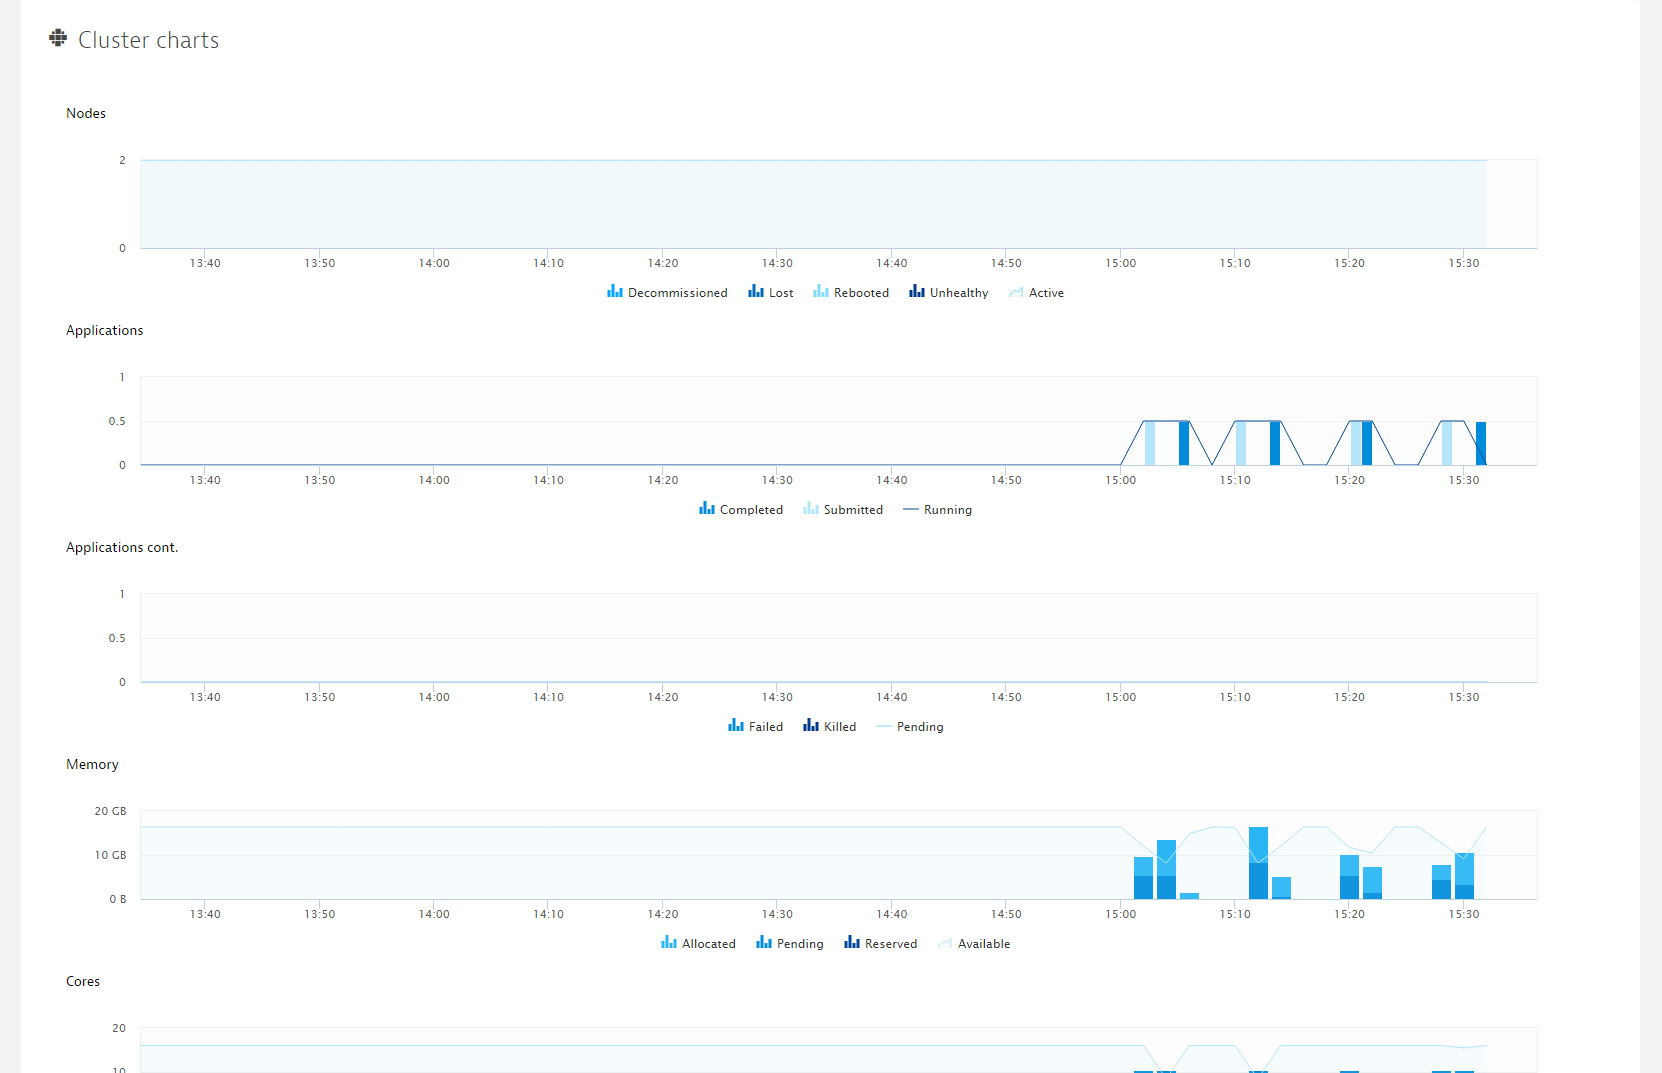
ResourceManager metrics
| Active |
Number of active NodeManagers |
| Decommissioned |
Number of decommissioned NodeManagers |
| Lost |
Number of lost NodeManagers – no heartbeats |
| Rebooted |
Number of rebooted NodeManagers |
| Unhealthy |
Number of unhealthy NodeManagers |
| Allocated |
Number of allocated containers |
| Allocated |
Allocated memory in bytes |
| Allocated |
Number of allocated CPU in virtual cores |
| Completed |
Number of successfully completed applications |
| Failed |
Number of failed applications |
| Killed |
Number of killed applications |
| Pending |
Number of pending applications |
| Running |
Number of running applications |
| Submitted |
Number of submitted applications |
| Available |
Amount of available memory in bytes |
| Available |
Numberof available CPU in virtual cores |
| Pending |
Amount of pending memory resource requests in bytes that are not yet fulfilled by the scheduler |
| Pending |
Pending CPU allocation requests in virtual cores that are not yet fulfilled by the scheduler |
| Reserved |
Amount of reserved memory in bytes. |
| Reserved |
Number of reserved CPU in virtual cores |
To view MRAppMaster metrics
- To view MRAppMaster metrics, expand the Details section of an MRAppMaster process group.
- Click the Process group details button.
- On the Process group details page, click the Technology-specific metrics tab and select the MRAppMaster process.
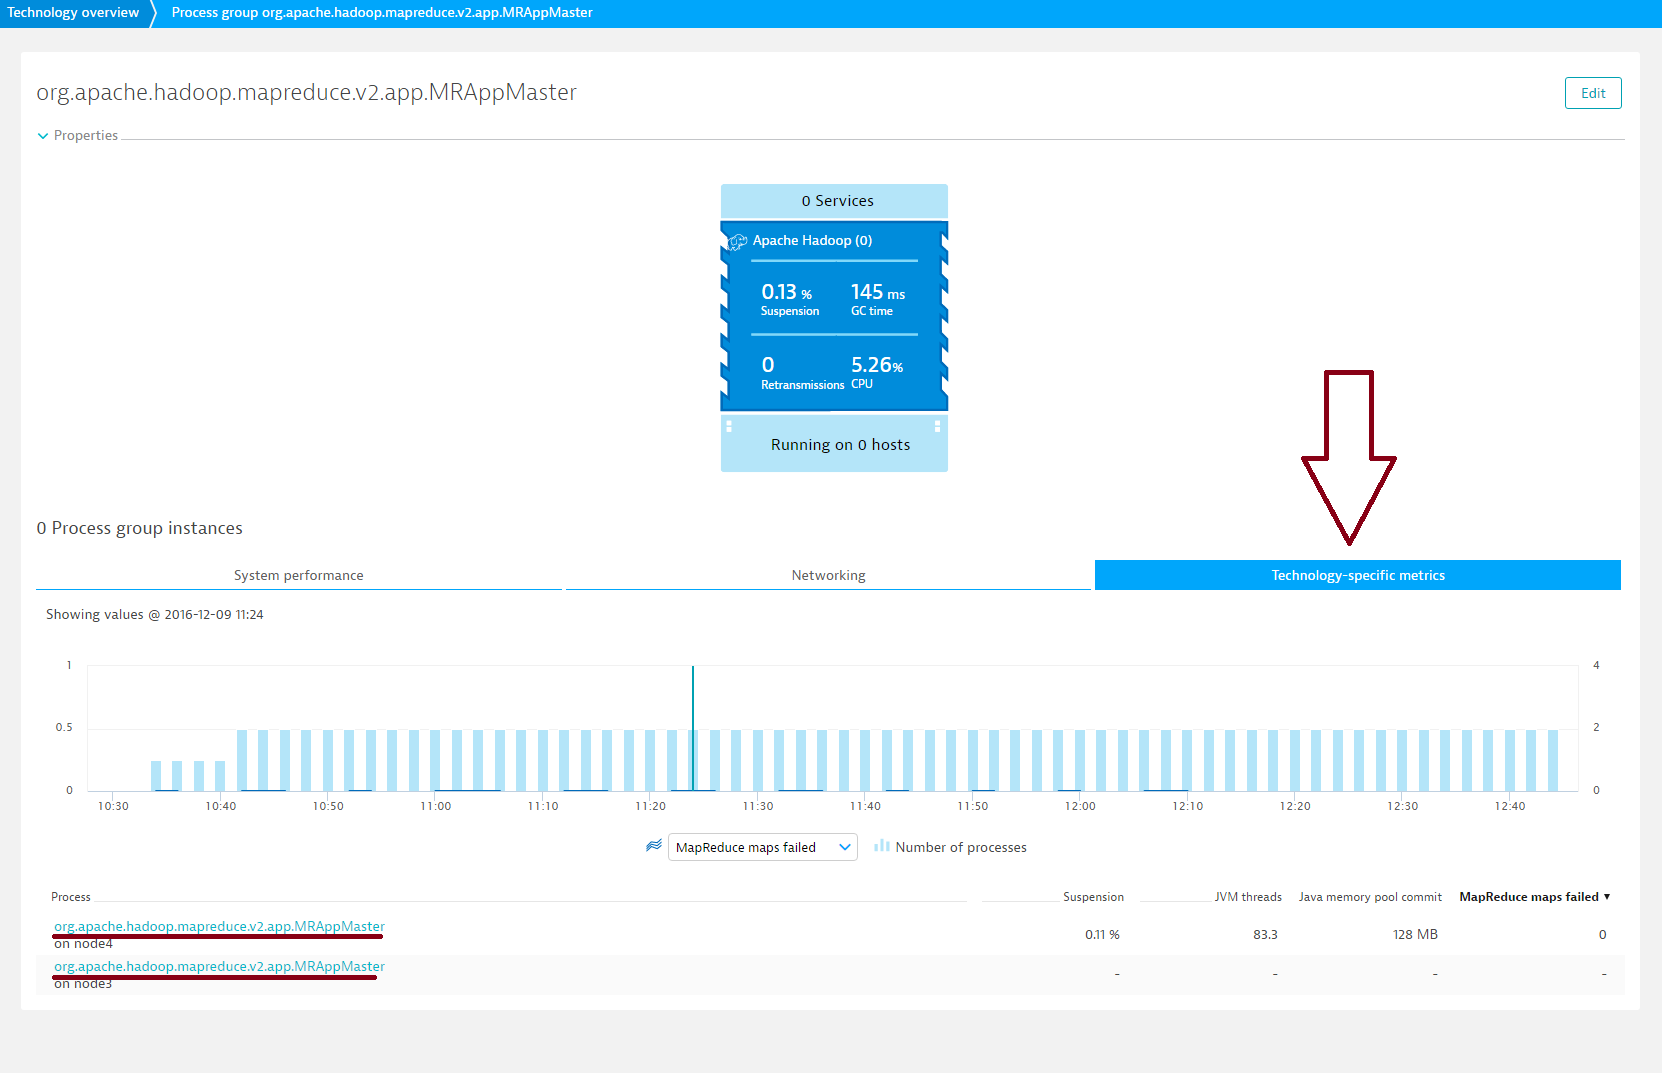
- Click the Hadoop MapReduce tab.
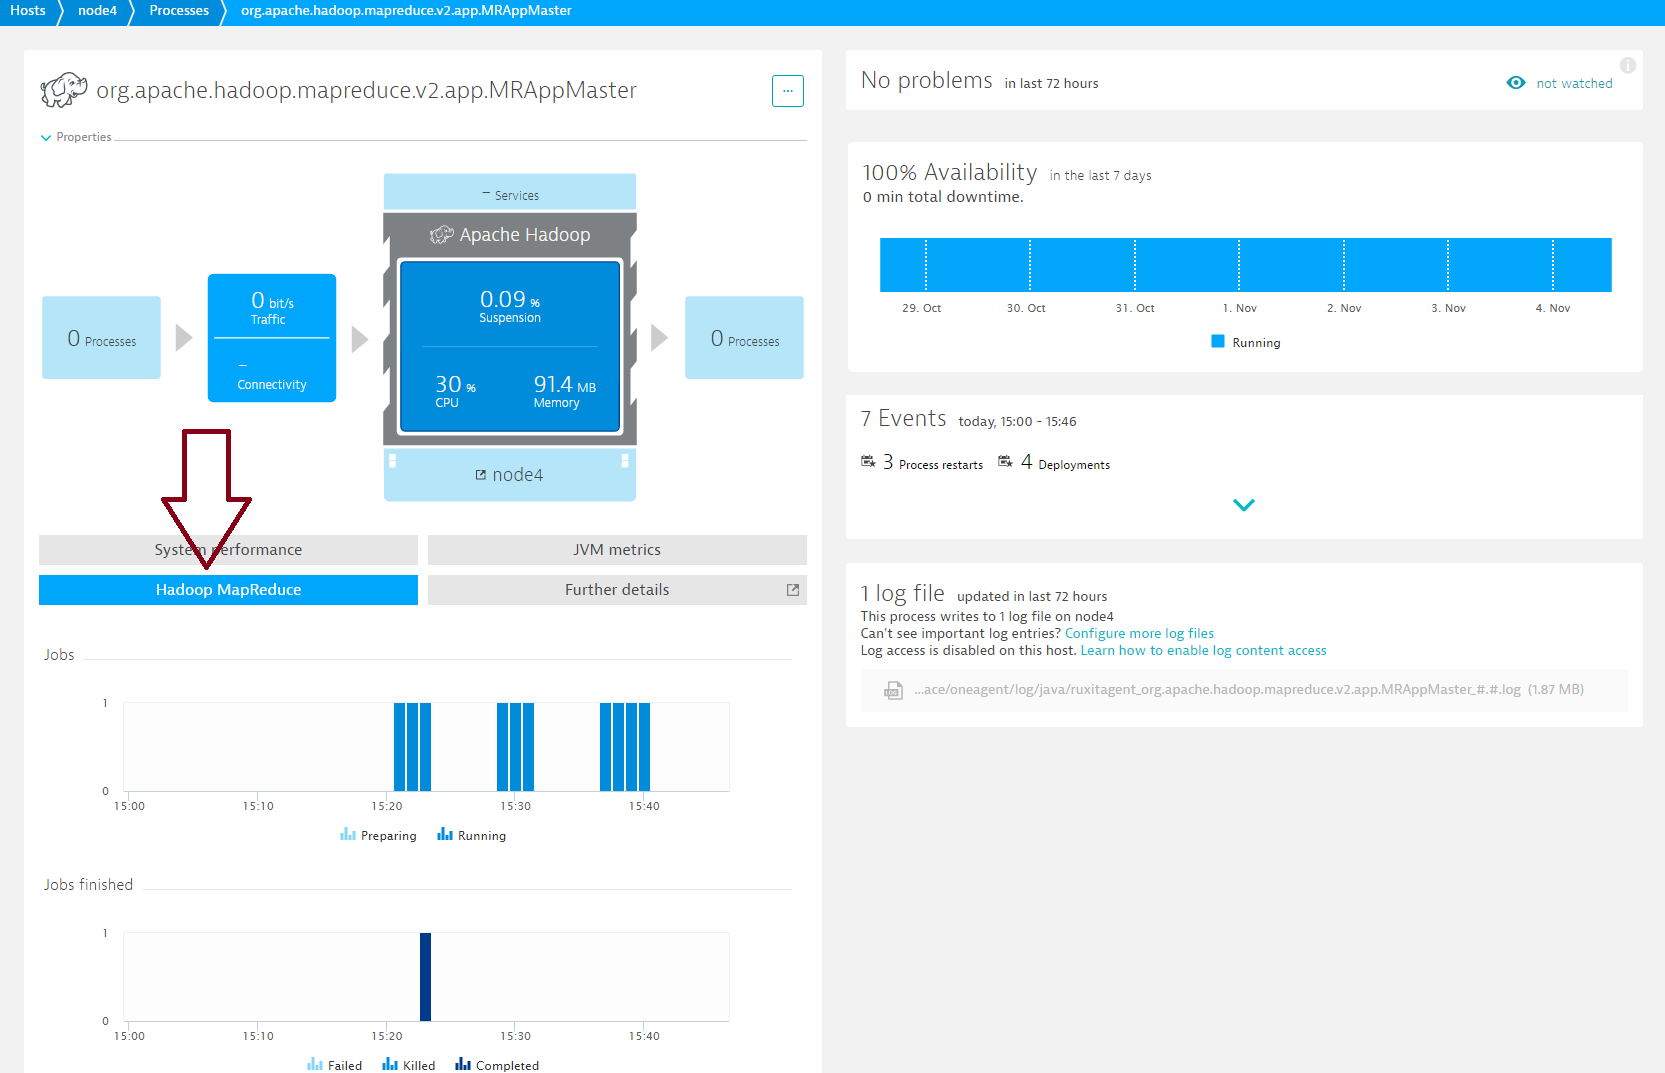
MRAppMaster metrics
| Jobs finished – Completed |
The number of successfully completed jobs |
| Jobs finished – Failed |
The number of failed jobs |
| Jobs finished – Killed |
The number of killed jobs |
| Jobs – Preparing |
The number of preparing jobs |
| Jobs – Running |
The number of running jobs |
| Maps finished – Completed |
The number of successfully completed maps |
| Maps finished – Failed |
The number of failed maps |
| Maps finished – Killed |
The number of killed maps |
| Maps – Running |
The number of running maps |
| Maps – Waiting |
The number of waiting maps |
| Reduces finished – Completed |
The number of successfully completed reduces |
| Reduces finished – Failed |
The number of failed reduces |
| Reduces finished – Killed |
The number of killed reduces |
| Reduces – Running |
The number of running reduces |
| Reduces – Waiting |
The number of waiting reduces |
To view NodeManager metrics
- To view NodeManager metrics, expand the Details section of the NodeManager manager process group.
- Click the Process group details button.
- On the Process group details page, click the Technology-specific metrics tab and select a NodeManager process.
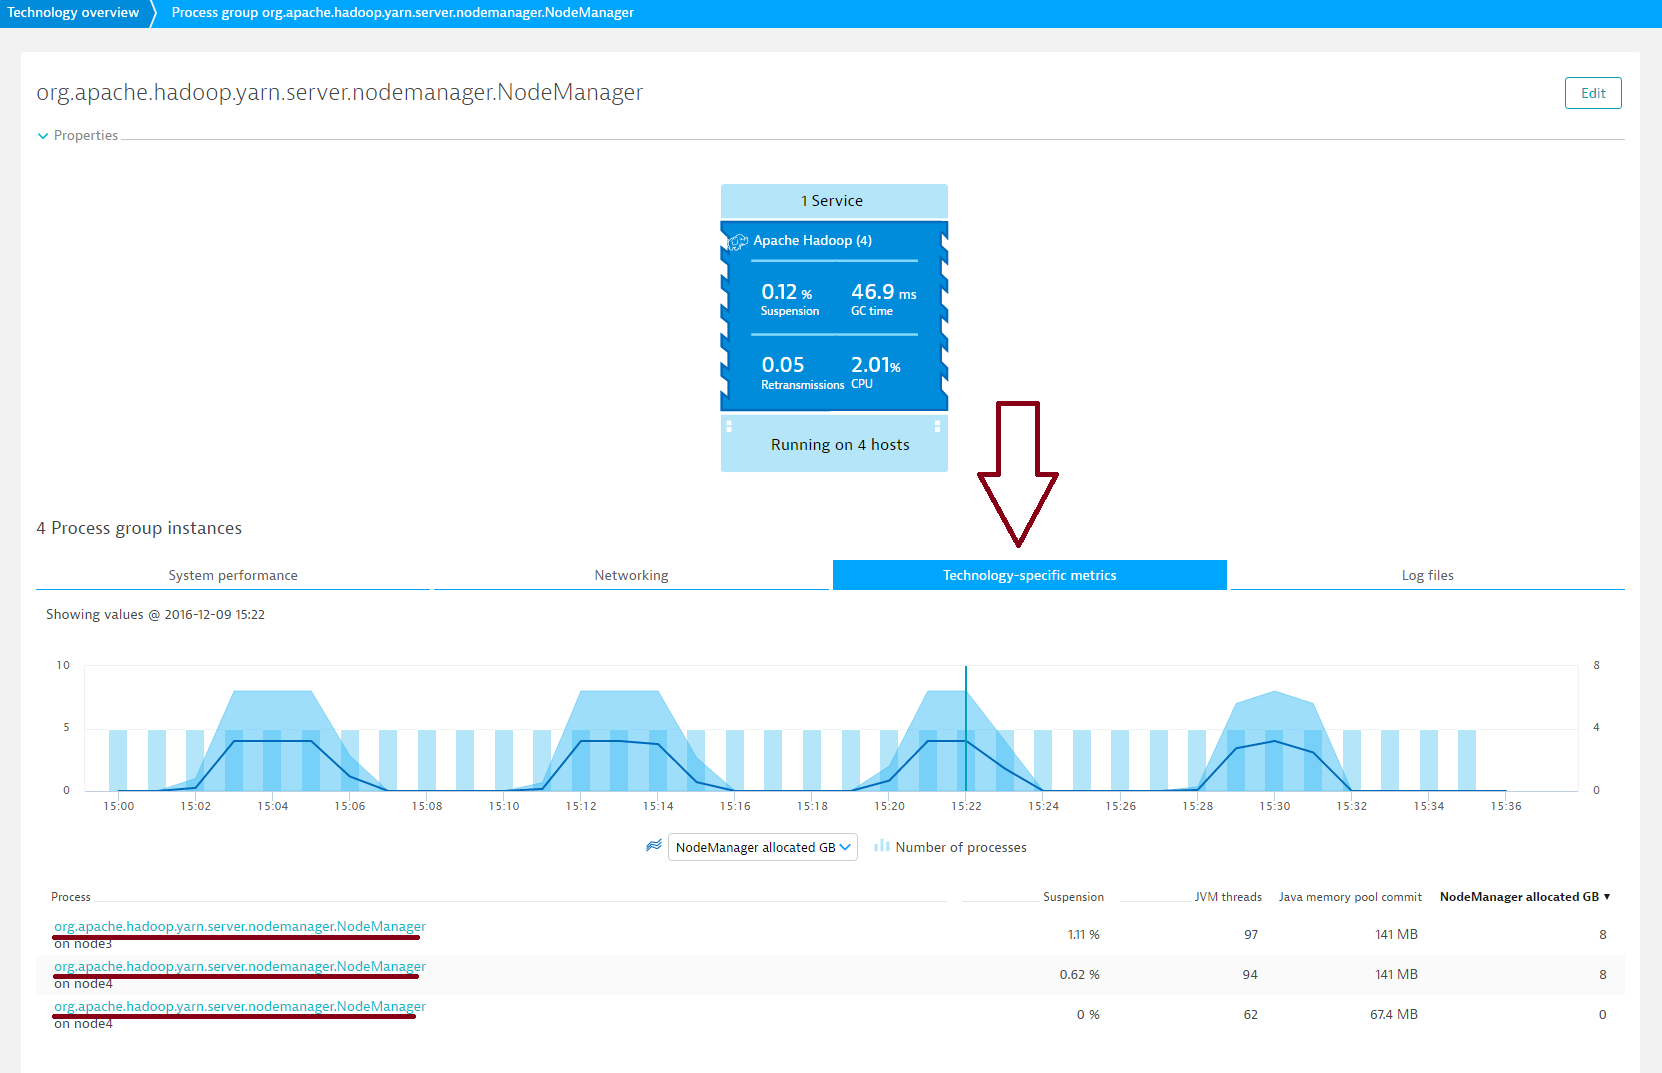
- Click the Hadoop MapReduce tab.
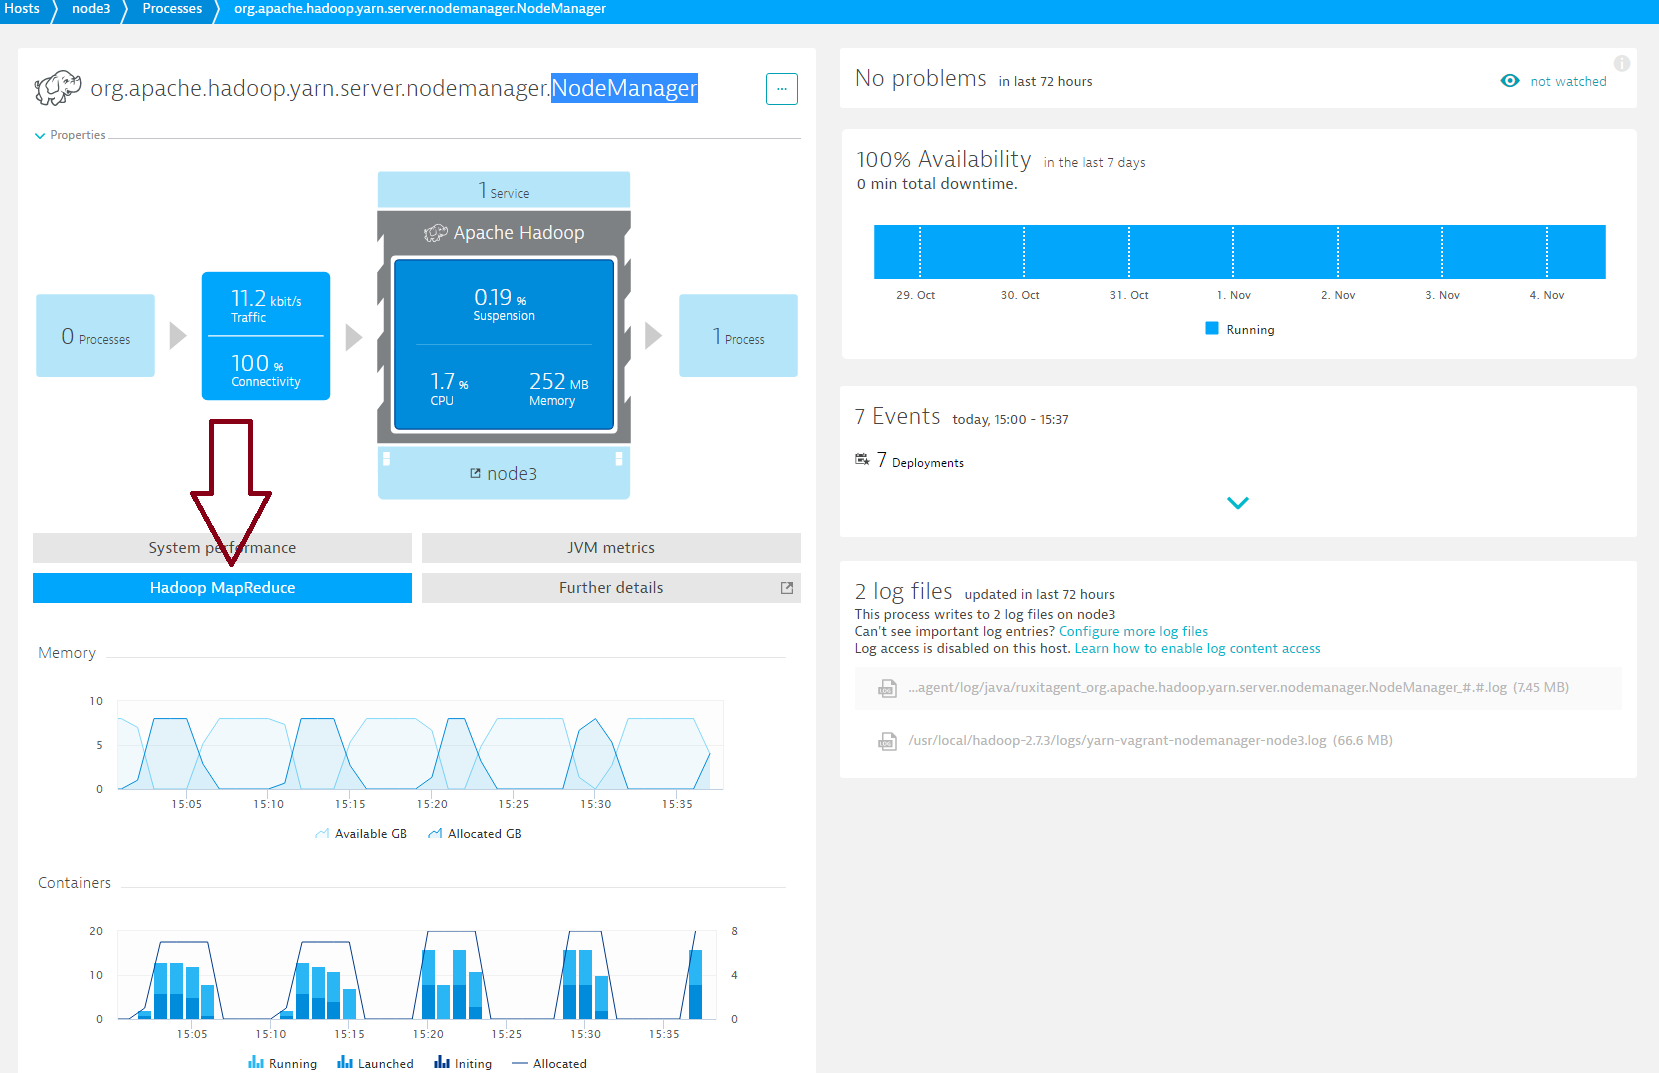
NodeManager metrics
| GB Available |
Current available memory in GB |
| GB Allocated |
Current allocated memory in GB |
| Completed |
Total number of successfully completed containers |
| Running |
Current number of running containers |
| Launched |
Total number of launched containers |
| Initing |
Current number of initializing containers |
| Allocated |
Current number of allocated containers |
| Failed |
Total number of failed containers |
| Killed |
Total number of killed containers |
| Connections |
Number of current connections |
| Output Bytes |
output in bytes |
| Outputs Failed |
Number of failed outputs |
| Outputs OK |
Number of succeeded outputs |
Prerequisites
- For full Hadoop visibility, OneAgent must be installed on all machines running the following Hadoop processess:
NameNode, ResourceManager, NodeManager, DataNode, and MRAppMaster
- Linux OS
- OneAgent 1.103+
- Hadoop version 2.4.1+
Enable Hadoop monitoring globally
With Hadoop monitoring enabled globally, Dynatrace automatically collects Hadoop metrics whenever a new host running Hadoop is detected in your environment.
- Go to Settings > Monitoring > Monitored technologies.
- Set the Hadoop switch to On.
Want to read more?
Visit our dedicated Hadoop monitoring webpage to learn more about big data monitoring and how Dynatrace supports Hadoop.
Have feedback?
Your feedback about Dynatrace Hadoop monitoring is most welcome! Let us know what you think of the new Hadoop plugin by adding a comment below. Or post your questions and feedback to Dynatrace Community.


Looking for answers?
Start a new discussion or ask for help in our Q&A forum.
Go to forum