
In an earlier blog post, I explained the problems that can result from omitting the Node.js environment variable NODE_ENV from your Express.js applications. That post explored how misconfigured environment variables can negatively affect performance. I included a few sunburst charts to illustrate where Node.js spends its time under various scenarios.
Since the writing of that earlier post, we’ve added some new capabilities to our Node.js monitoring, including:
- Process metrics
- Event-loop metrics
- Support for a number of frameworks and third-party modules
All of these new capabilities provide you with valuable new Node.js insights.
Ambient CPU sampling for Node.js
Until now, however, we’ve had no easy way to inspect userland code to find the source of CPU-heavy operations that negatively impact performance. Today, I’m happy to announce that we’ve closed that visibility gap for Node.js by providing production-grade, low-overhead CPU sampling for Node.js.
Real-world use case
As explained in the earlier blog post, an express.js application runs significantly slower when in development mode. Back then, we used a module for CPU sampling to show that template compilation was to blame for the slowdown.
Now, with ambient sampling in Dynatrace, we get this functionality out of the box.
To test this, we:
- Created an express application that makes an outbound HTTP call and returns an HTML page rendered with the Jade (now PUG) template engine.
- Used ab to put the application under load.
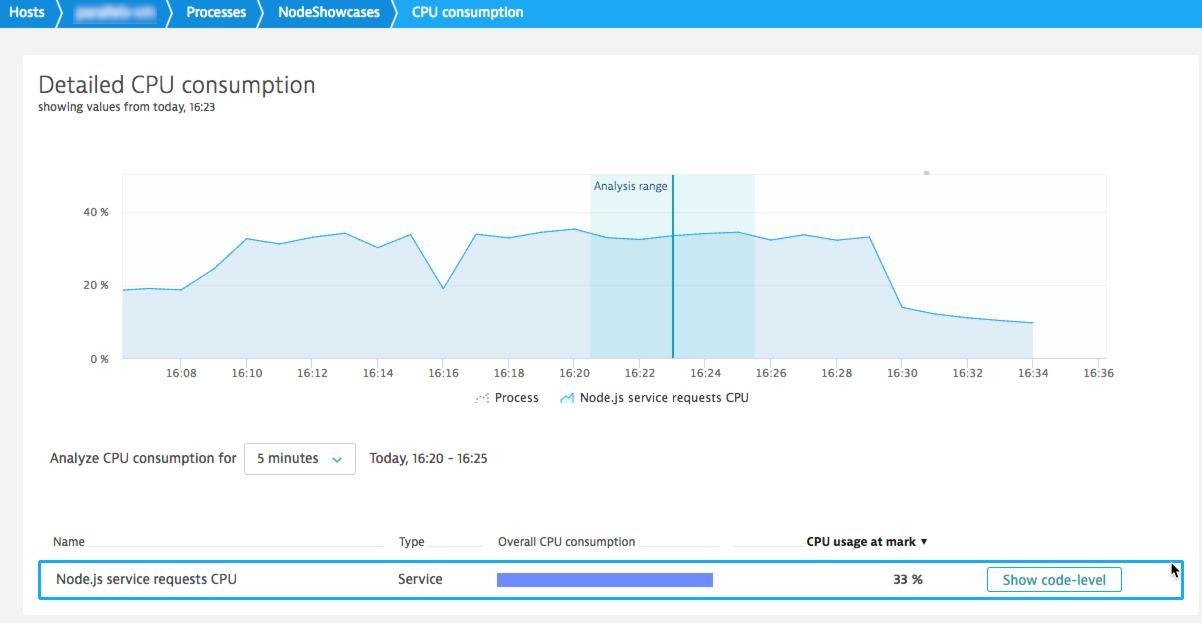
By clicking the Show code-level button on the Node.js process CPU consumption page (see image above), you can drill down into the CPU samples collected during a given period of time. In this example, you can see that most CPU time was spent in onread. This makes sense due to the high volume of requests received during the load test.
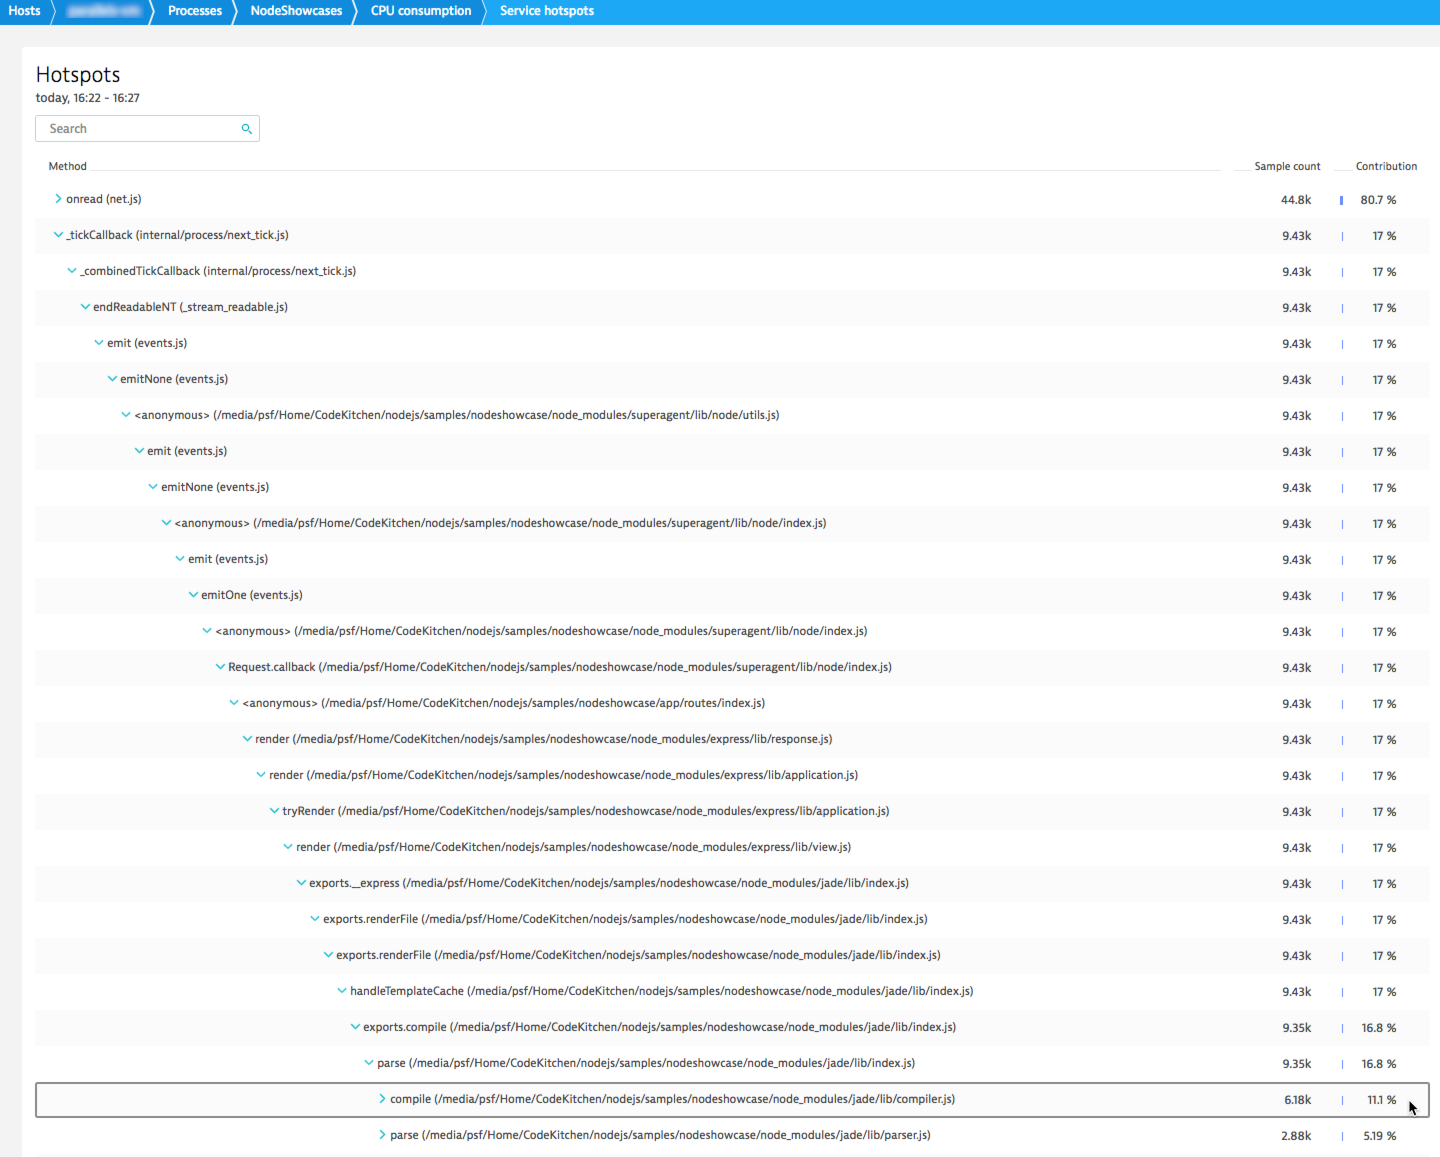
With another 17% of CPU time consumed by _tickCallback, and by drilling into this sub-tree, we can clearly see that most of this time was spent on template compilation. In a real-world scenario, this would be a good starting point for performance optimization (by, for example, enabling caching). Express does this out of the box when an application runs in production mode.
Availability
Due to a memory leak in some versions of Google V8, this new ambient sampling functionality is enabled only for Node v6 and recent versions of Node 8 and 9.
Conclusion
With ambient sampling, Node.js userland code is no longer a black box. Any operation that consumes CPU time will appear in this tree view, making it easy for you to pinpoint performance problems. This is just one reason why Dynatrace is the #1 solution for monitoring Node.js applications.


Looking for answers?
Start a new discussion or ask for help in our Q&A forum.
Go to forum