
We’re happy to announce the beta release of Dynatrace Cassandra monitoring! Apache Cassandra server monitoring provides information about database exceptions, failed requests, performance, and more. You’ll know immediately if your Cassandra databases are underperforming. And when problems occur, it’s easy to see which nodes are affected.
To view Cassandra monitoring insights
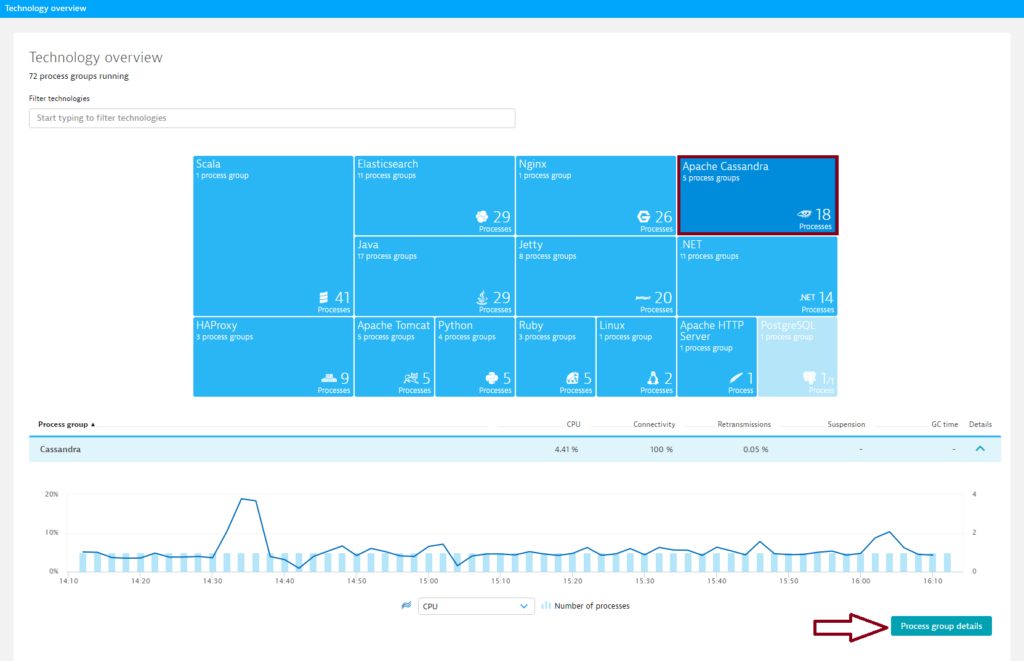
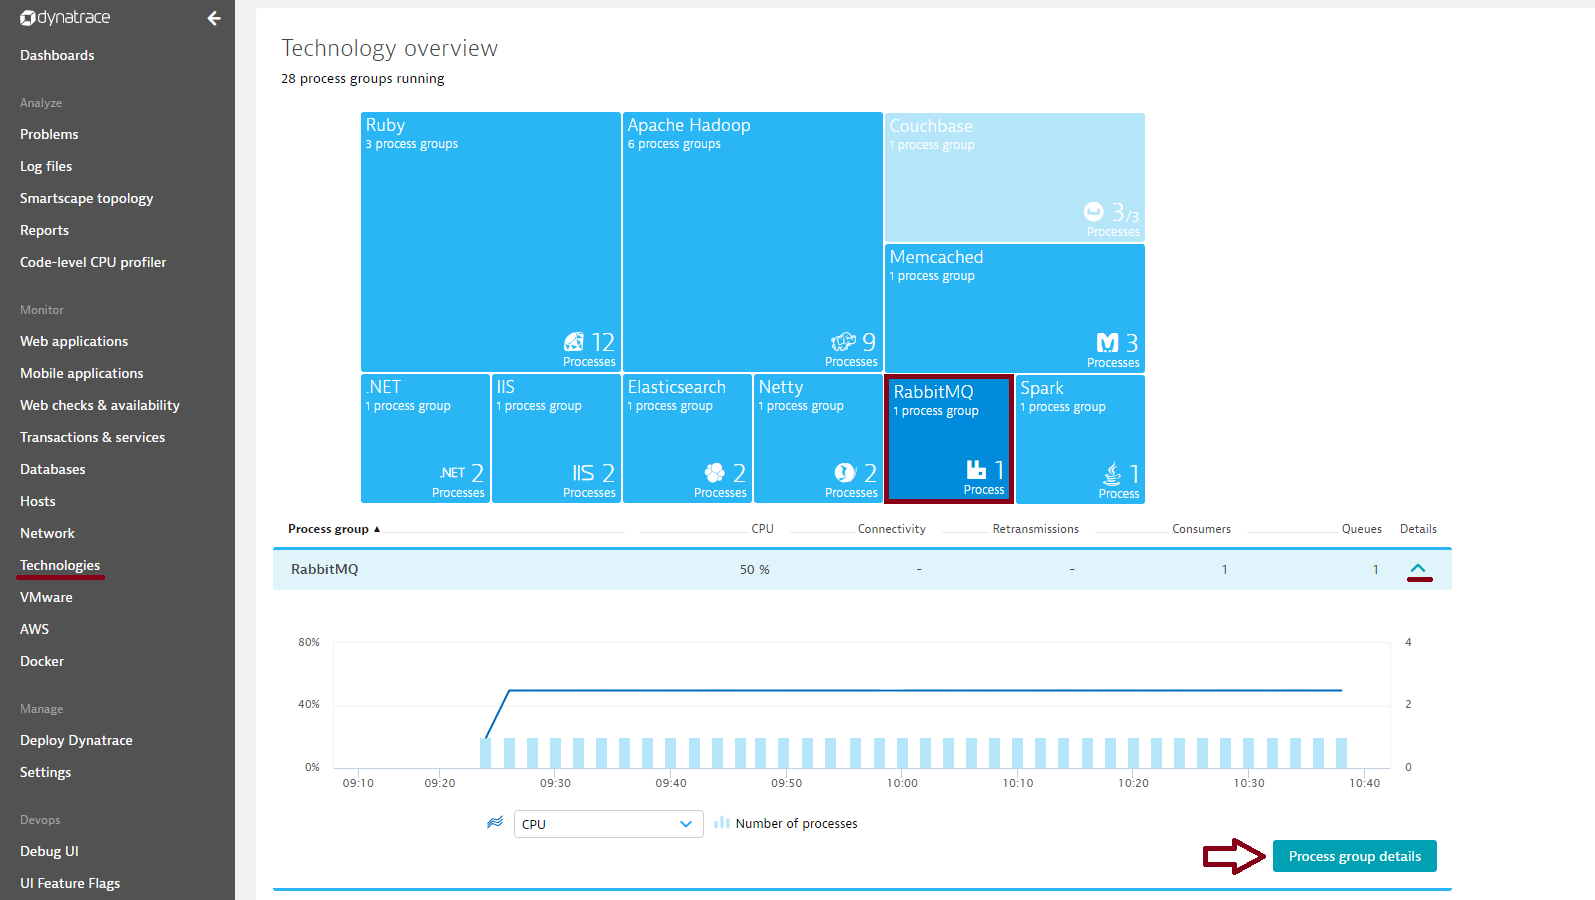
- Click Technologies in the menu.
- Click the Cassandra tile.
Note: Monitoring of multiple Cassandra clusters isn’t supported in this beta release. - To view cluster metrics, expand the Details section of the Cassandra process group.
- Click the Process group details button.
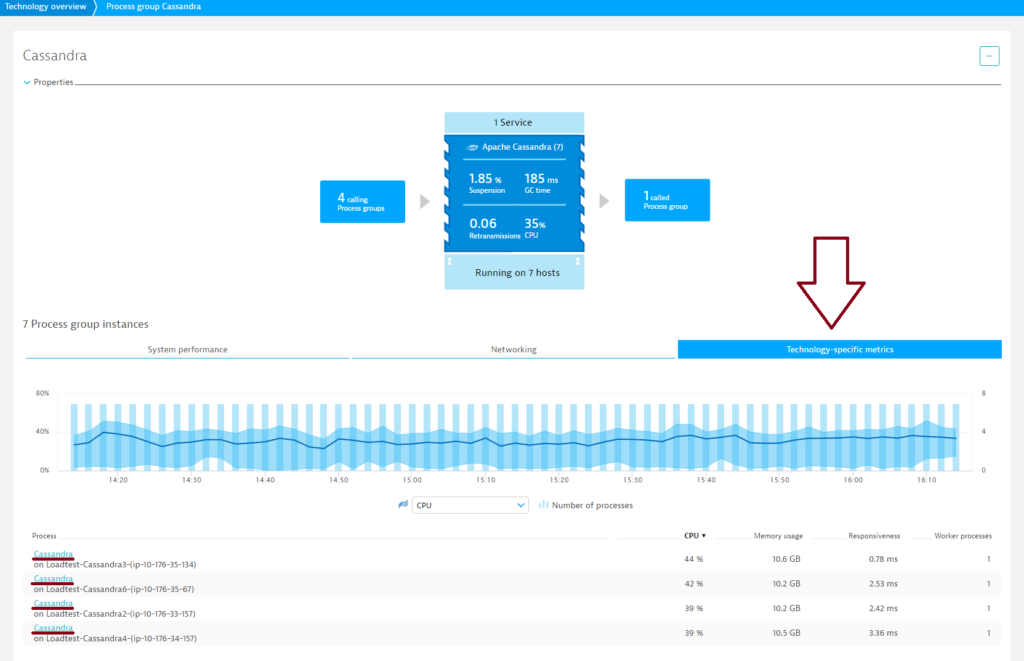
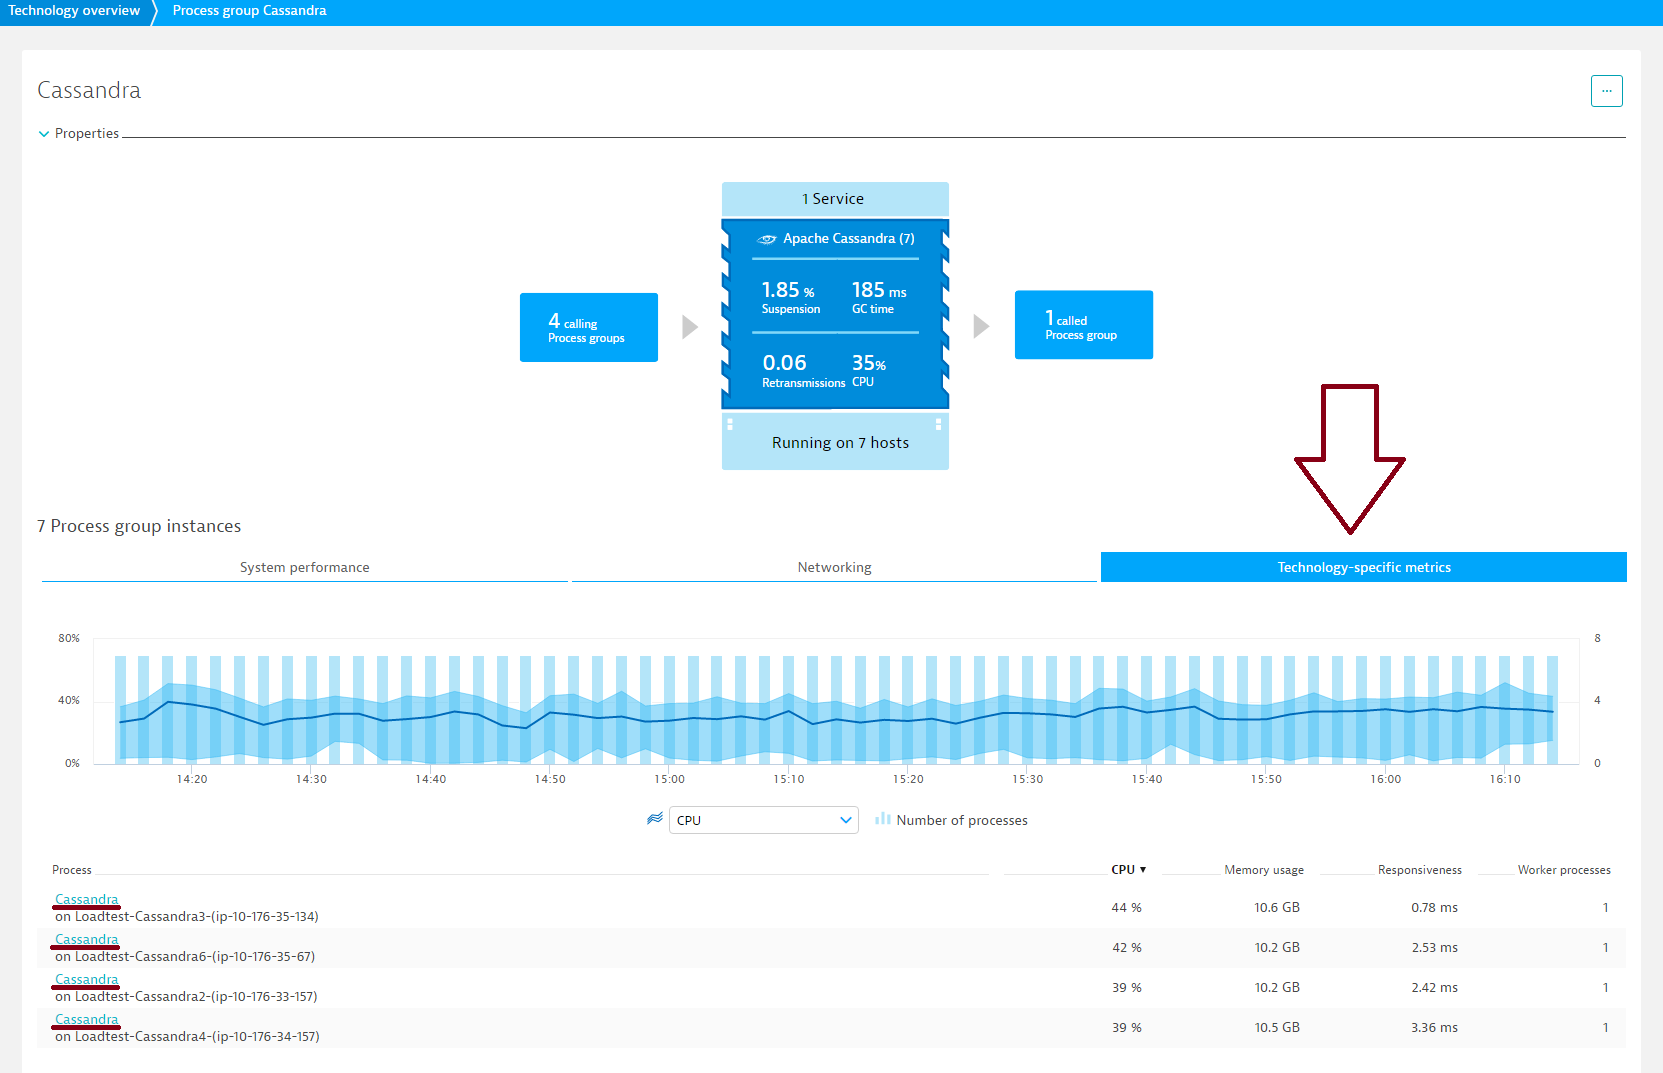
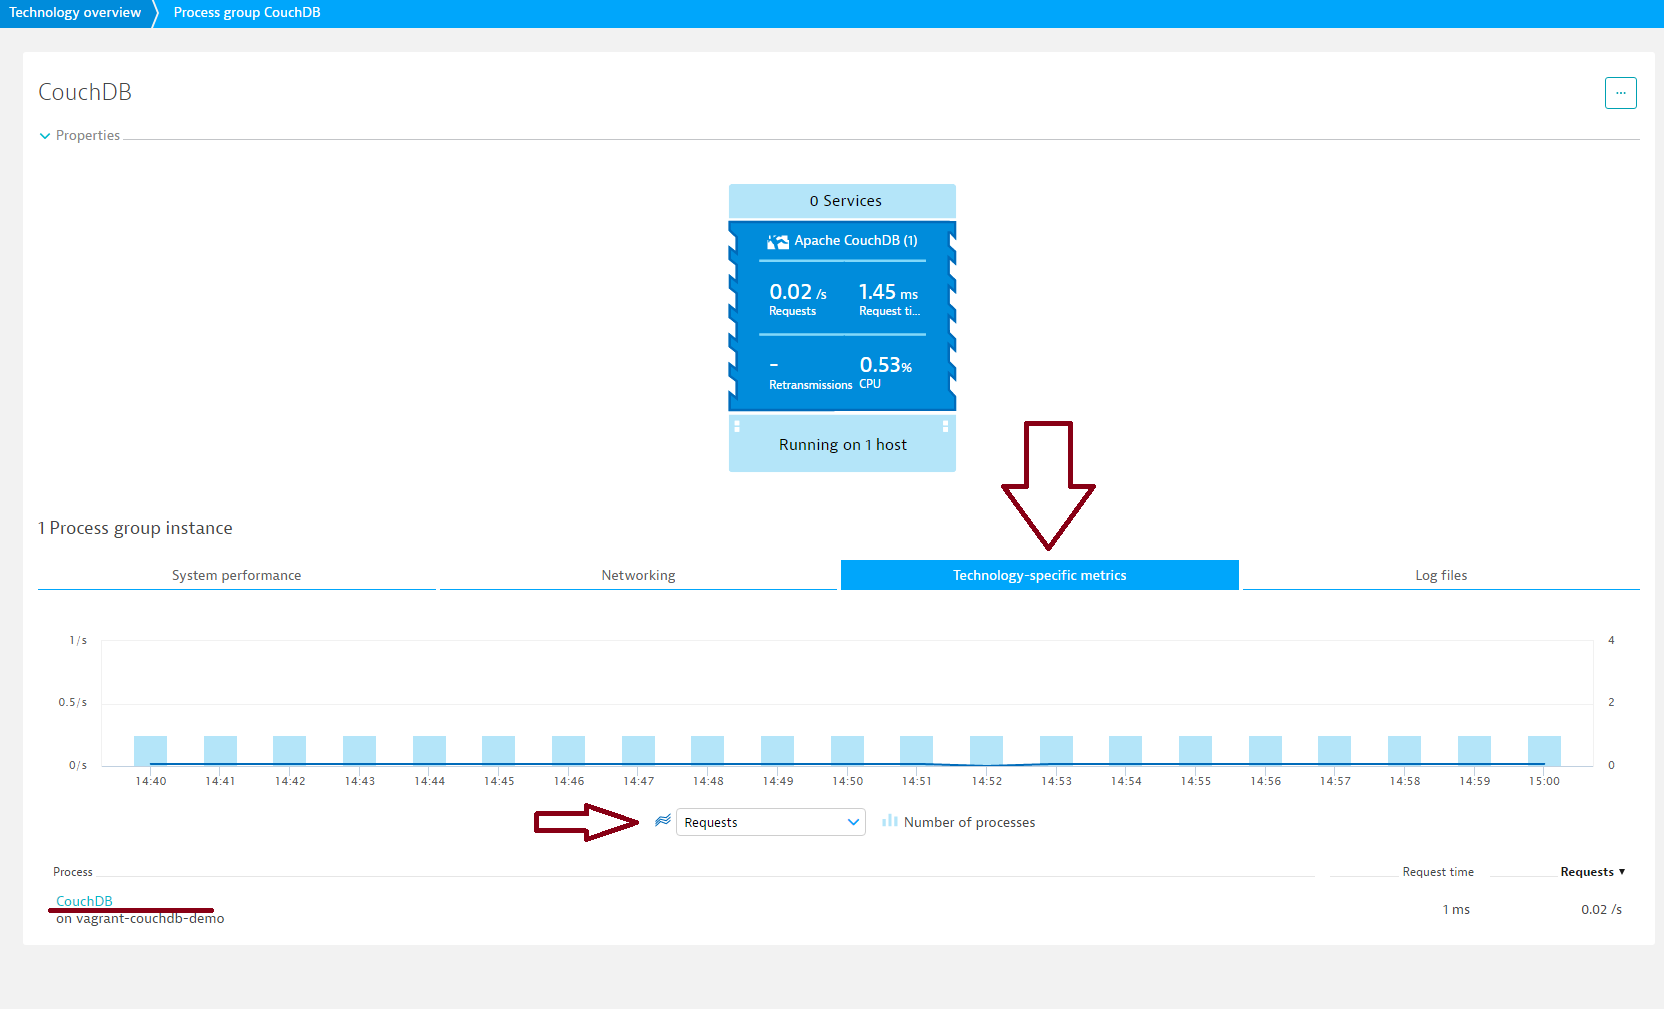
- On the Process group details page, select the Technology-specific metrics tab, where you can identify problematic nodes.
- Select a relevant time interval from the Time frame selector in the top menu bar.
- Select a metric type from the metric drop list beneath the timeline to compare the values of all nodes in a sortable table view.
- To access node-specific metrics, select a node from the Process list at the bottom of the page.
- Click the Cassandra metrics tab.
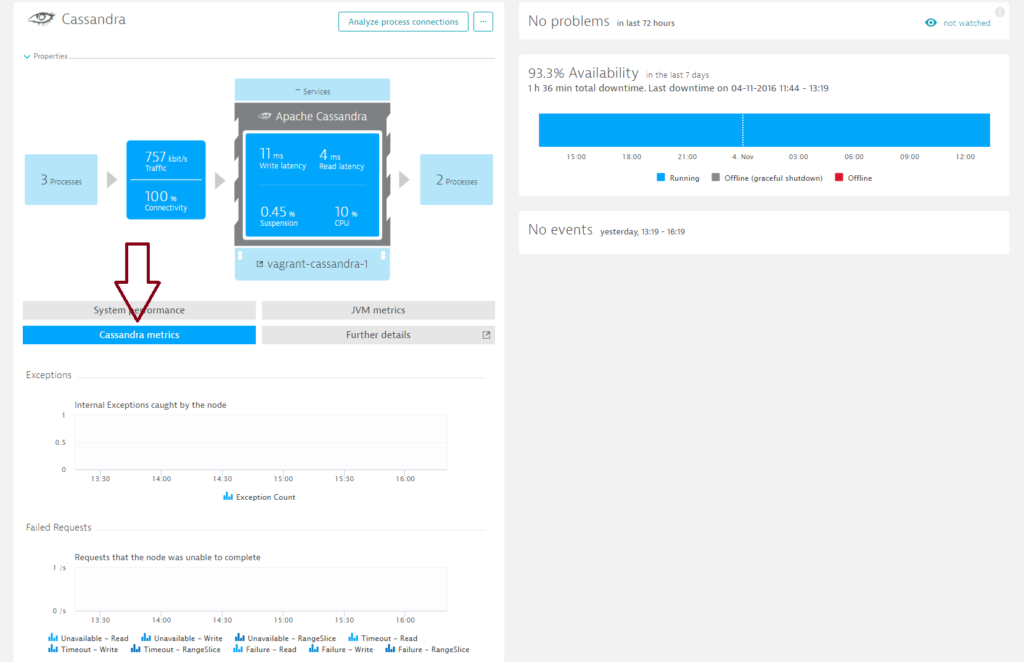 Here you’ll find valuable Cassandra node-specific metrics. The Exceptions and Failed requests charts show you if there’s a problem with the node. Pay particular attention to Unavailable Read/Write/RangeSlice counts. Increased latency while the number of operations remains stable typically indicates a performance issue.


Cassandra node metrics
| Metric | Chart | Description |
|---|---|---|
| Exception count | Exceptions | Number of internal Cassandra exceptions detected. Under normal conditions, this metric should be zero. |
| Unavailable – Read | Failed requests | Number of Unavailable – Read exceptions encountered |
| Unavailable – Write | Failed requests | Number of Unavailable – Write exceptions encountered |
| Failed requests | Number of Unavailable – RangeSlice exceptions encountered | |
| Timeout – Read | Failed requests | Number of Timeout – Read exceptions encountered |
| Timeout – Write | Failed requests | Number of Timeout – Write exceptions encountered |
| Timeout – RangeSlice | Failed requests | Number of Timeout – RangeSlice exceptions encountered |
| Failure – Read | Failed requests | Number of read failure exceptions encountered |
| Failure – Write | Failed requests | Number of Failure – Read exceptions encountered |
| Failure – RangeSlice | Failed requests | Number of Failure – RangeSlice exceptions encountered |
| Read | Operation count | Adverage number or Reads per second |
| Write | Operation count | Adverage number or Writes per second |
| RangeSlice | Operation count | Adverage number or RageSlices per second |
| Read | Latency 95th percentile | Average 95th percentile of transaction read latency |
| Write | Latency 95th percentile | Average 95th percentile of transaction write latency |
| RangeSlice | Latency 95th percentile | Average 95th percentile of transaction RangeSlice latency |
Additional Cassandra node monitoring metrics
More Cassandra monitoring metrics are available on individual Process pages. Select the Further details tab to view these metrics.

Here you’ll find six tabs and plenty of informative metrics.
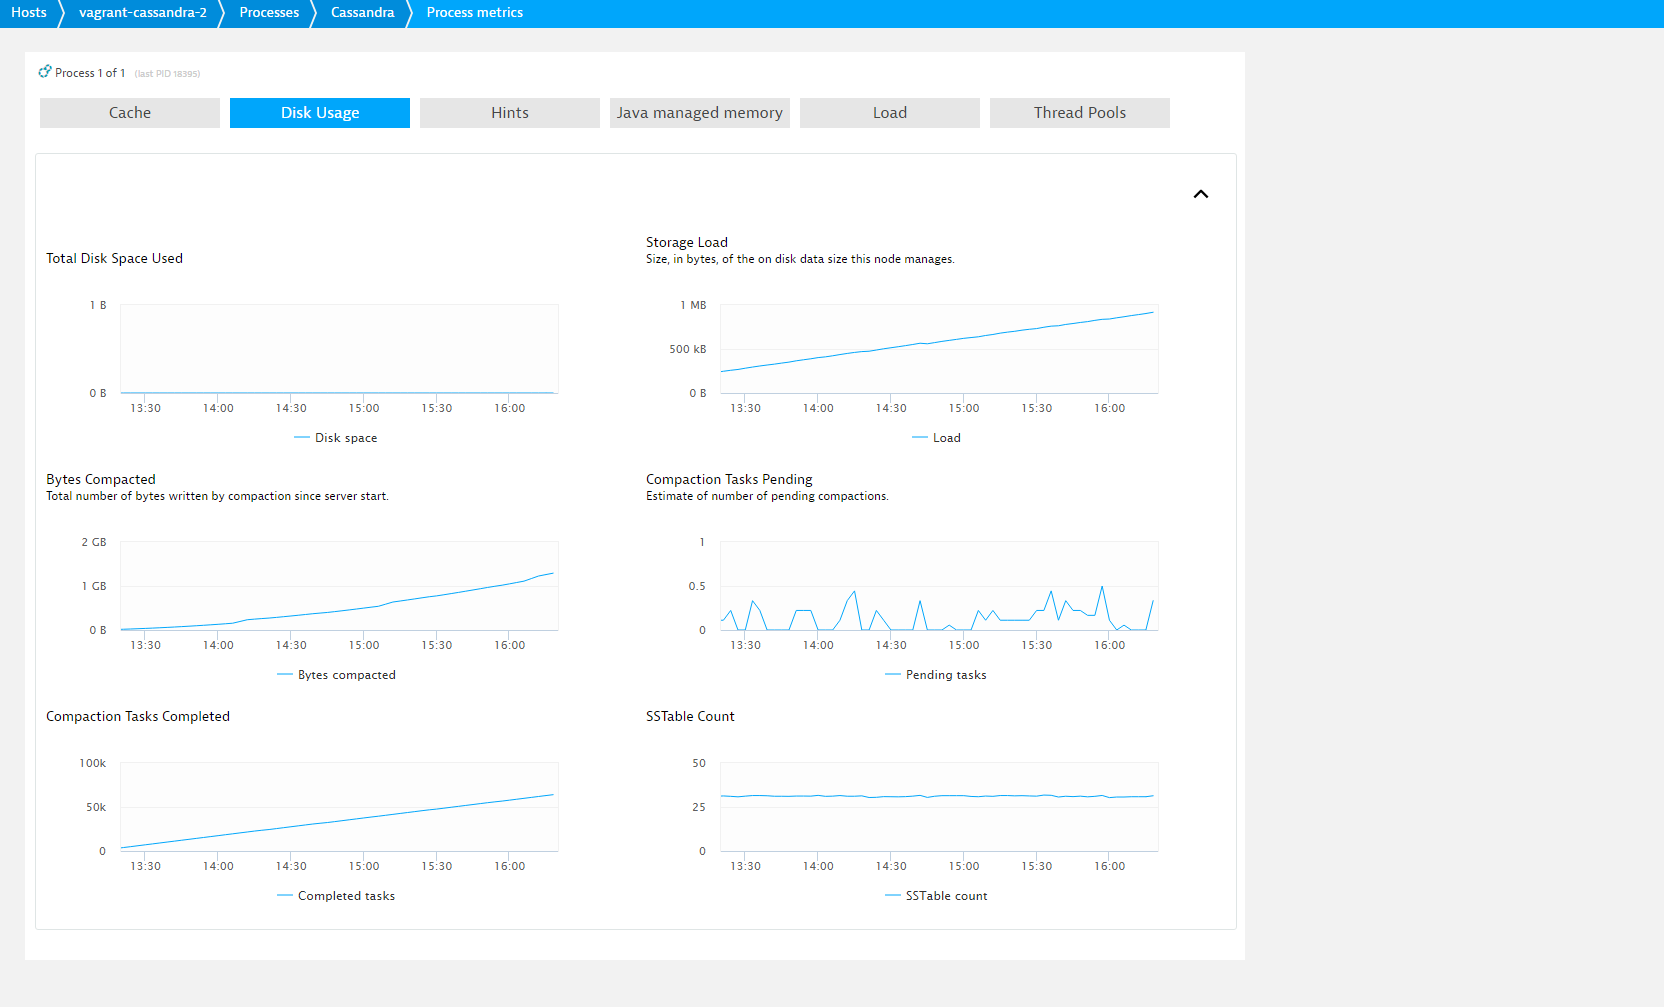
The Cache tab tells you about the Row cache and Key cache hit rates. The Disk usage tab provides essential understanding of the health of the Cassandra compaction process. On the Load tab you’ll find details about ongoing and past operations. Above-average Maximum latency measurements may indicate that you have some very slow requests. Charts on the Thread Pools tab should be empty, or at least be very low. A continuously high number of pending reads indicates a problem. For full details, see Pending task metrics for reads.
Additional Cassandra metrics
| Metric | Chart | Description |
|---|---|---|
| Disk space | Total disk space used | Total disk space used by SSTables, including obsolete tables waiting to be GC’d |
| Row cache hit rate | Hit rate | 2m row cache hit rate |
| Key cache hit rate | Hit rate | 2m key cache row hit rate |
| Load | Storage load | Size, in bytes, of the on-disk data the node manages |
| Bytes compacted | Bytes compacted | Total number of bytes compacted since server start |
| Pending tasks | Compaction tasks pending | Estimated number of compactions remaining to perform |
| Completed tasks | Compaction tasks completed | Number of completed compactions since server start |
| SSTable count | SSTable count | Number of SSTables on disk for this table |
| Hints | Hints | Number of hint messages written to this node since start. Includes one entry for each host to be hinted per hint |
| Average | Read latency | Average 95th percentile of transaction read latency |
| Maximum | Read latency | Max 95th percentile of transaction read latency |
| Average | Write latency | Average 95th percentile of transaction write latency |
| Maximum | Write latency | Max 95th percentile of transaction write latency |
| Average | RangeSlice latency | Average 95th percentile of transaction RangeSlice latency |
| Maximum | RangeSlice latency | Max 95th percentile of transaction RangeSlice latency |
| Average | Read throughput | Adverage number of reads per second |
| Maximum | Read throughput | Max number of reads per second |
| Average | Write throughput | Average number of writes per second |
| Maximum | Write throughput | Max number of writes per second |
| Average | RangeSlice throughput | Average number of RangeSlices per second |
| Maximum | RangeSlice throughput | Max number of RangeSlices per second |
| Mutation pending tasks | Mutation pending tasks | Number of queued mutation tasks |
| Read pending tasks | Mutation pending tasks | Number of read mutation tasks |
| ReadRepair pending tasks | ReadRepair pending tasks | Number of ReadRepair mutation tasks |
Prerequisites
- Cassandra 2.xx
- Linux or Windows OS
Enable Cassandra monitoring globally
With Cassandra monitoring enabled globally, Dynatrace automatically collects Cassandra metrics whenever a new host running Cassandra is detected in your environment.
- Go to Settings > Monitoring > Monitored technologies.
- Set the Cassandra JMX switch to On.
Want to learn more?
Visit our dedicated webpage about Cassandra monitoring to read more about how Dynatrace supports Apache Cassandra.
Have feedback?
Your feedback about Dynatrace Cassandra monitoring is most welcome! Let us know what you think of the new Cassandra plugin by adding a comment below. Or post your questions and feedback to Dynatrace Community.


Looking for answers?
Start a new discussion or ask for help in our Q&A forum.
Go to forum