
The insurance industry may have come later to digital transformation than others, but —led by incumbents—it is rapidly shedding its reputation of marginal customer satisfaction. Today, over 1,500 InsurTech start-ups operate globally, accelerating the shift in focus from legacy systems and agents to digital technologies and policyholders. Incumbent or startup, transforming or cloud-native, the role IT plays is central to the policyholder experience. And unlike some other industries, the news for the incumbents isn’t as threatening as it might sound; McKinsey reports that the emphasis has been on collaboration rather than competition.
The mandate is one that’s been repeated across all vertical markets; digital transformation is necessary for survival, and the consumer should be front and center. Mobile banking and online shopping set the expectations high, resulting in a telling demand as the starting point for insurance companies: “Please don’t make me speak with an agent”. And it’s not just policyholders who benefit from transformation; compelling user journeys improve long-term business outcomes by fostering customer retention, loyalty, and growth through referrals.
Omnichannel policyholder portals are the face of the business
As some companies transform, they choose to build their own user portals and apps. Many others adopt frameworks, which are then customized to meet specific company goals and demographic interests. Guidewire is one of many companies offering flexible mobile-first portals that insurance companies can adapt to engage with their customers.
Loyalty—once partially locked-in through the ordeal of changing carriers—is now driven in large part by the customer journey. How easy is it to get a quote, pay a bill, change policy details, or file a claim? If you’re responsible for the policyholder portal, the answers to these questions are important – they influence not only loyalty but also your Net Promoter Score. You want every customer touchpoint to operate flawlessly, every time. Because if it doesn’t, you pay for it twice; first through an increase in call center costs, second through reduced customer confidence and attrition.
BizDevOps: Connecting IT and business through shared metrics
Flawless is the goal; something less is likely the reality. That’s why IT teams monitor the infrastructure, apps, and real user experience. Similarly, business teams rely on web analytics tools to understand user behavior and trends. But traditional IT and web analytics tools live in separate domains and operate on separate timetables, limiting the insights one can offer the other.
Dynatrace Business Analytics closes this gap by connecting business KPIs to full-stack software intelligence, providing app owners and IT teams with a common view of business metrics. For IT, it means real-time visibility into business outcomes, providing critical data to inform decisions aligned to business goals. For the business, it means you have a team of application and user experience experts actively looking out for your best interests with these business goals in mind. This enables timely remediation of almost any issue impacting these KPIs—providing instantaneous answers that web analytics tools can’t, long before a business intelligence tool like Tableau or Qlick might report a negative trend.
Property & casualty use case
Recently, a property and casualty insurance customer related a simple but compelling story; I’ve changed the details and created new dashboards to help tell it anonymously.
As a long-standing Dynatrace customer, they’ve always been enthusiastic about exploring new use cases. Digital Business Analytics was an easy way to add new value—not just to the Dynatrace solution, but more importantly to the business stakeholders the IT teams serve. By leveraging existing data and capabilities they already owned, the team quickly implemented a set of dashboards that are shared between app owners and operations teams, fostering productive and real-time collaboration.
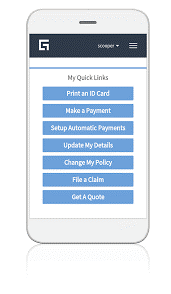
The portal dashboard (below) monitors key functions as KPIs for the Policyholder Portal, where mobile and desktop users come to manage their policies. The KPIs are measured as conversions and correspond to the app’s primary functions. Underneath each KPI is the user experience score for each conversion step. For each KPI there’s a link to a detailed funnel view to isolate conversion rate problems.
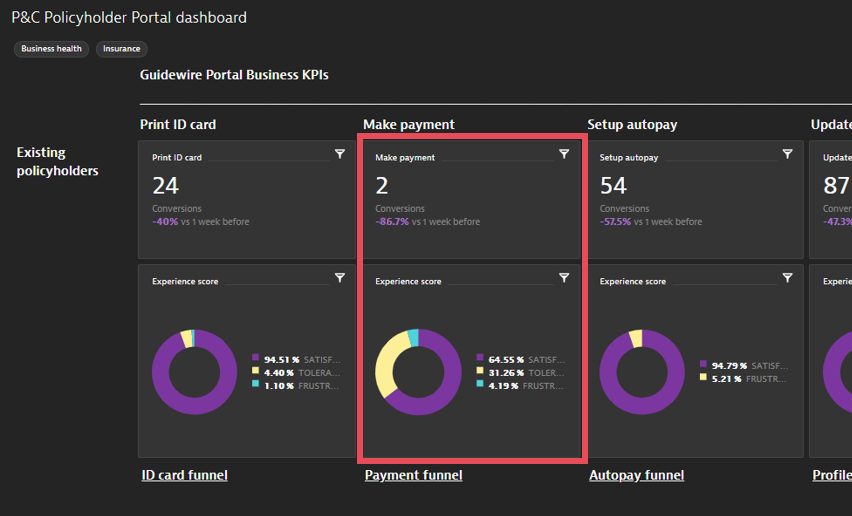
The make payment KPI is performing well below normal, down 87% from the same period a week ago. The user experience score has also dropped, indicating a performance problem or error condition. Alerted to the business KPI problem with policyholder payments, the customer clicked through to the funnel view to gain important context.
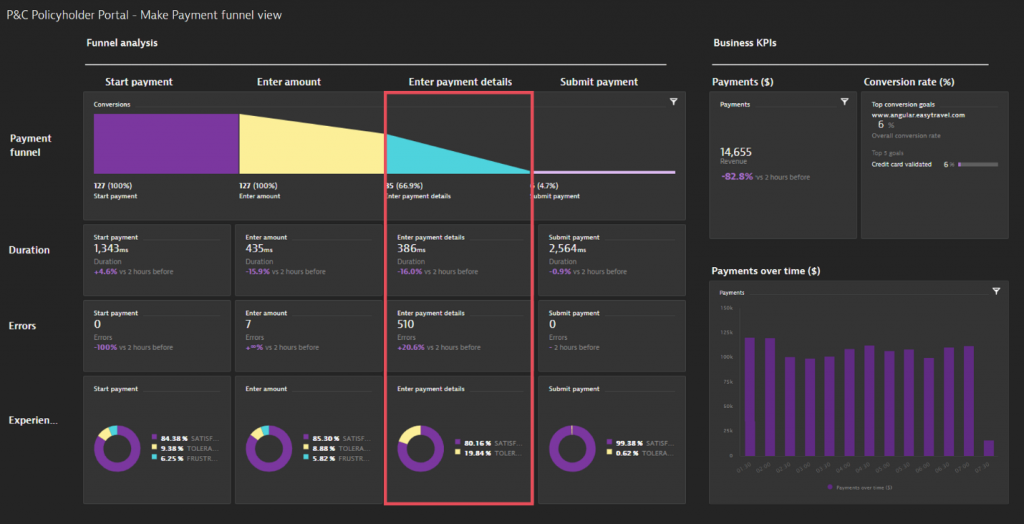
Step three of the funnel—where users enter their payment details—shows a dramatic drop-off in conversions caused by a high number of JavaScript errors. The impact of the drop-off is evident in the Business KPI section of the dashboard; conversions and revenue from payments have suddenly dropped by 82%. Dynatrace identified the problem, and the fix—reverting to a previous version of the page— was accomplished within the hour before the business even knew about it.
Of course, you could alert on all JavaScript (and other) errors, on all slow pages, on all rage clicks, on all frustrating user experience scores. But then you’d be faced with alert storms, unable to prioritize actions in alignment with business goals, and you’d miss seeing the business KPI problems that may not be directly tied to a technical issue. By adding business context through KPIs and audience segments, Digital Business Analytics helps you prioritize your efforts.
From tactical to strategic
Solving a problem is important, but it’s also tactical. It’s not enough for business and DevOps teams to operate in loosely coupled silos. As problems straddle these silos, their importance will often be viewed with different levels of urgency. Connecting business metrics and KPIs with app performance and user experience foster effective collaboration between app owners and IT teams. The result is strategic and data-driven decision-making to tackle the issues that most impact business outcomes.
Getting started with Digital Business Analytics is easy! Contact your account team or CSM to add more value to your business and empower cross-functional teams with better business insights.


Looking for answers?
Start a new discussion or ask for help in our Q&A forum.
Go to forum