
The Synthetic experience on the latest Dynatrace platform is complete with the transition of browser monitors. Once activated, Dynatrace runs browser monitors using the newest RUM JavaScript, delivering more accurate simulations and tighter alignment with Real User Monitoring. The updated experience makes Synthetic more powerful and easier to act on, from rich waterfall analysis to trend visualization and automation with execution details stored as events in Grail® and available via Dynatrace Query Language (DQL).
Deeper visibility and smarter analysis with Synthetic on the latest Dynatrace platform
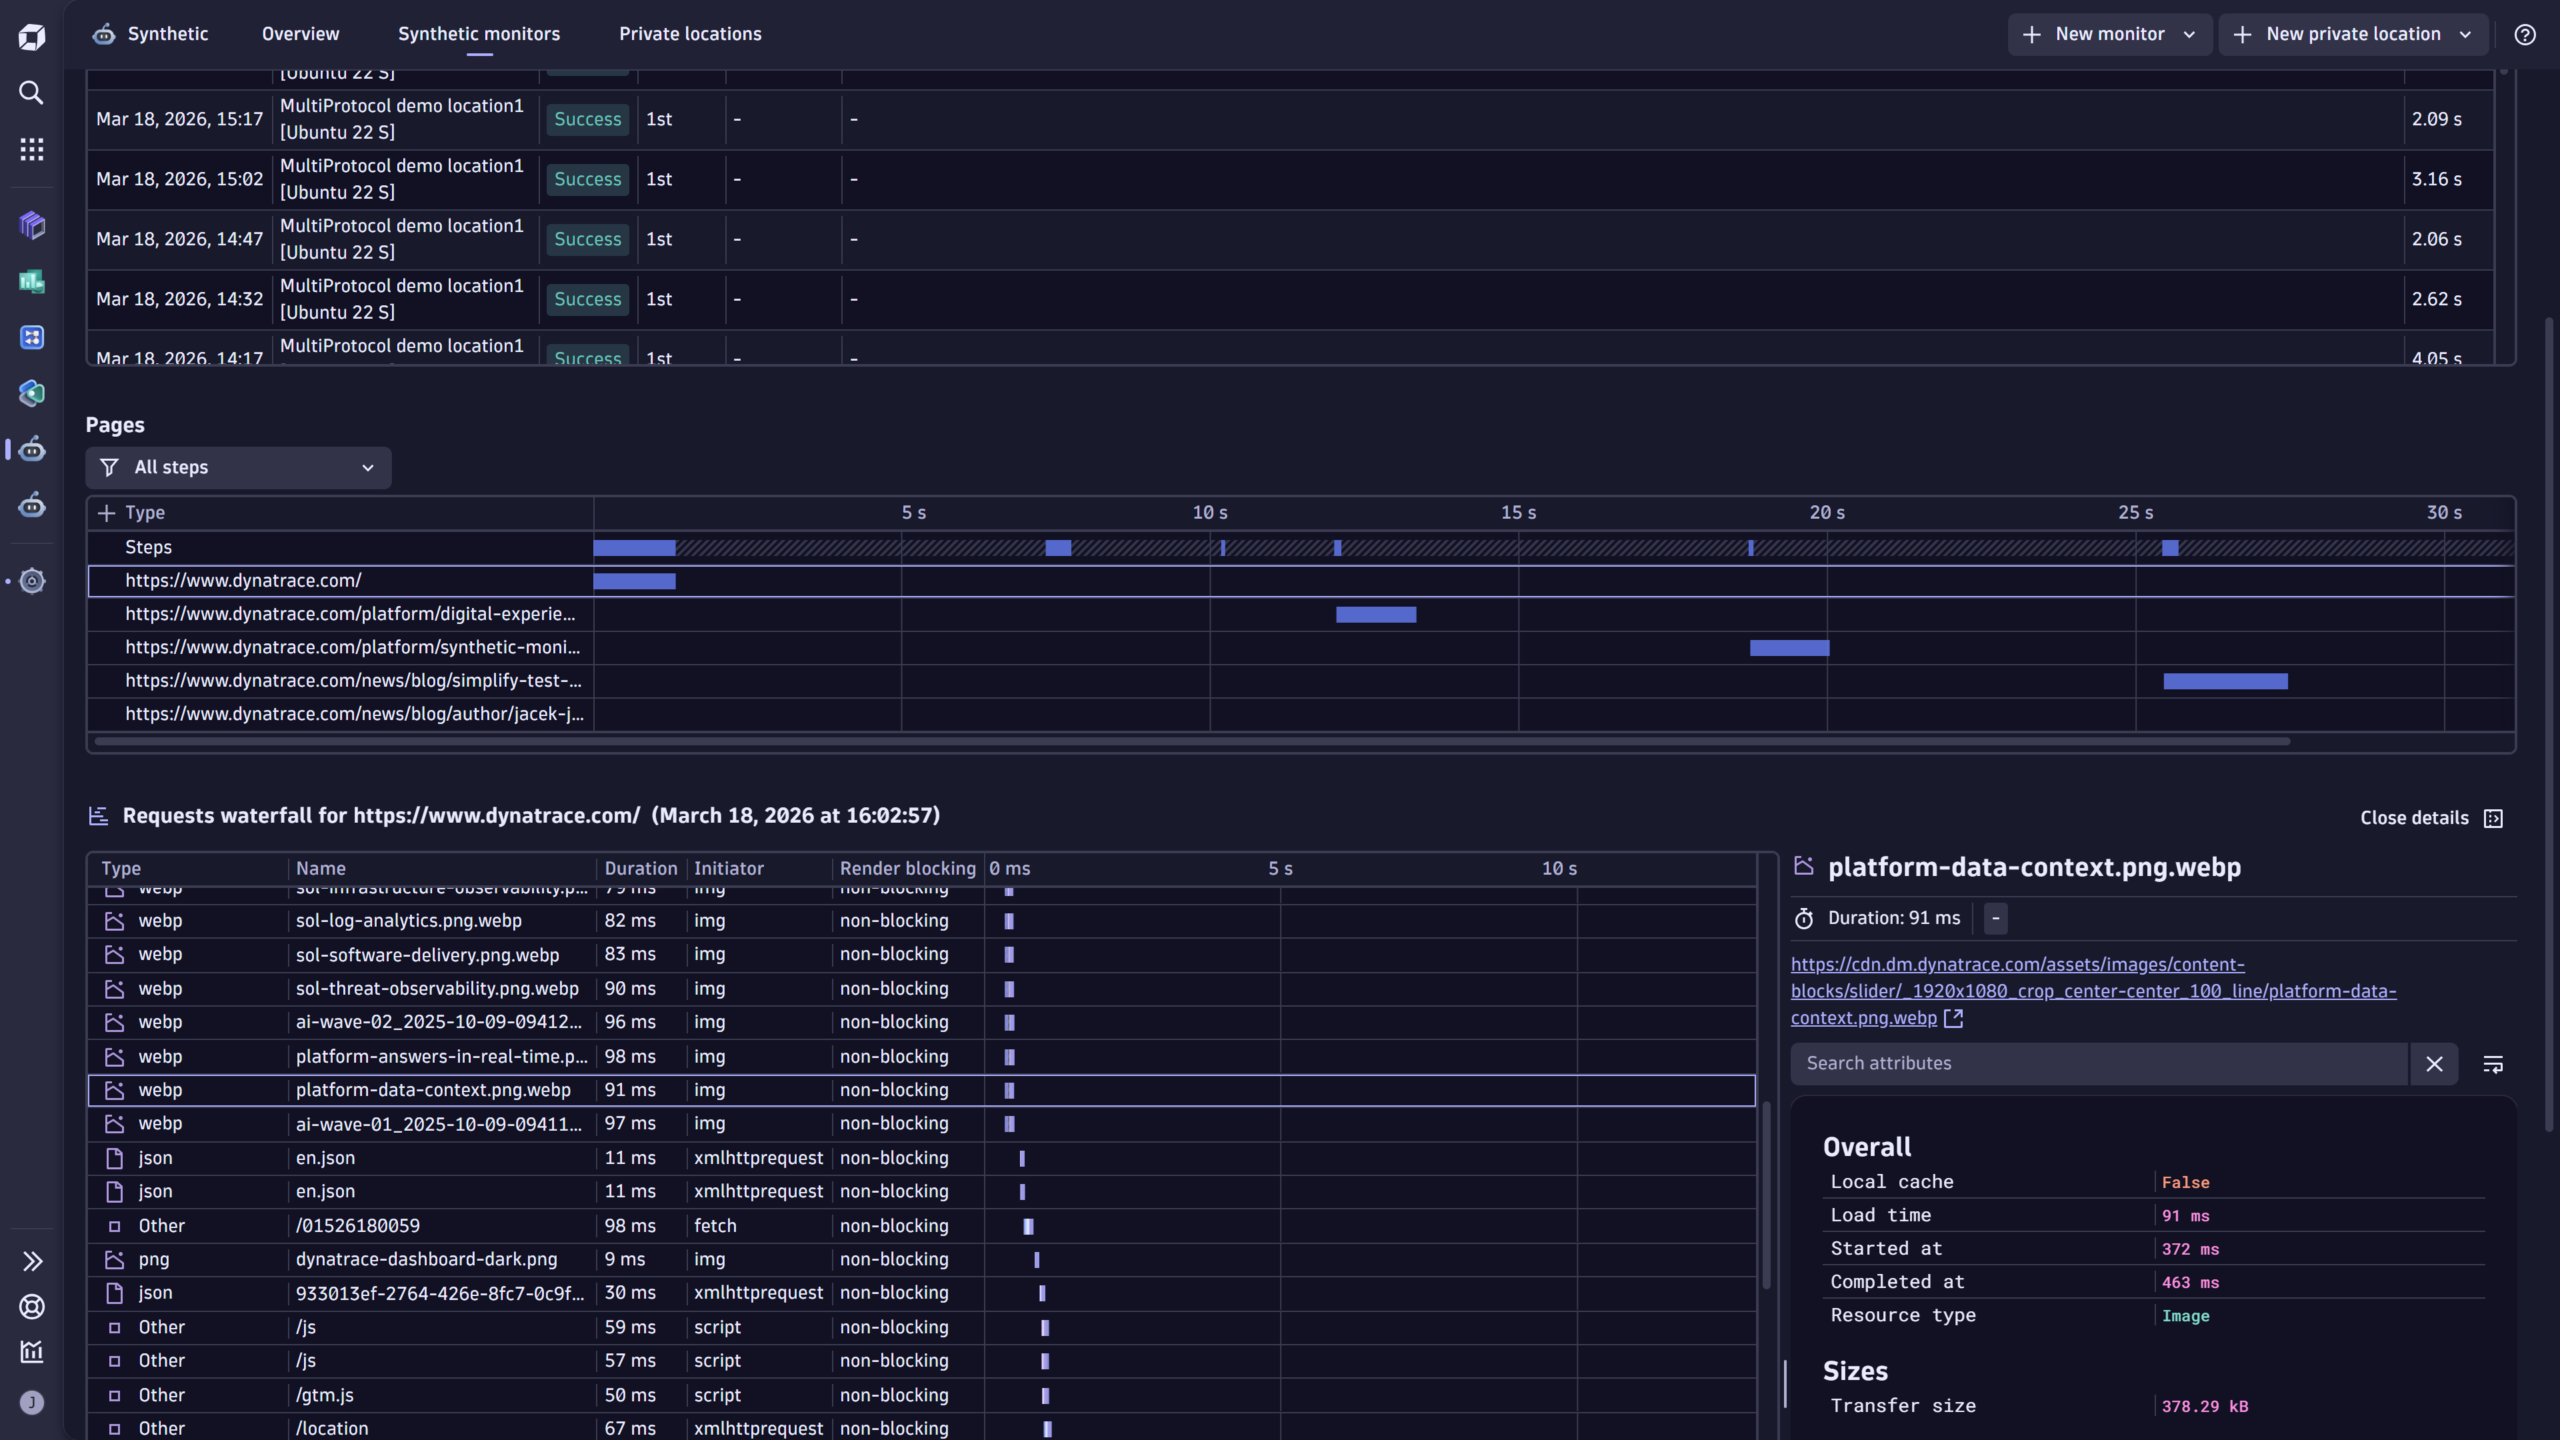
- Waterfall chart report in the latest Dynatrace experience
The transition of Synthetic to the 3rd generation of Dynatrace is complete: All Synthetic capabilities, including the Requests waterfall chart powered with data from the latest RUM JavaScript, are now available directly in the latest Dynatrace experience. - Explore synthetic events with DQL
Use DQL to run ad‑hoc queries on synthetic event data to filter, aggregate, and correlate results with other telemetry for advanced troubleshooting and performance optimization.
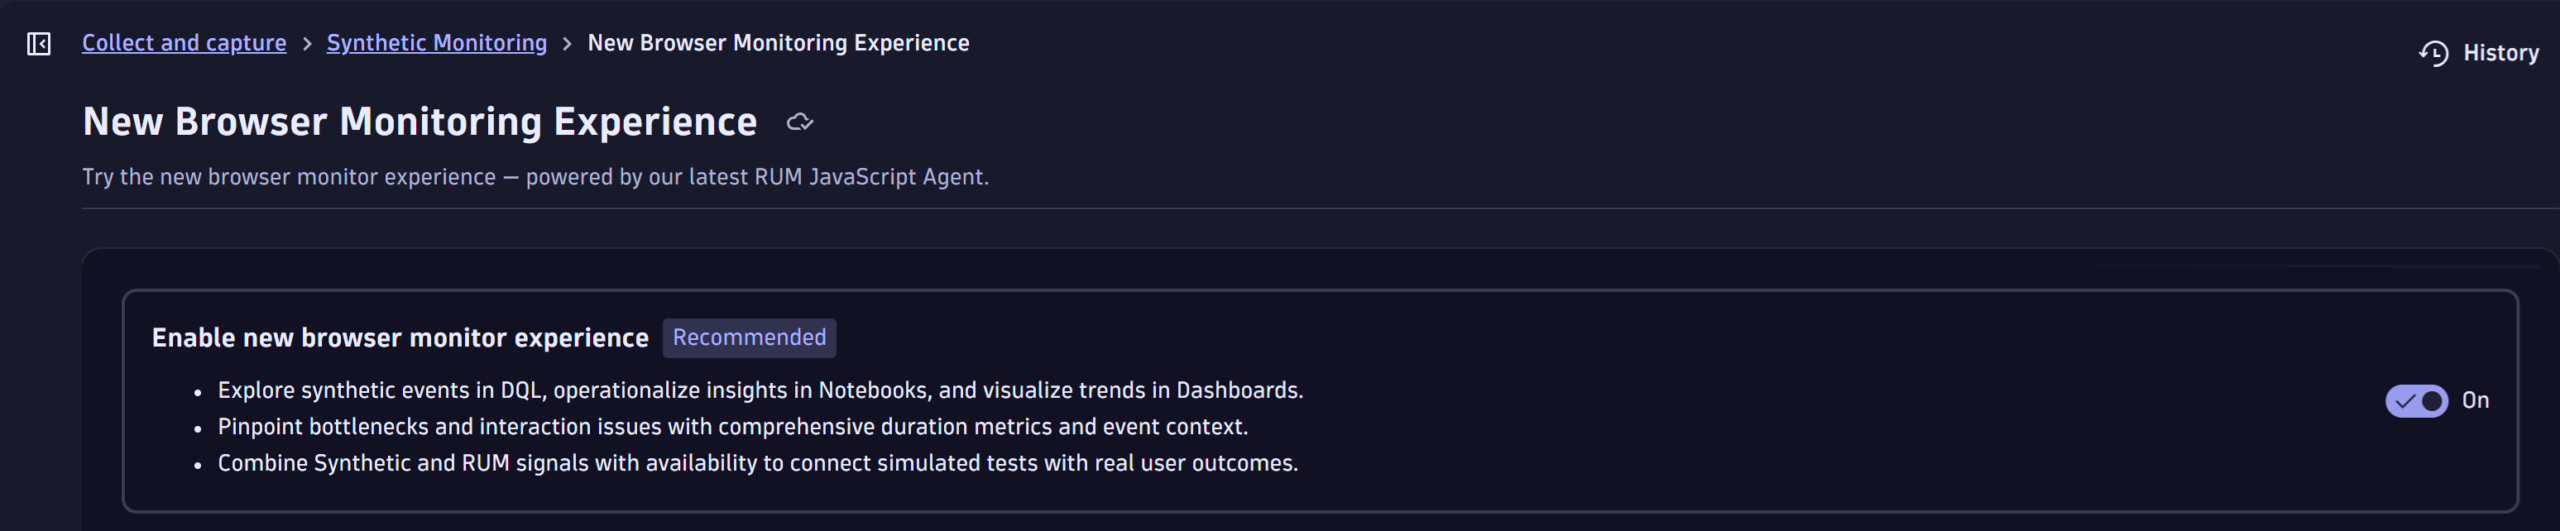
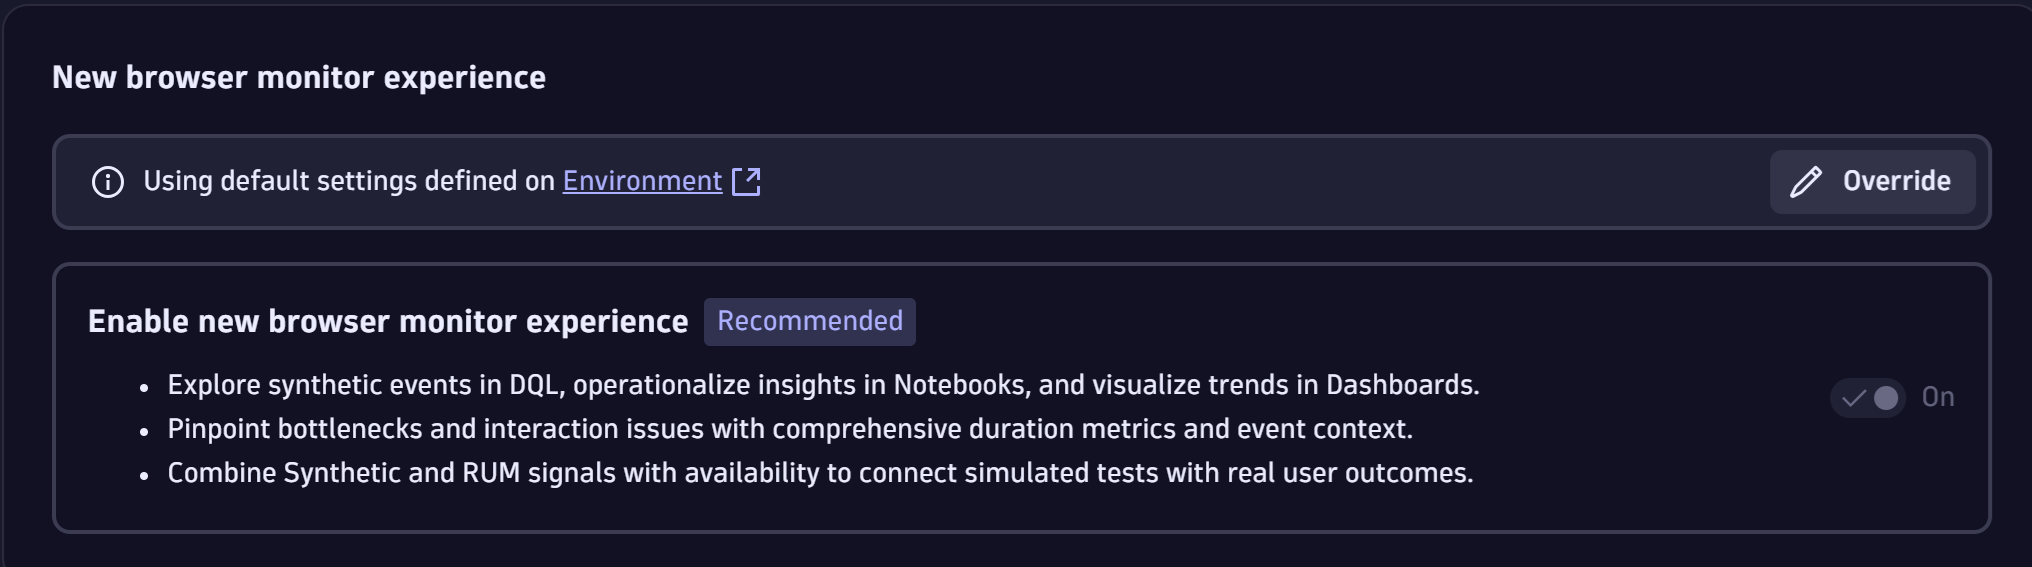
How to turn on browser monitors and fully benefit from the latest Dynatrace capabilities
Turning on browser monitors fully in the latest Dynatrace is quick and flexible; you can flip it on for your whole environment or opt in per monitor to run a phased rollout.
- Go to Settings > Synthetic Monitoring > New Browser Monitors Experience.
- Set the Scope behavior: Turning on browser monitors at the environment level is the default; individual monitors can override the default so teams can test or migrate gradually.
Enhanced Requests waterfall chart
The new Requests waterfall gives you real troubleshooting power. It moves analysis from vague timing numbers to resource‑level visibility you can act on.
- See every resource that loaded with the page (type, name, and exact load duration in ms), so you can spot the single slow asset that drags down performance and, by extension, the user experience across the whole page.
- Know what triggered each request—the resource initiator (fetch, script, link, XHR, etc.)—to distinguish third‑party scripts, lazy loads, or XHRs that unexpectedly spike load time
- Identify render‑blocking and timing boundaries (start/end times) to separate network latency from rendering or scripting costs. This is critical when deciding whether to optimize CDN, defer scripts, or rework code
- Instantly spot failing resources—errors are flagged directly in the waterfall, so you don’t have to cross‑check multiple views to find missing or broken assets
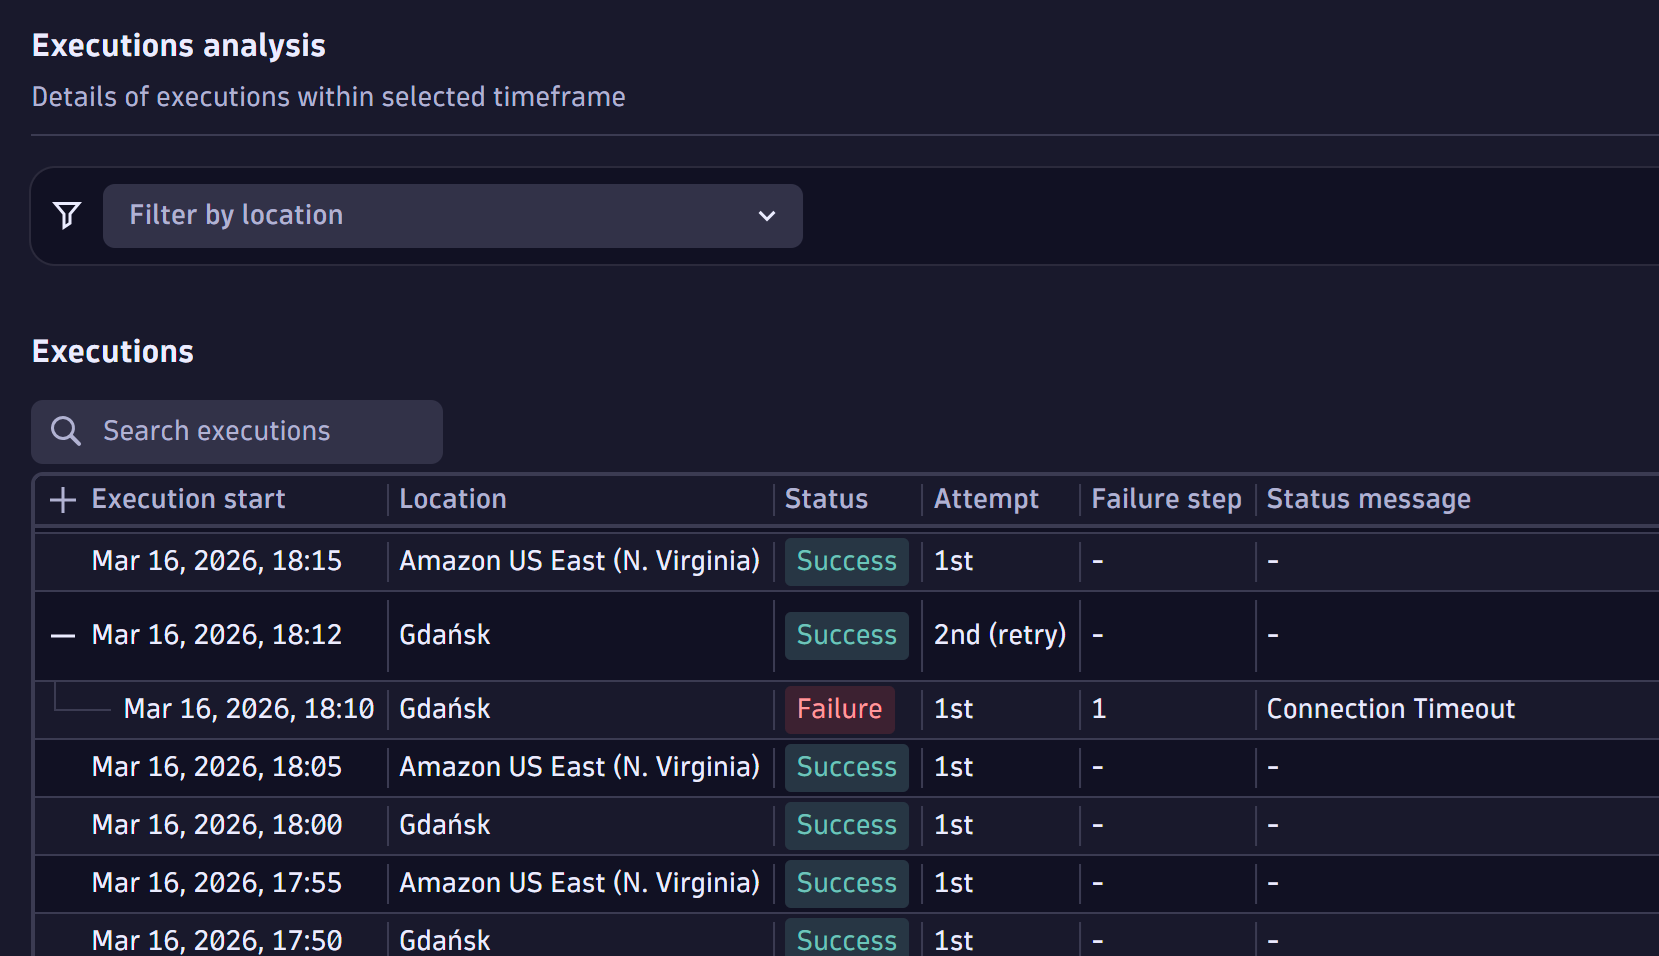
- Understand retries and execution attempts—if automatic retry on error is turned on, the executions table and waterfall surface retry attempts (with icons), giving you the full story for flaky tests or transient network issues
- Delivered natively in the Latest Dynatrace experience. You get the enhanced Requests waterfall and resource‑level analysis without having to fall back to Synthetic Classic for detailed reporting
In short, the waterfall turns a monitor execution into a forensic timeline, resource by resource, initiator by initiator, so teams can pinpoint root causes faster and prioritize the fixes that deliver the biggest user‑facing improvements
DQL exploration
Browser monitors fully in the latest Dynatrace surfaces Synthetic and RUM events in Grail, so you can query execution details with DQL, turning monitor runs into searchable, automatable telemetry.
Core benefits
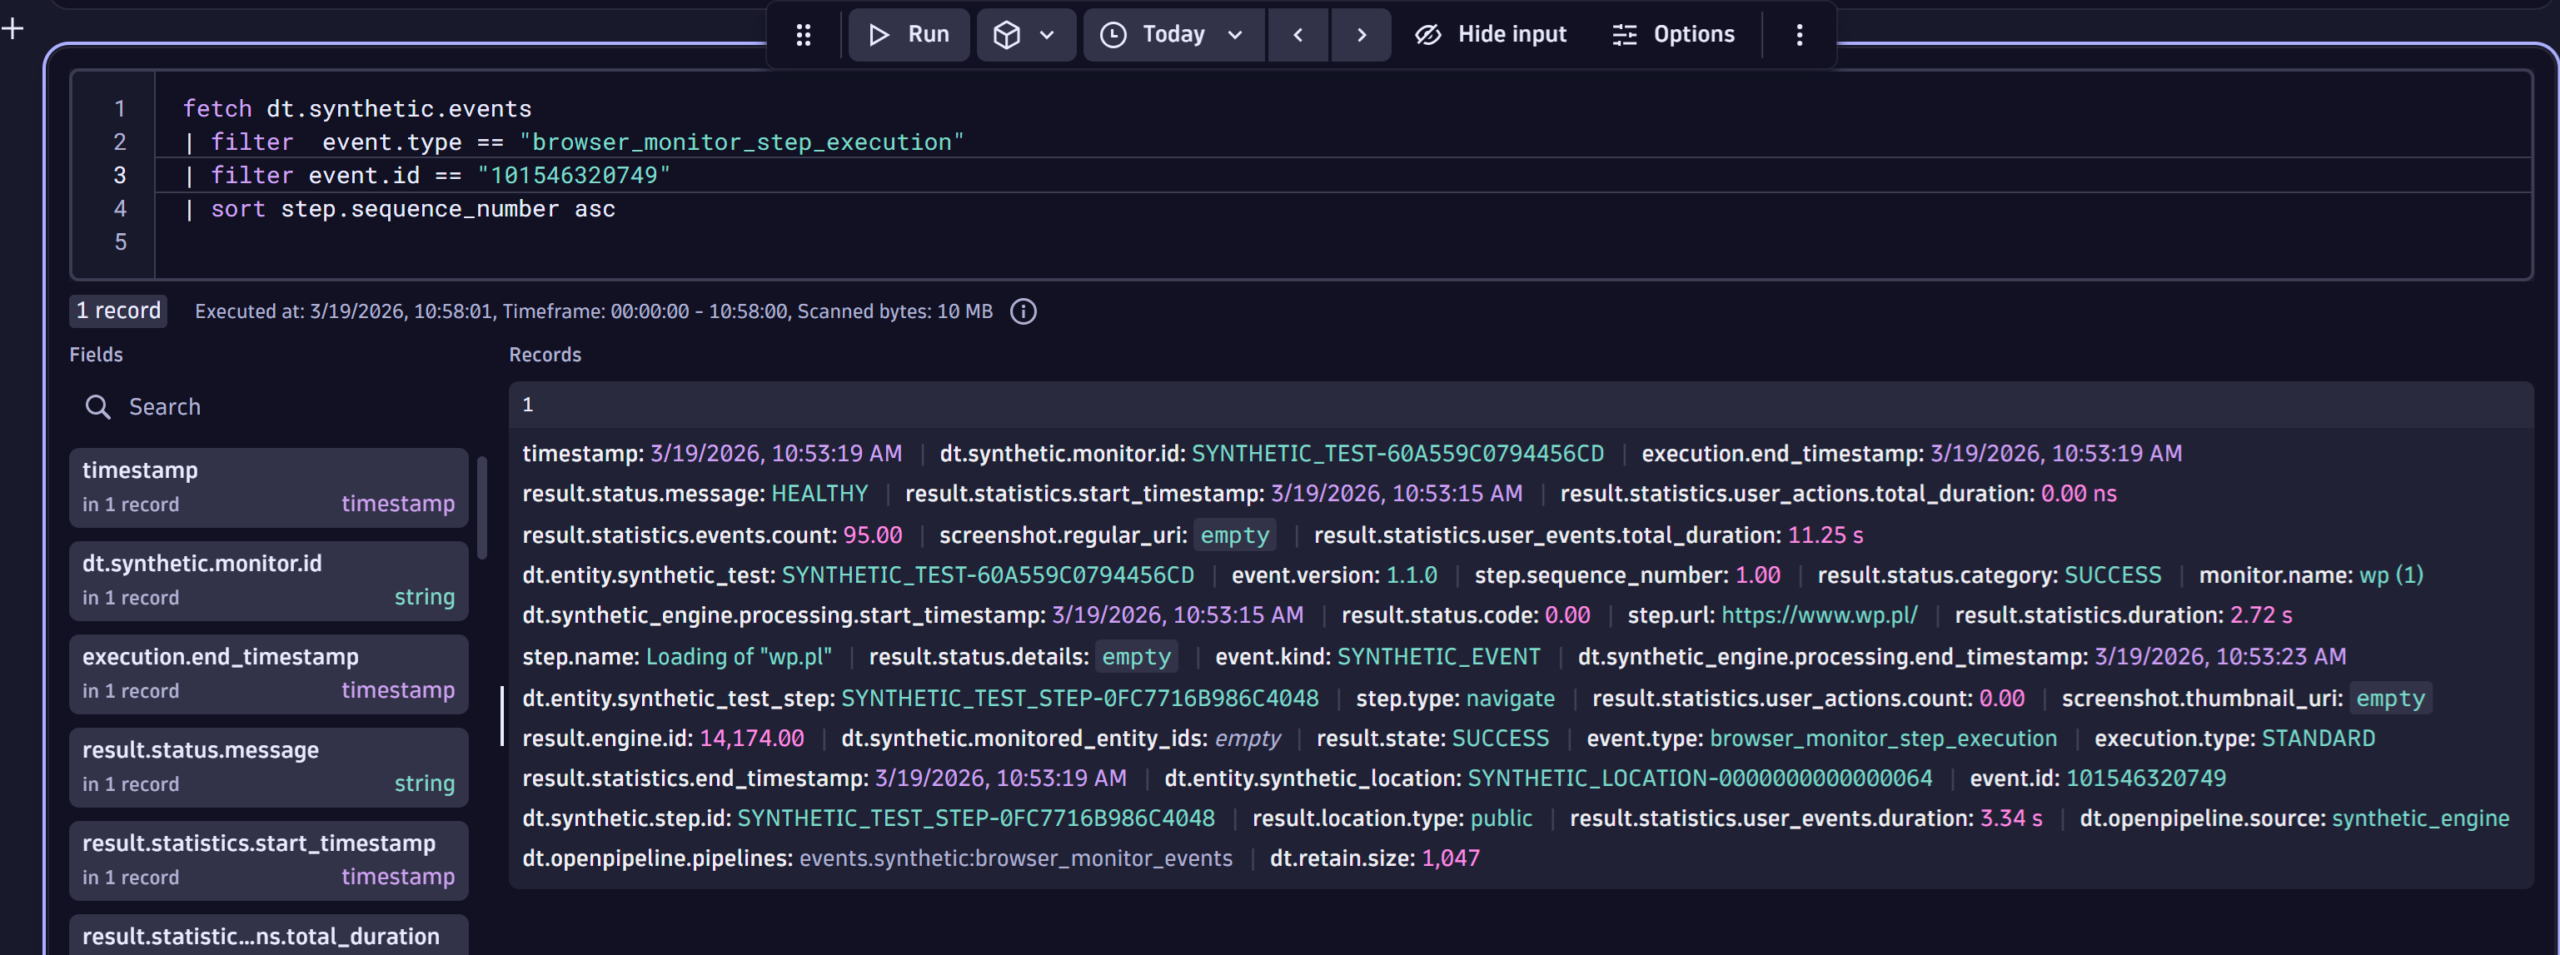
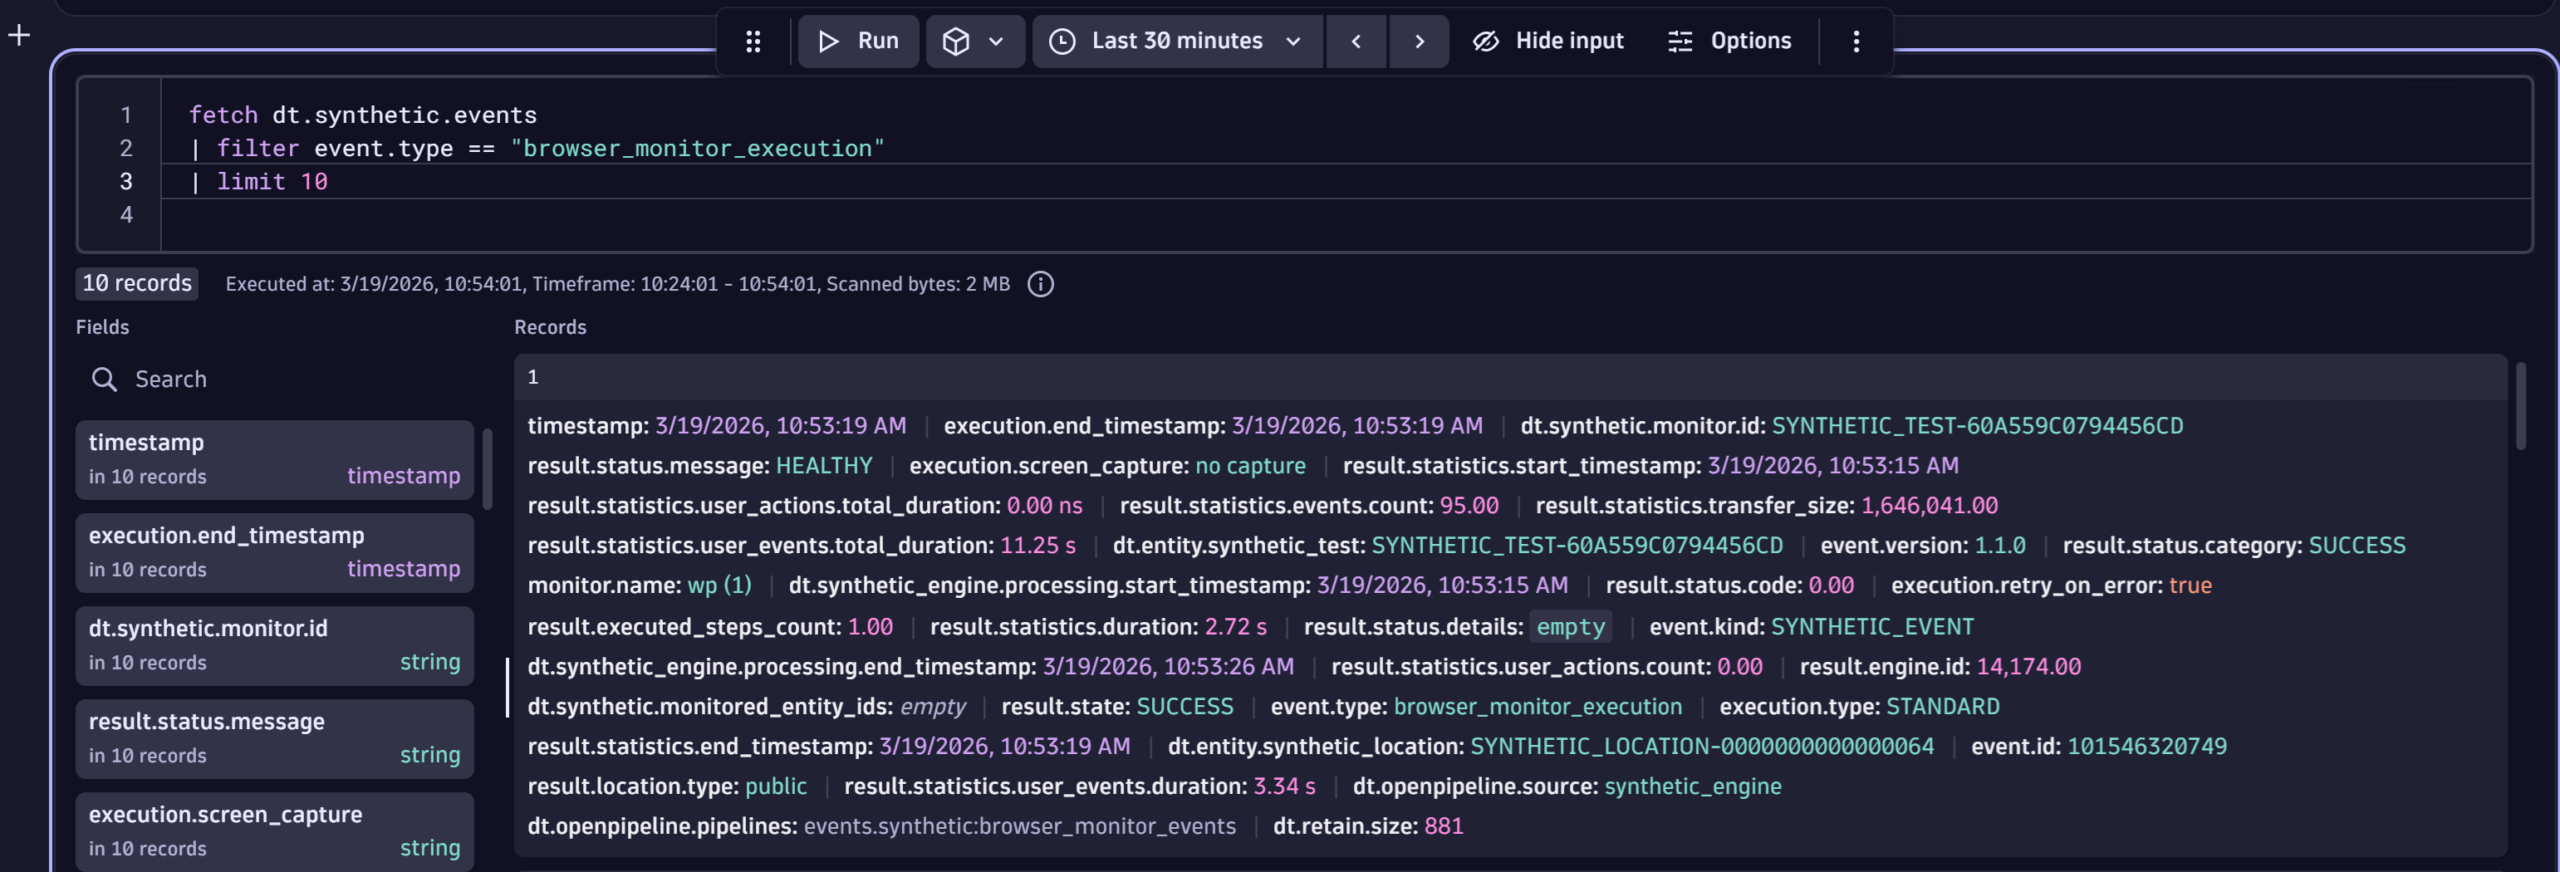
- Synthetic events give you execution-level context (monitor‑wide status, availability, and problems) and step‑level details (step duration, screenshots, errors). Use DQL to filter and aggregate executions by location, time frame, or error type for fast root‑cause discovery and trend analysis.
FETCH DT.SYNTHETIC.EVENTS
| FILTER EVENT.TYPE == "BROWSER_MONITOR_EXECUTION"
| LIMIT 10
FETCH DT.SYNTHETIC.EVENTS
| FILTER  EVENT.TYPE == "BROWSER_MONITOR_STEP_EXECUTION"
| FILTER EVENT.ID == "101546320749"
| SORT STEP.SEQUENCE_NUMBER ASC
- User events provide resource-level details for each asset loaded during a browser monitor execution (resource type, name, load duration, initiator, render-blocking status). Query these to isolate all or very specific failing resources and to detect lazy load patterns or third-party script behavior proactively
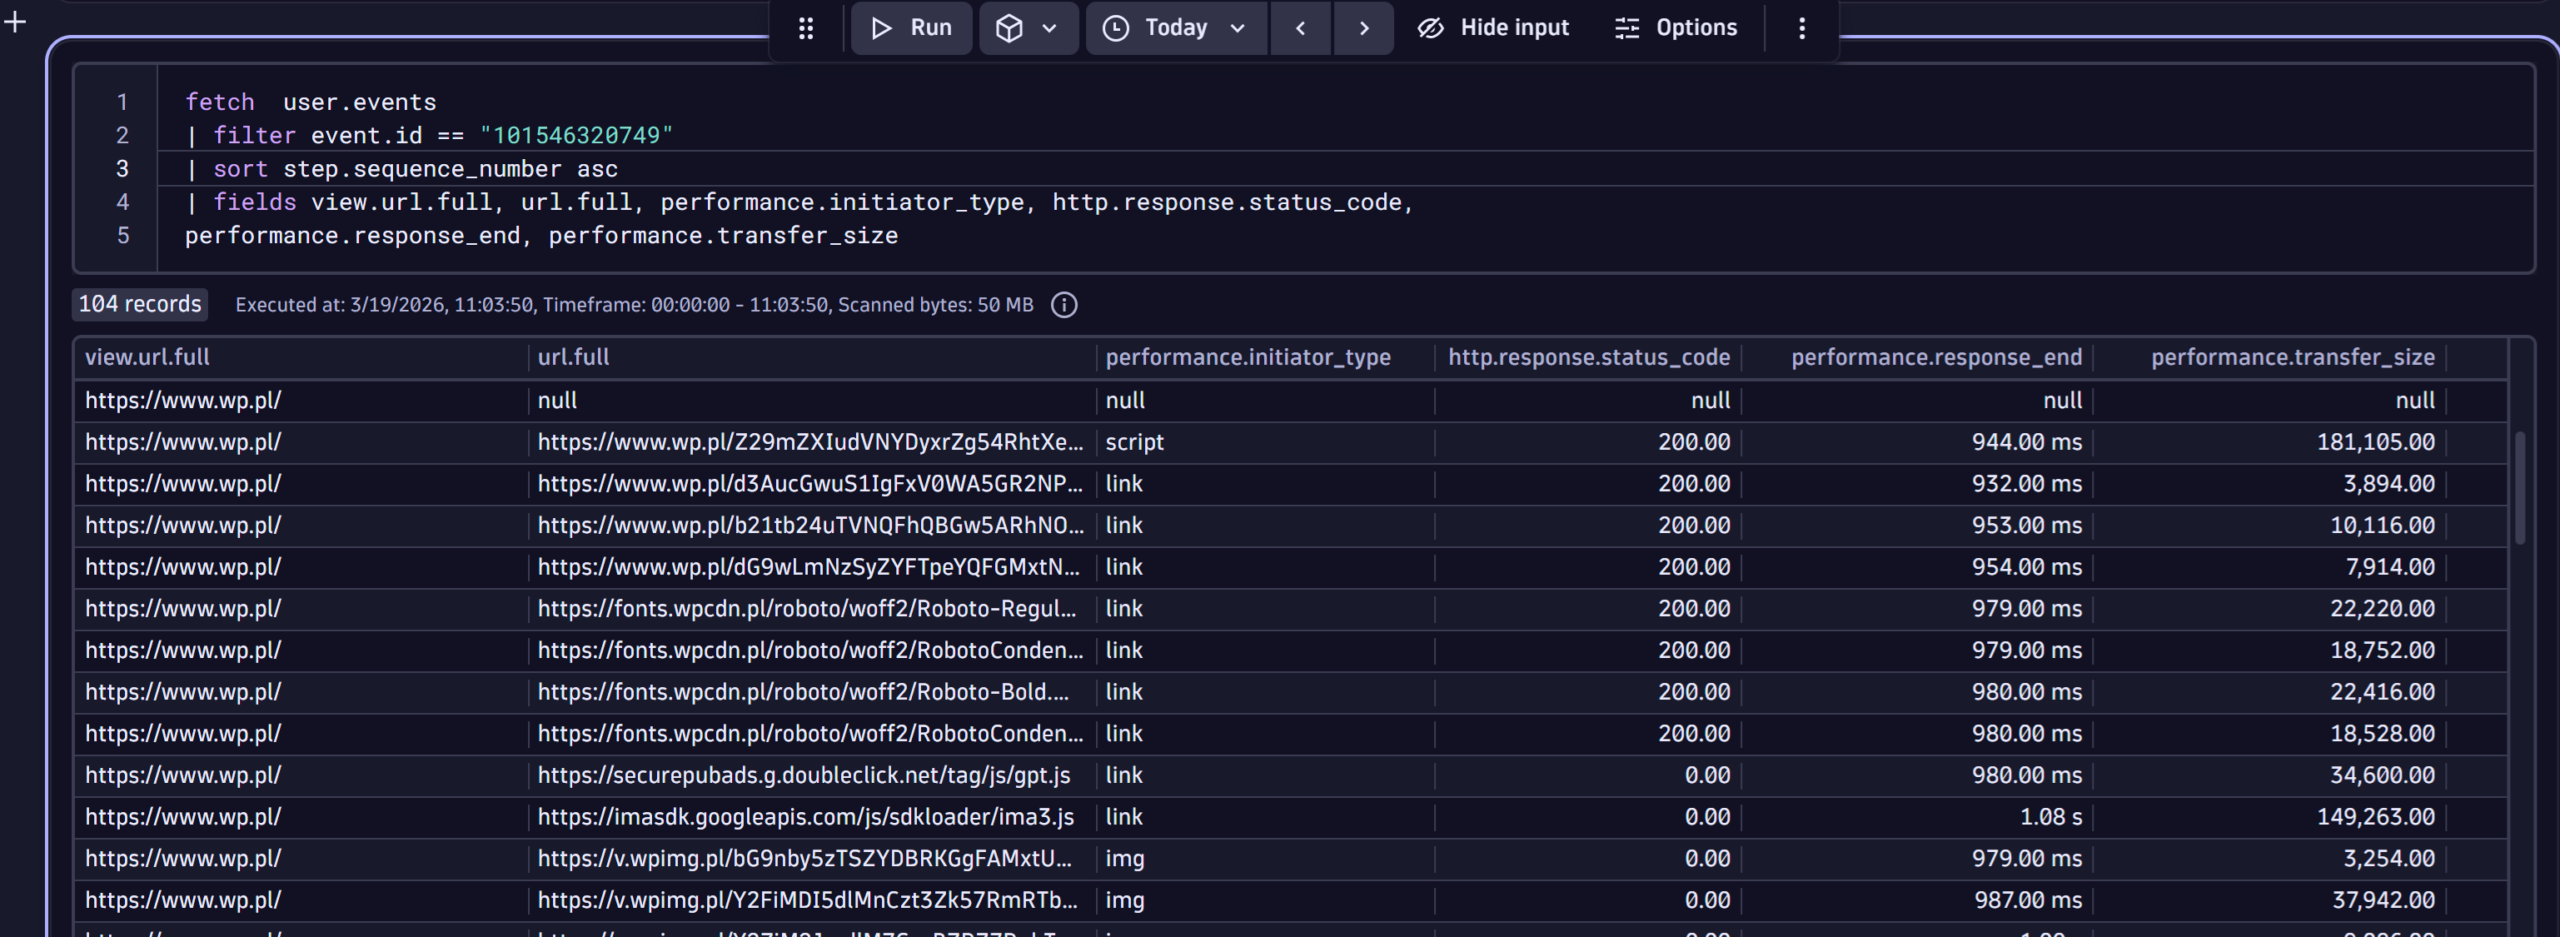
FETCH  USER.EVENTS
| FILTER EVENT.ID == "101546320749"
| SORT STEP.SEQUENCE_NUMBER ASC
| FIELDS VIEW.URL.FULL, URL.FULL, PERFORMANCE.INITIATOR_TYPE, HTTP.RESPONSE.STATUS_CODE,
PERFORMANCE.RESPONSE_END, PERFORMANCE.TRANSFER_SIZE
- Because execution details are available in Grail, you can build automations and workflows that react to synthetic outcomes; for example, alert enrichment, automated rollback, or validation steps in CI/CD, or ticket creation with execution context. A community product idea highlights demand for programmatic access to execution details via API as a practical automation enabler.
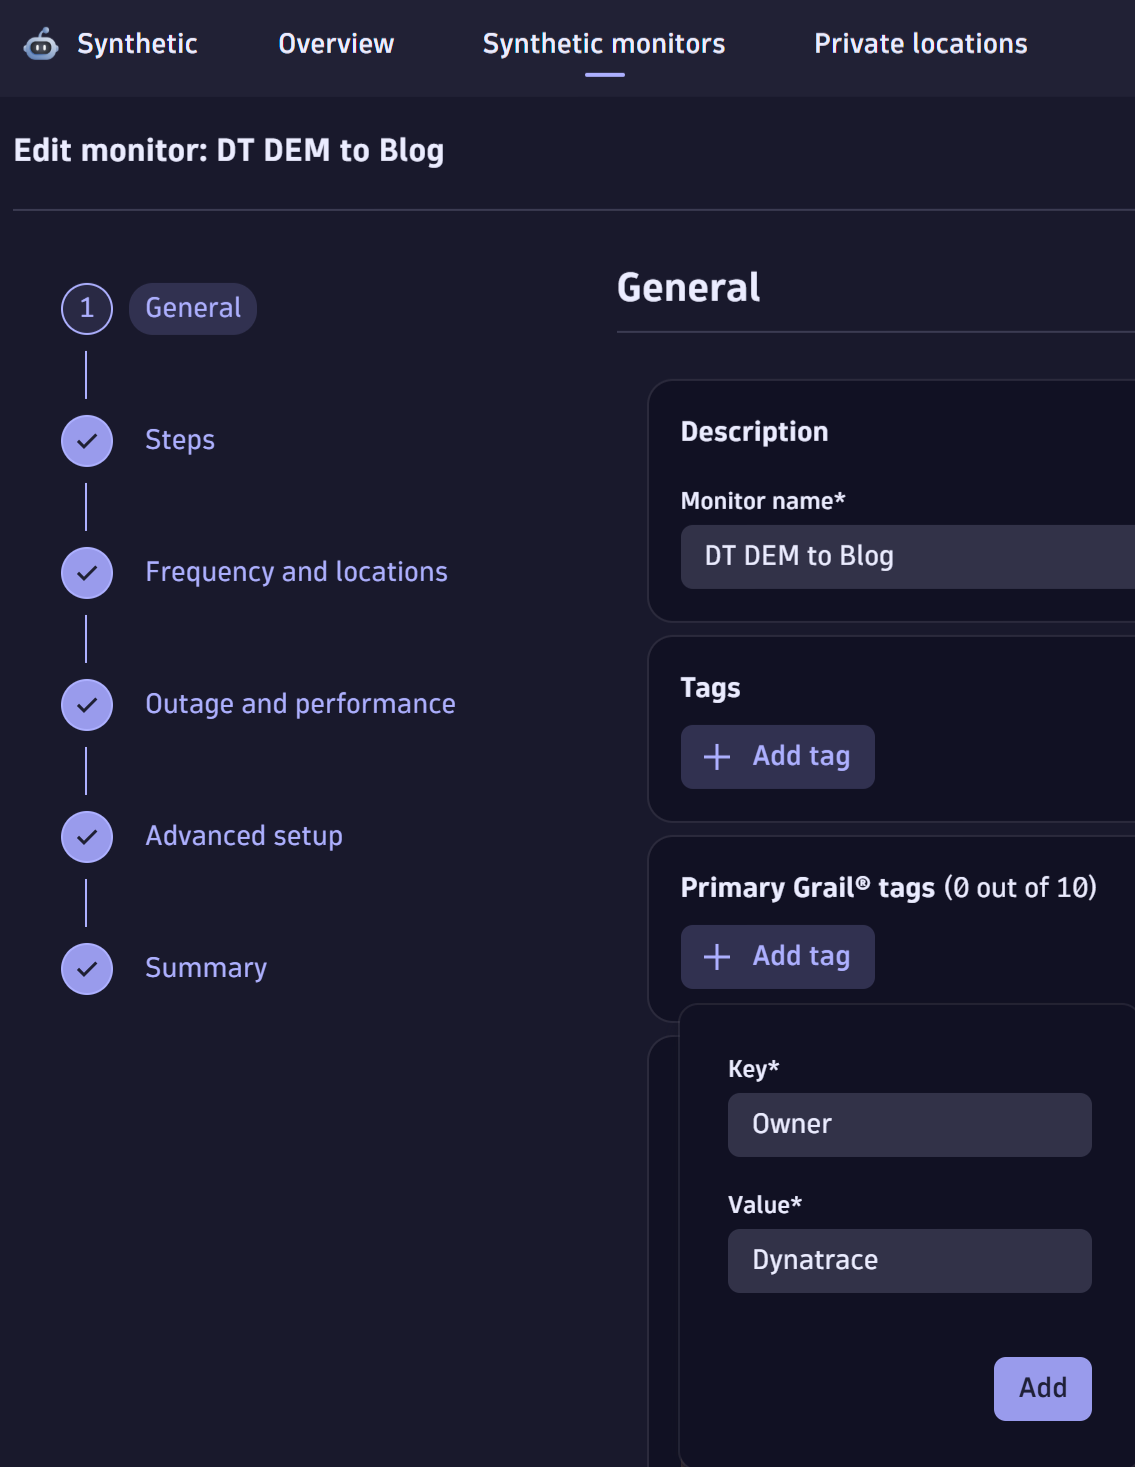
Enrichment of Synthetic data with primary Grail tags
To make DQL queries even more powerful, Grail can enrich synthetic events, user events, and the metrics that describe browser‑monitor executions with primary Grail tags. These are a small set of customer‑selected tags that Grail automatically attaches at ingest under the primary_tags.* prefix.
Why this matters for browser monitor telemetry
- Fast, consistent grouping: you can group executions, events, and metrics by business or operational dimensions (for example, primary_tags.team, primary_tags.app, primary_tags.environment) without adding ad‑hoc joins or expensive post‑processing.
- Precise filtering: filter DQL queries and dashboards by primary tags to focus on a particular team’s monitors, a specific application, or a cost center across Synthetic and RUM data in one query.
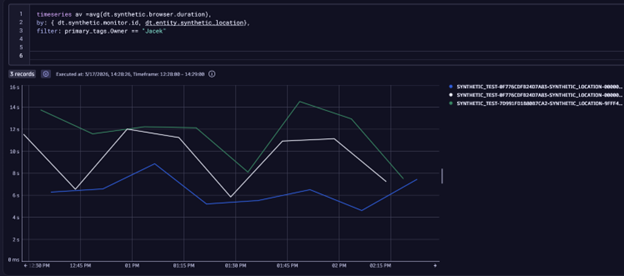
You can now set primary Grail tags per Synthetic monitor during creation or editing, so each monitor’s executions carry that metadata into Grail for queries and automations.
Take the next steps
Take the next step today: turn on the browser monitor experience in the latest Dynatrace and convert synthetic checks into actionable, searchable signals.
- Enable the browser monitor experience on the latest Dynatrace. Flip the new Browser Monitors Experience on to get the latest RUM JavaScript and enhanced reporting everywhere.
- Analyze with the modern Requests waterfall. Use the improved waterfall (fully in the Latest Dynatrace experience) to investigate executions at the resource level and pinpoint root causes faster.
- Leverage DQL and Grail. Query synthetic and RUM events to deepen analysis, build dashboards, and drive automations that react to real monitor outcomes. Check out this example Notebook in Dynatrace Playground to see DQL applied to Synthetic executions and error analysis.
What’s next
Expect improved access control capabilities to help you precisely limit who can view and act on Synthetic monitors and their results, making it easier to secure and share the right telemetry with the right teams.


Looking for answers?
Start a new discussion or ask for help in our Q&A forum.
Go to forum