
A lot of time has passed since the Dynatrace UFO was printed, assembled, installed, and hooked up with our Dynatrace Delivery Pipelines and Production Monitoring the first time. Since then, we have seen many folks around the world install their own UFOs, visualizing the quality of their delivery pipelines or the problems that Dynatrace Davis® has detected in their production environments. As the UFO is an Open Hardware & Open Source project, we’ve had people create their own UFOs in order to visualize stage or progress within their organization. Check out this awesome video: Dynatrace UFO controlled by a Mobile App.
A couple of weeks back as I was walking into my office in Linz Hafenstrasse, I spotted a new UFO. The UFO was sitting on a chair, propped against a wall right next door to where I have my desk. It turned out the UFO belonged to the Dynatrace Technical Support Team responsible for EMEA. During a coffee break, I walked over to Roman who is leading that team. I wanted to learn more about how his team is leveraging the UFO. As I assumed, they are not using it to monitor pipelines, quality gates or production issues!
What does the UFO tell the Support Team?
The support team is using Jira to handle support tickets. The team has different KPIs they are measured against, e.g: how fast a ticket gets assigned to an engineer and how fast we respond to certain types of tickets. To visualize these KPIs and the actual tickets that fall into these categories, the team is using a Jira Dashboard showing the current list of unassigned tickets grouped by severity, as well as escalated tickets grouped by SLA expiration status:
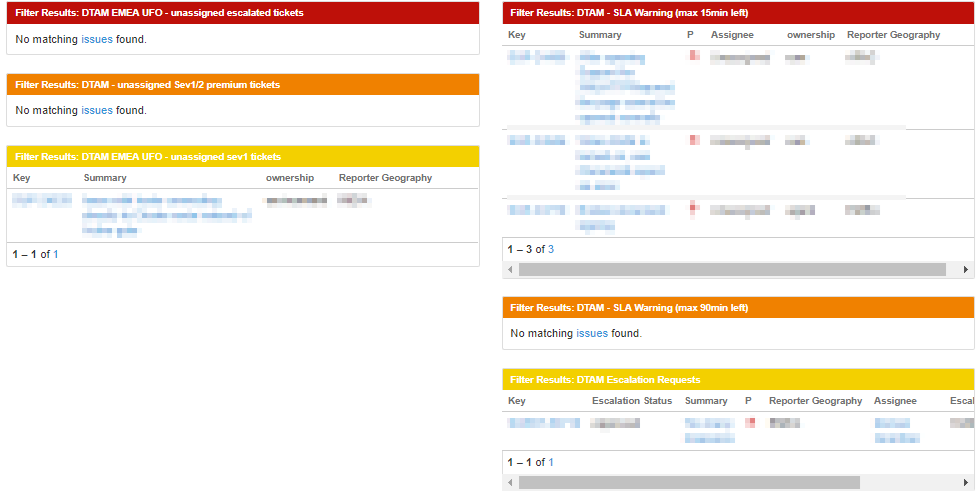
This is a great dashboard visualizing the things that are top of mind of the support team at this moment. However, not every engineer is constantly keeping an eye on this dashboard, as they need their screens for actively working on cases. Inspired by what the UFO did for other teams, the support team decided to install their own UFO to “radiate” these KPIs’ to the whole team.
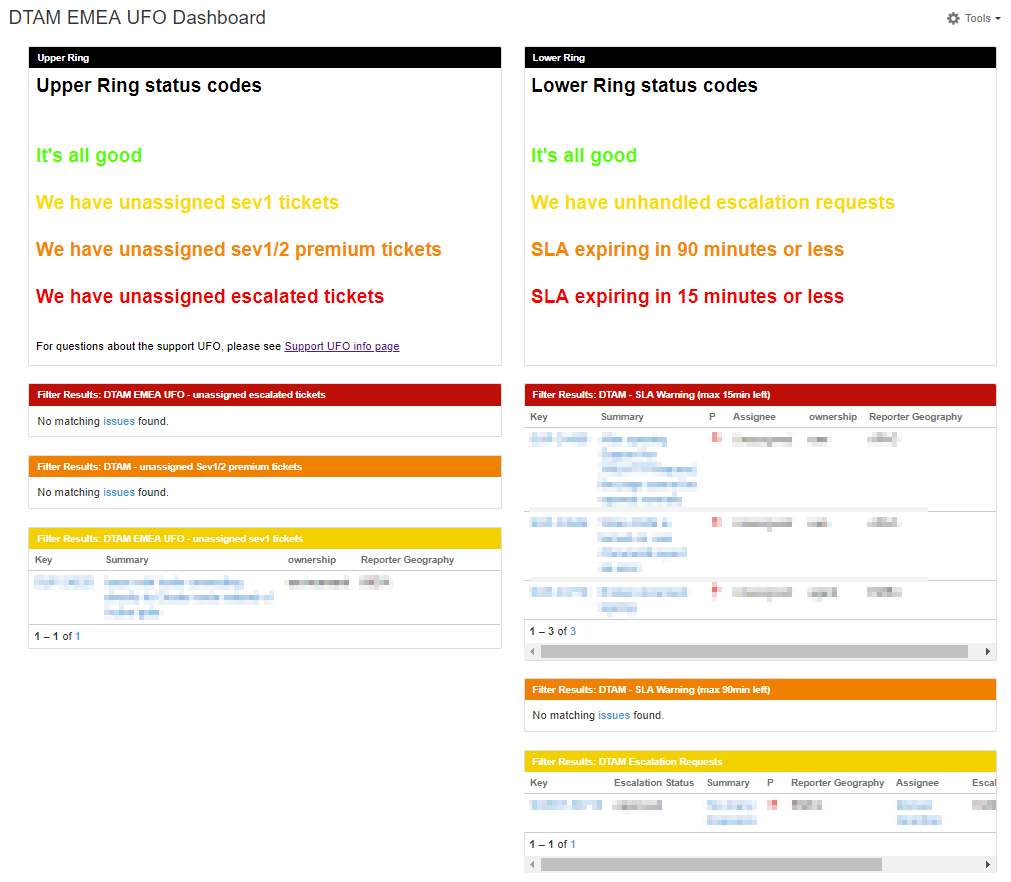
To make sure everyone understood what these colors actually mean, they extended their Jira dashboard with a brief description that looks like this:
Going Beyond Pipeline Metrics with the Dynatrace UFO
While we typically talk about visualizing delivery pipeline, production, and operations status, there is much more we can visualize with the Dynatrace UFO. I hope the use case from our friends in Tech Support reminds you that the UFO can be used to visualize pretty much any type of data, KPIs, progress indicators or status. The UFO has 34 RGB LEDs organized in two rows. Each LED can be accessed individually and supports 256 colors, morphing between colors as well as rotating the colors on each ring. If you want to learn more about the UFO have a look at the following resources:
- Getting Started with the UFO and its API (Blog)
- Dynatrace UFO GitHub Page
- Order your own UFO via Dynatrace.com
Thanks, Roman. All the best with the UFO and hopefully it will show mostly green! 😊


Looking for answers?
Start a new discussion or ask for help in our Q&A forum.
Go to forum