

This series covers recent Dynatrace releases and updates, focusing on what’s new, what’s changed, and how these recent enhancements can benefit you and your organization. Each post covers newly available capabilities and where to explore them.
This edition covers updates rolled out in August. Together they bring changes for database troubleshooting, Kubernetes metadata, AI security, edge component updates, data enrichment, agentic Assist, and cross-app navigation.
If you want to see August updates and releases in action, head over to our Release Radar launchpad on the Dynatrace Playground.
Dynatrace Assist conversation starters go agentic
Sprint 346 automatically upgrades the conversation starters embedded across Dynatrace apps from generative to agentic AI. Instead of retrieving and summarizing an answer, Dynatrace Assist can now use available tools and live environment context to help investigate and analyze issues, using the same entry points you already use today.
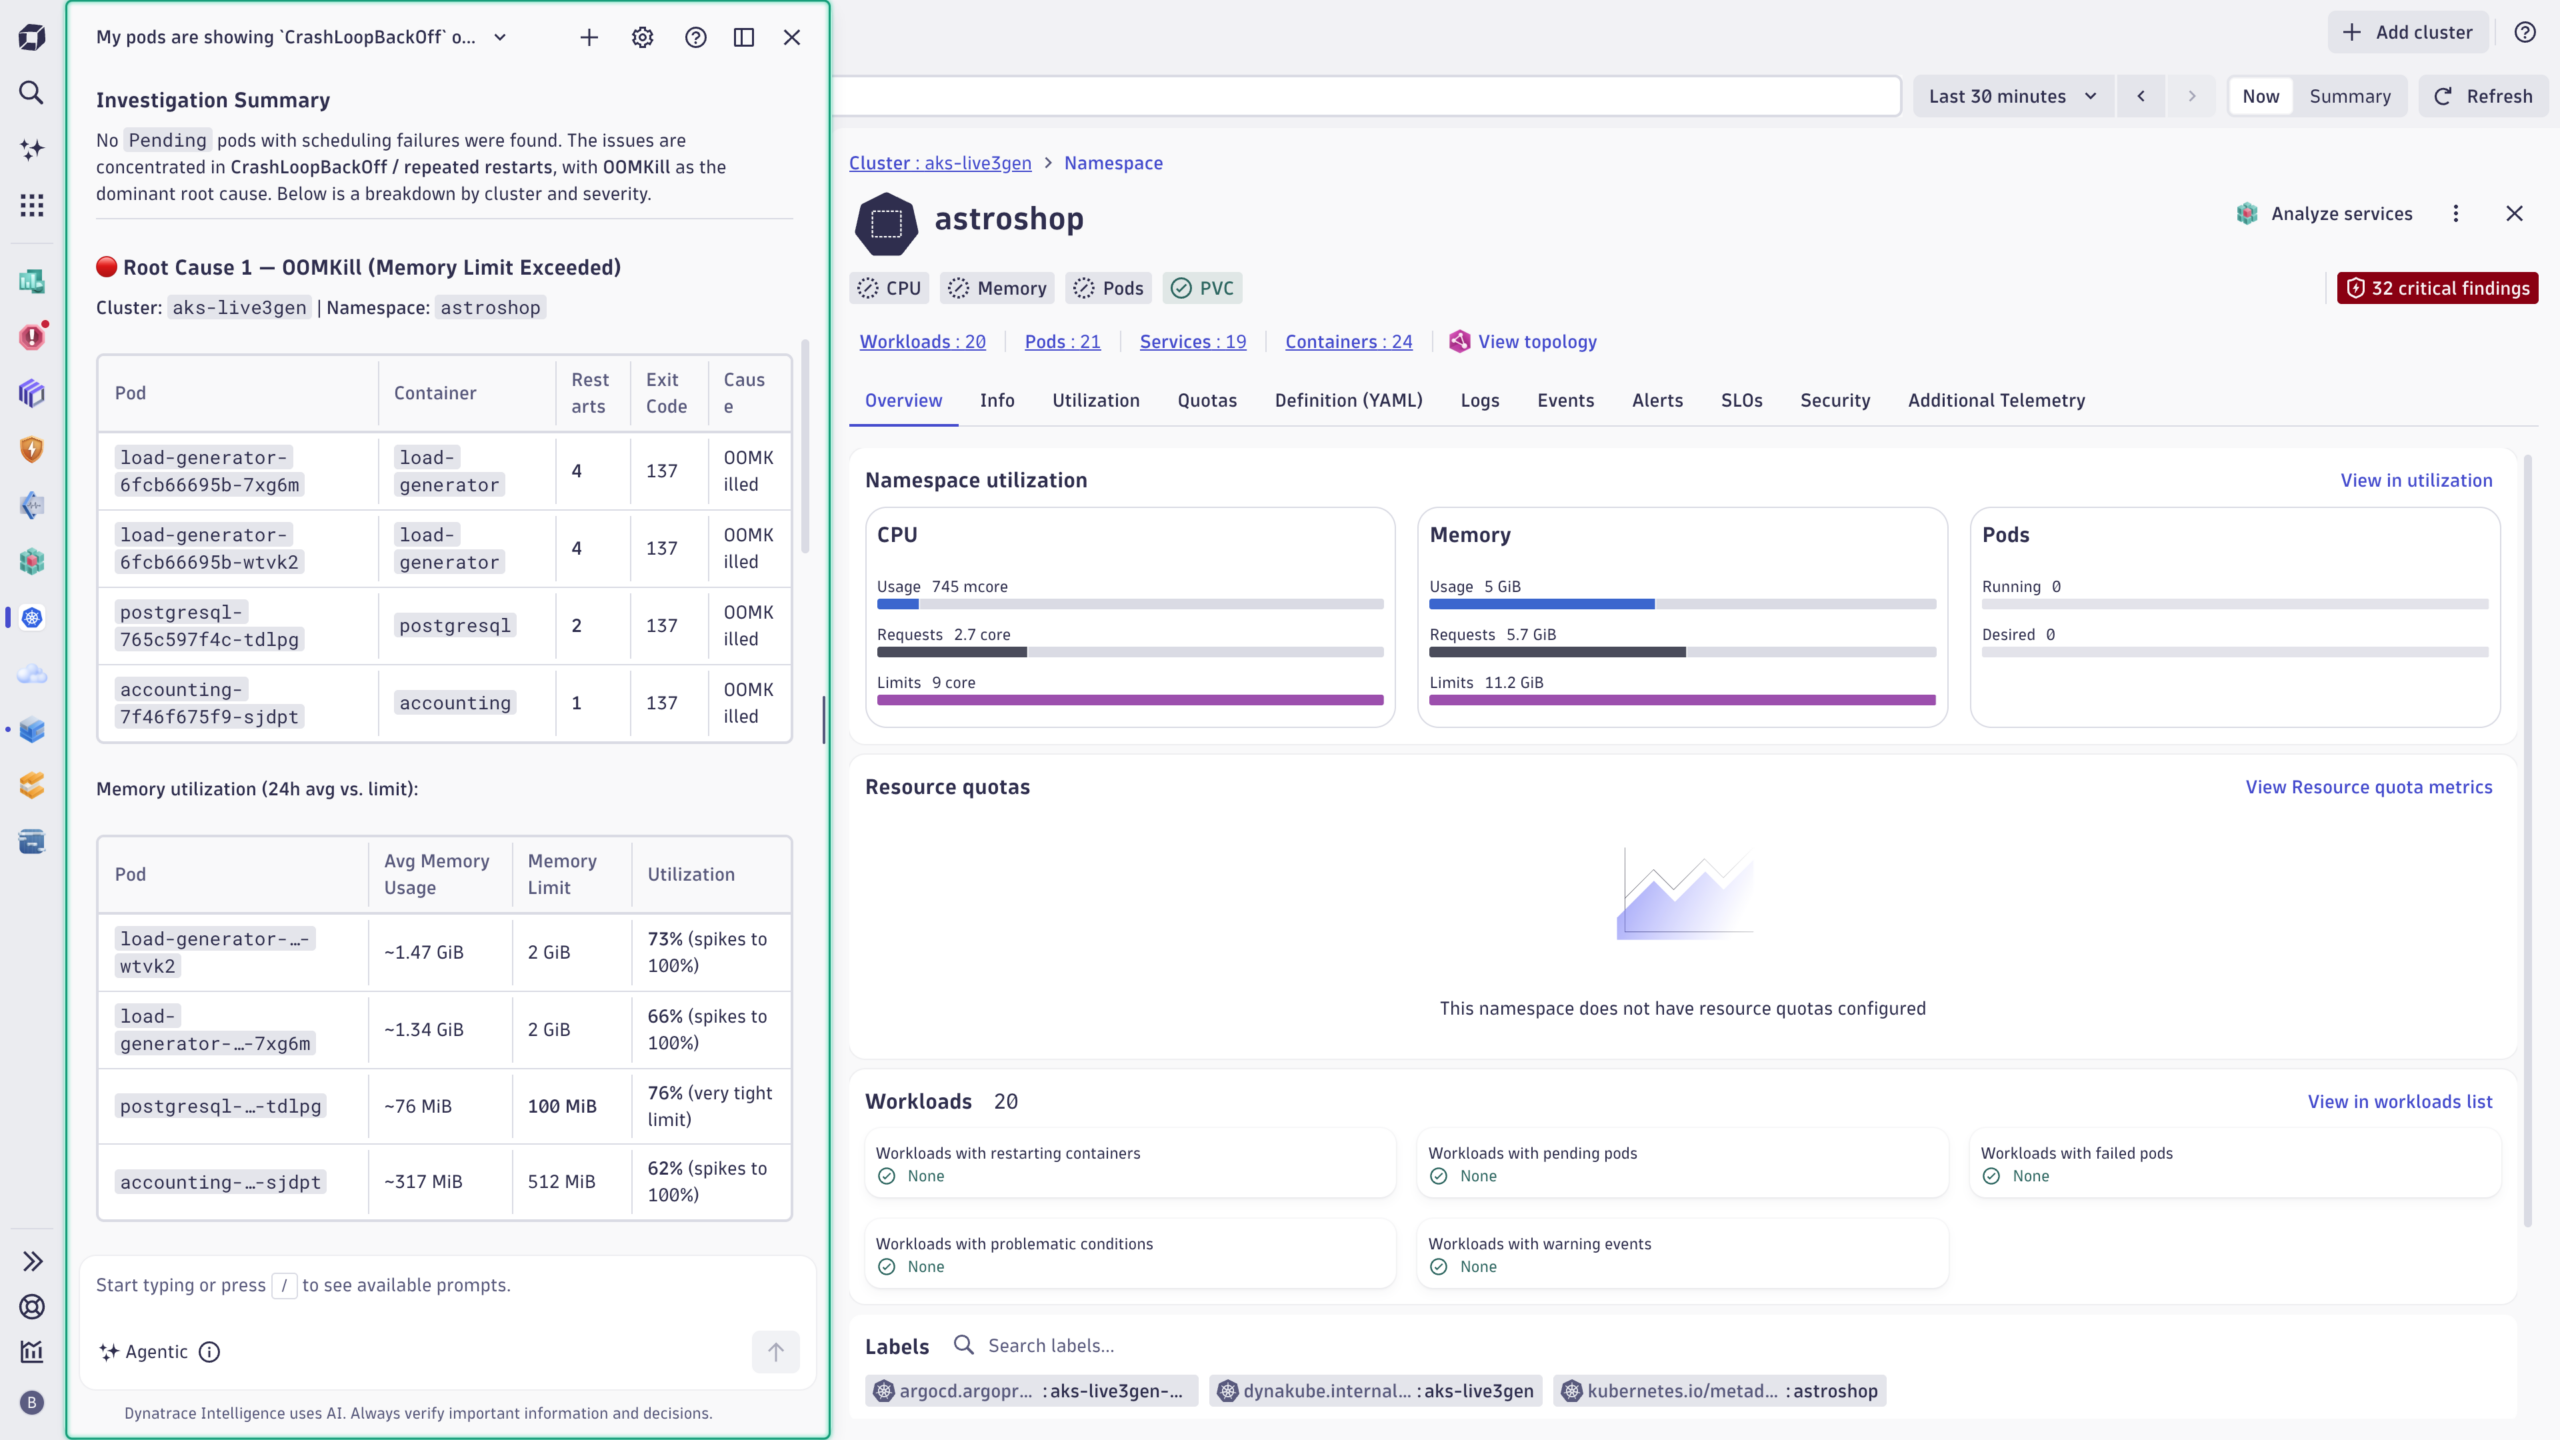
No setup is required beyond turning on Agentic AI in your environment settings. Existing starters upgrade in place, each still framed by the prompt and context defined by the originating app. If a conversation runs into personally identifiable information (PII) blocking, admins can now configure which PII patterns to block.
OpenPipeline adds inline lookups for simpler enrichment
The new Inline lookup processor maps an existing attribute to a new or updated value using a lookup table you define directly inside an OpenPipeline pipeline, no external system required. Use it for common enrichment tasks, such as adding a description for an error code, mapping an app ID to a business unit or cost center, or attaching security context based on an existing attribute, instead of writing a custom DQL statement for each case.
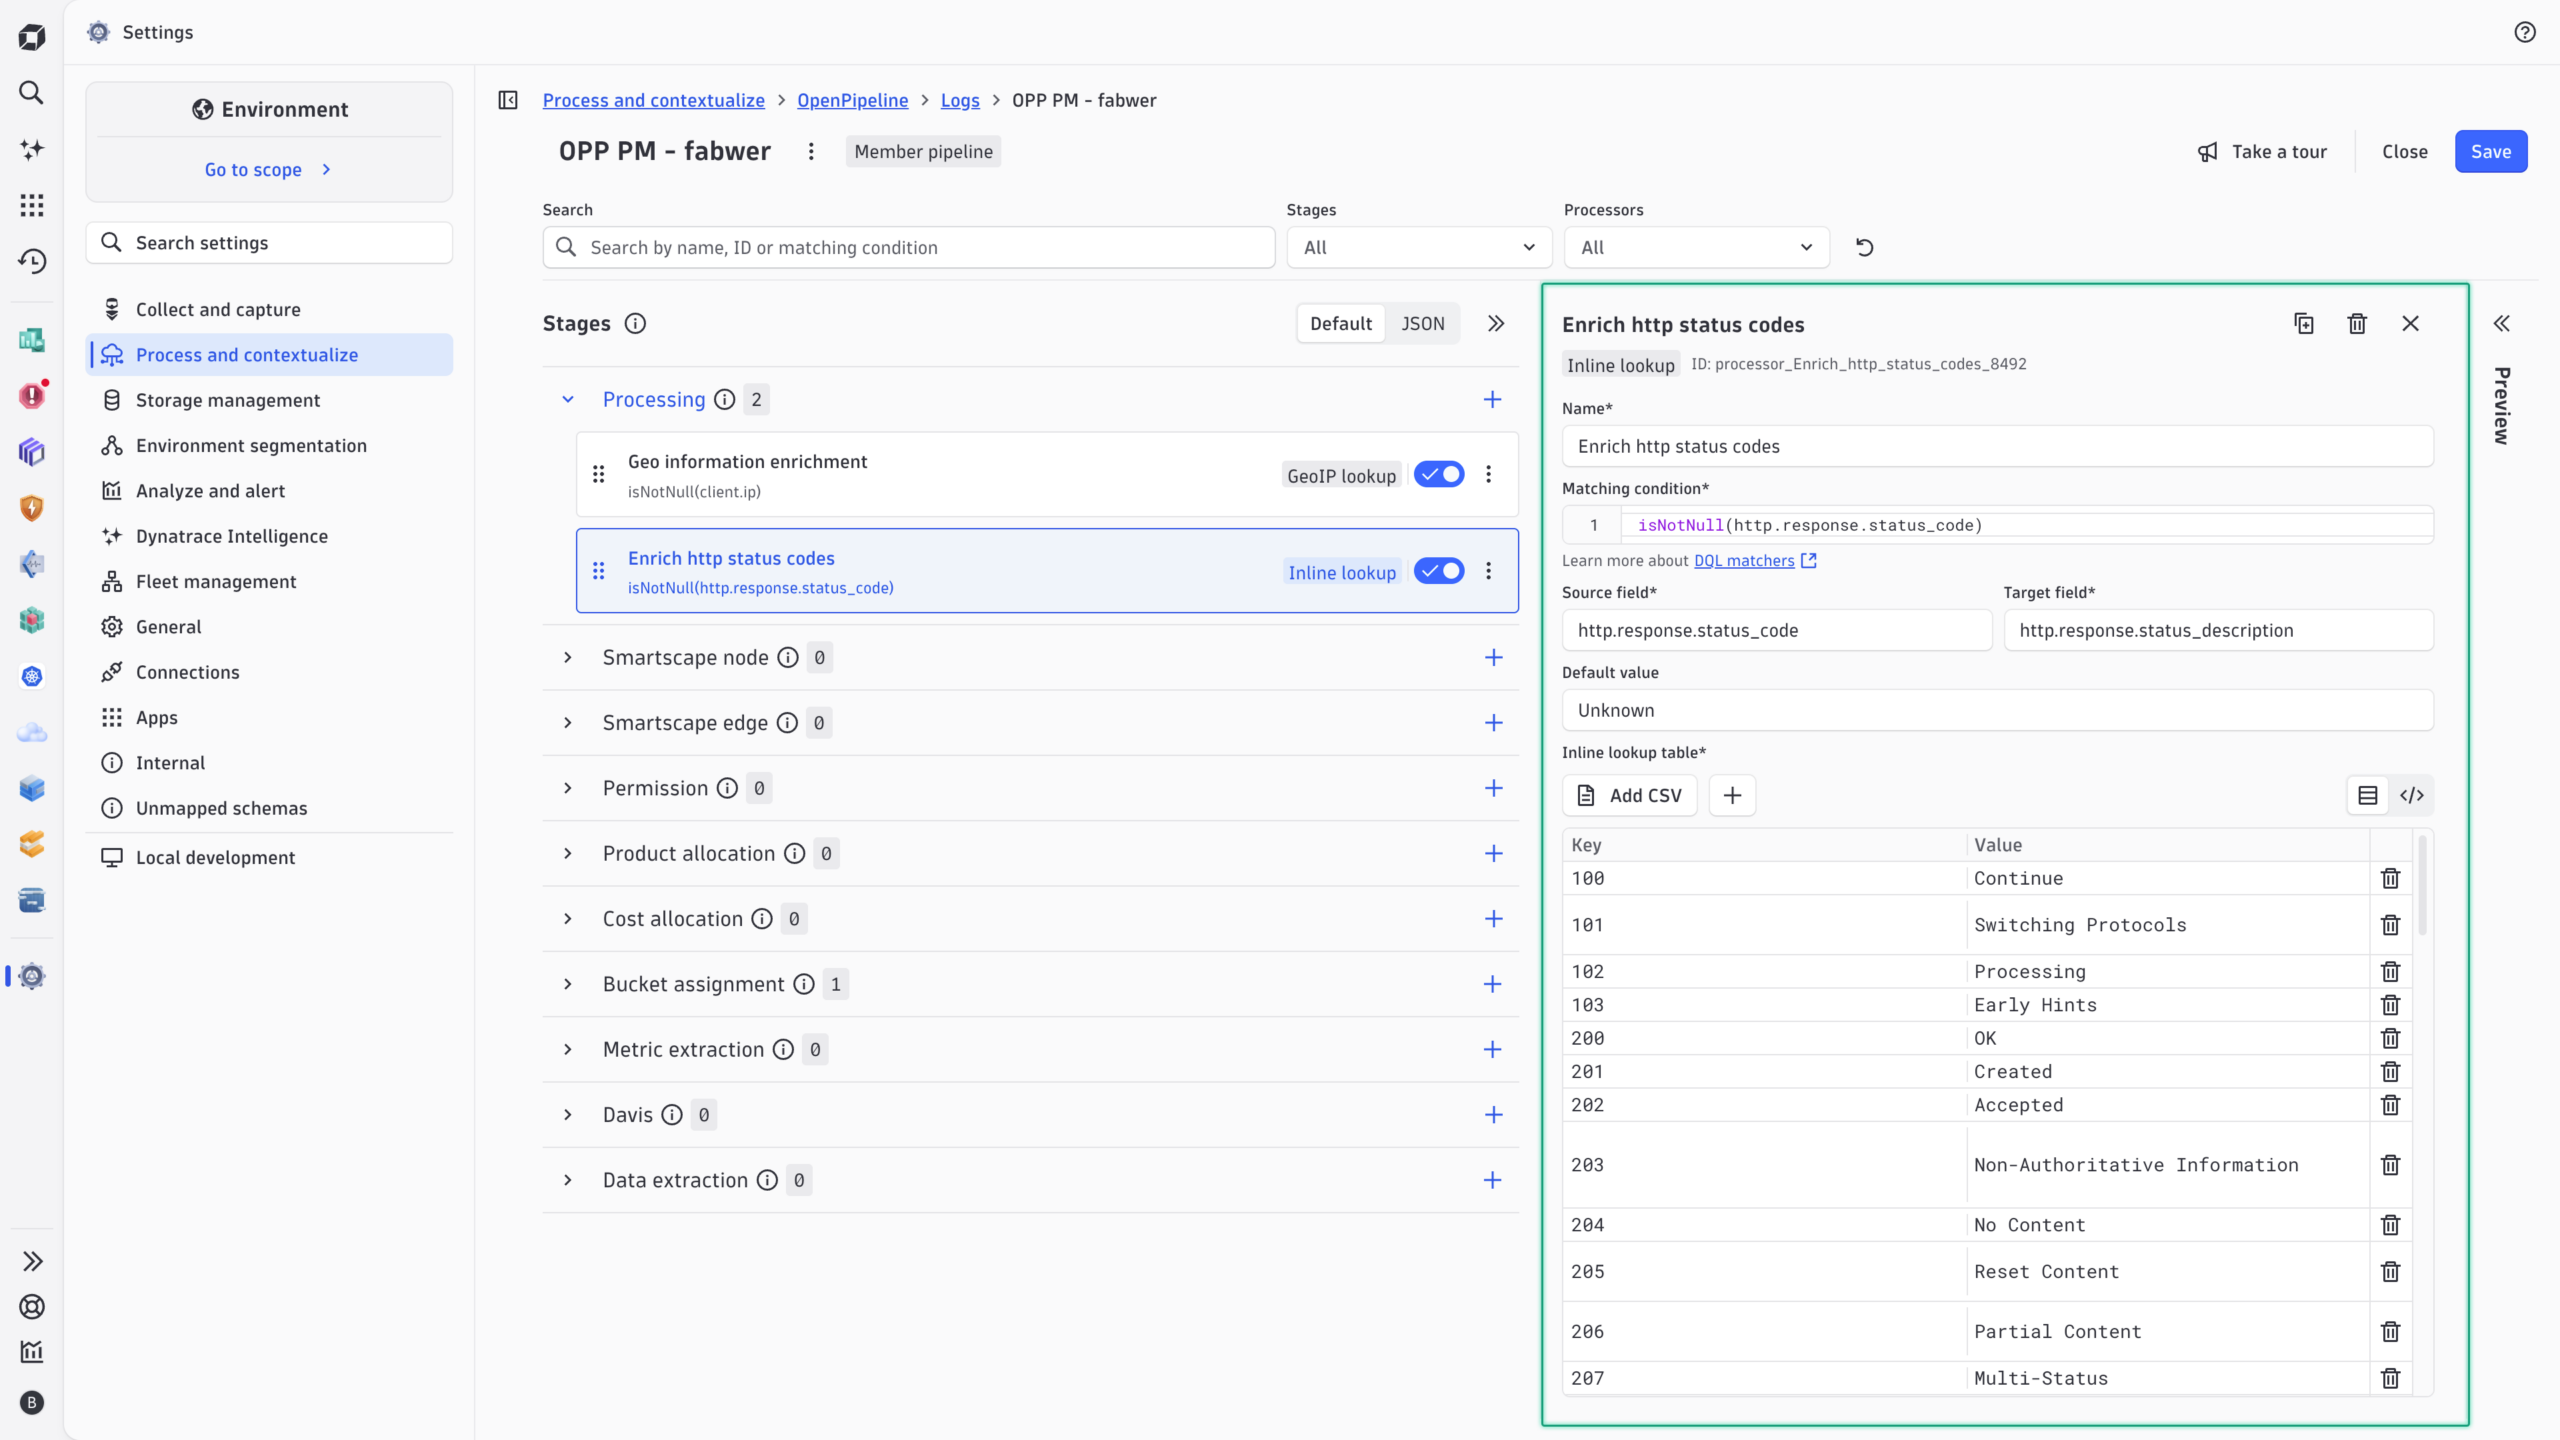
This keeps enrichment logic visible and maintainable directly in the pipeline. For more on turning raw data into structured, queryable fields at ingestion, see Transforming any log source into actionable insights with Dynatrace OpenPipeline.
AI security adds automated vulnerability alerts and a workload-risk skill
Two changes bring security response closer to your AI services.
The Notify on New Critical & High Vulnerabilities workflow template monitors your generative AI services for new critical and high vulnerabilities and sends a Slack alert as soon as one appears, with a breakdown of affected services, vulnerable components, and direct links to the Vulnerabilities and AI Observability apps. Install the template, connect Slack, and turn on the schedule trigger for continuous coverage without manual checks.
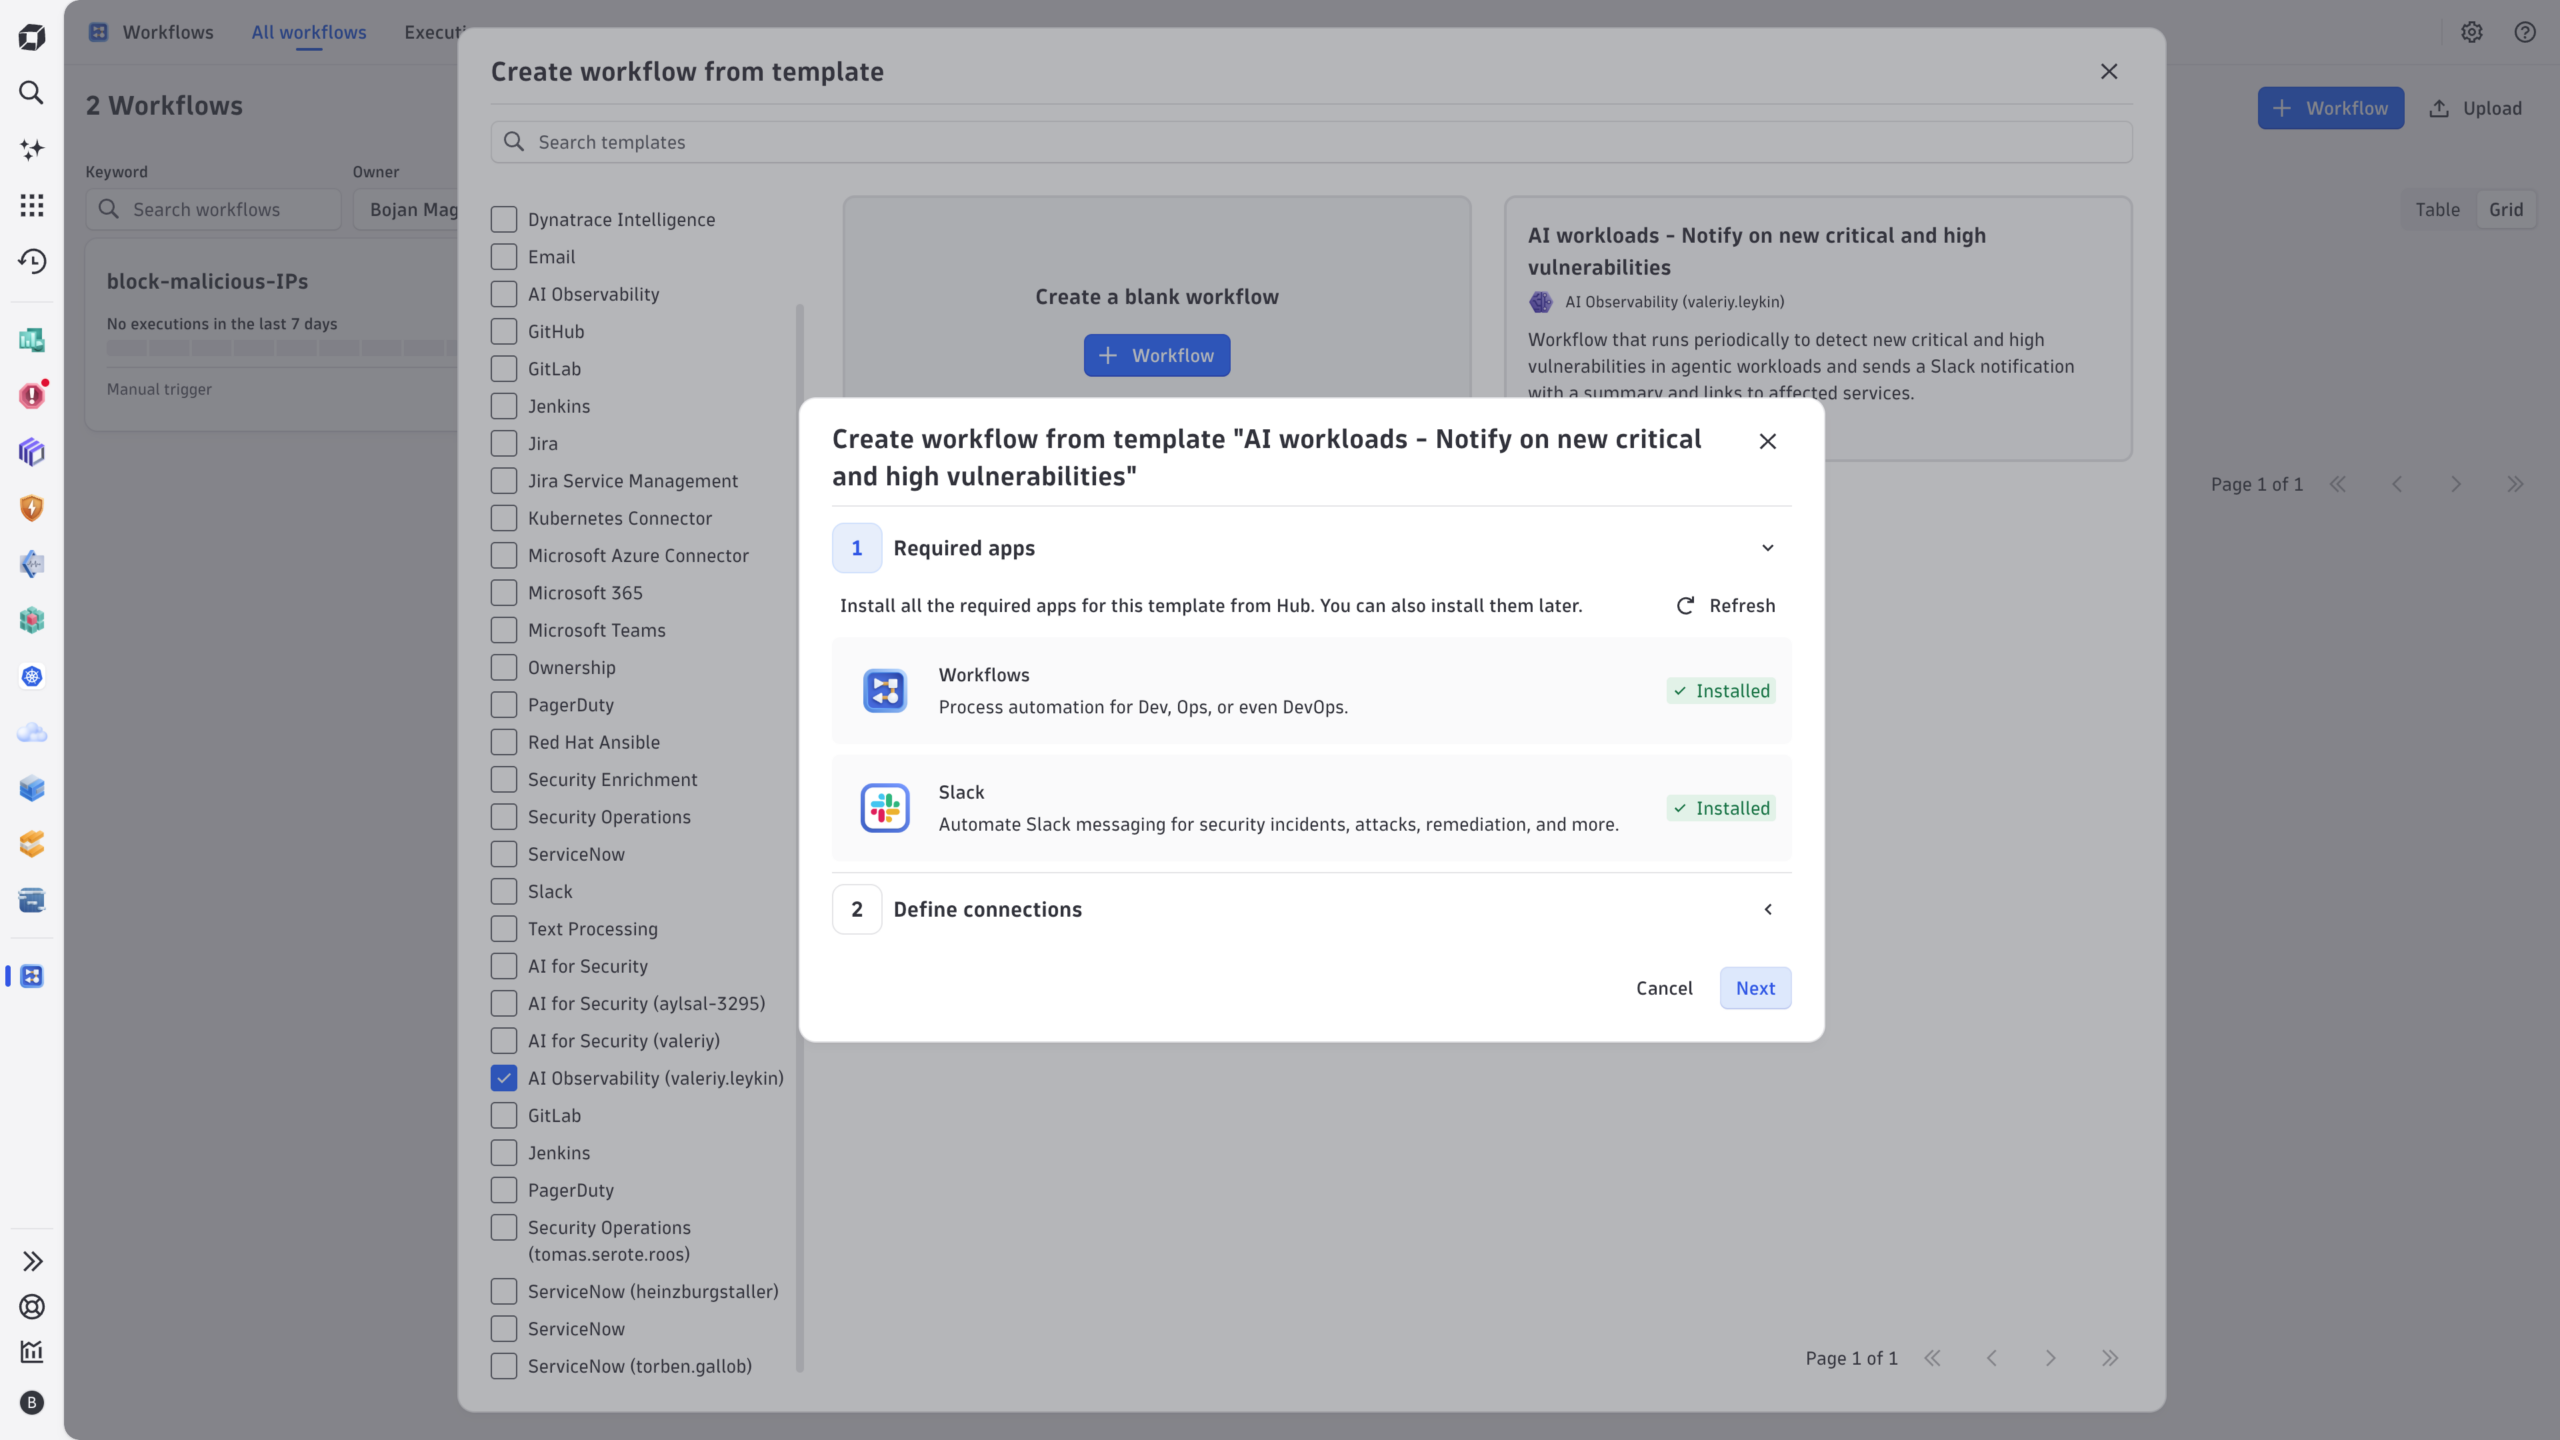
The dt-sec-insights Assist skill now returns vulnerable services identified by Dynatrace monitoring and analysis within the monitored GenAI environment or tells you that none were identified.
Kubernetes gets a centralized tagging strategy
A new tagging strategy lets you manage metadata enrichment for all telemetry from one place, instead of configuring it per data source. You can:
- Define custom key-value pairs as primary tags.
- Derive primary tags from Kubernetes namespace annotations and labels.
- Resolve and attach domain tags.
- Set fields such as security context, cost center, and cost product.
- Enrich key-value pairs directly through DynaKube resource attributes with Dynatrace Operator.
The configuration covers Kubernetes signals and host and process signals from OneAgent today, with cloud signal enrichment planned for a later release. Consistent tags mean cleaner cost reports, cleaner ownership data, and fewer one-off mapping rules to maintain.
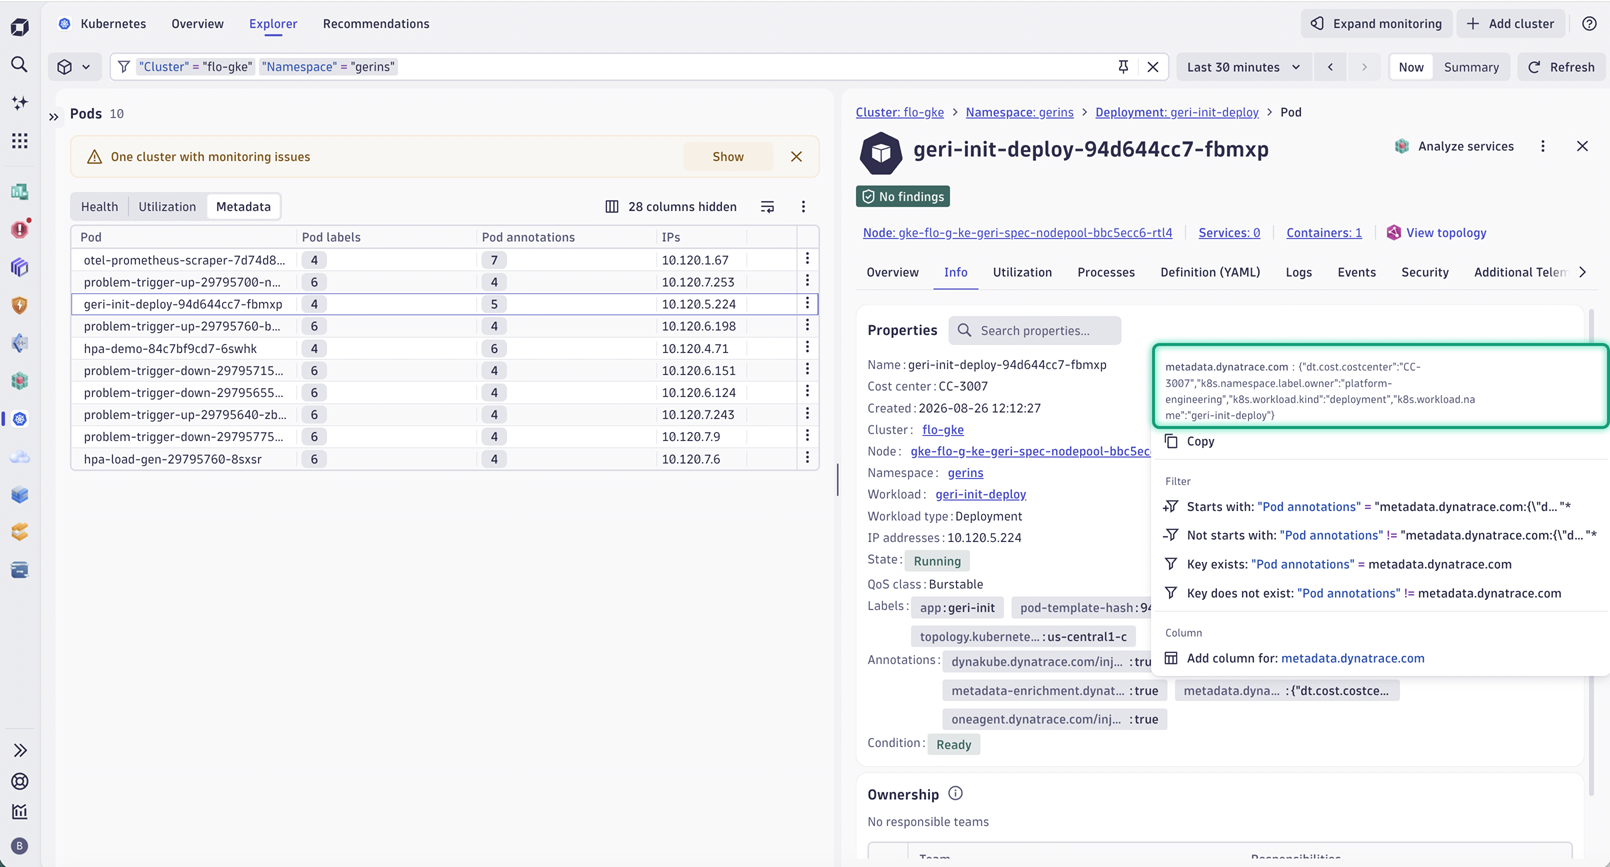
For details, see Metadata enrichment of all telemetry originating from Kubernetes and Enrichment of OneAgent telemetry. Consistent, well-structured metadata also informs AI agents about accurate ownership and cost. See Why AI agents need an AI lakehouse in the modern enterprise.
Infrastructure & Operations links directly to Logs, Clouds, Kubernetes, and Services
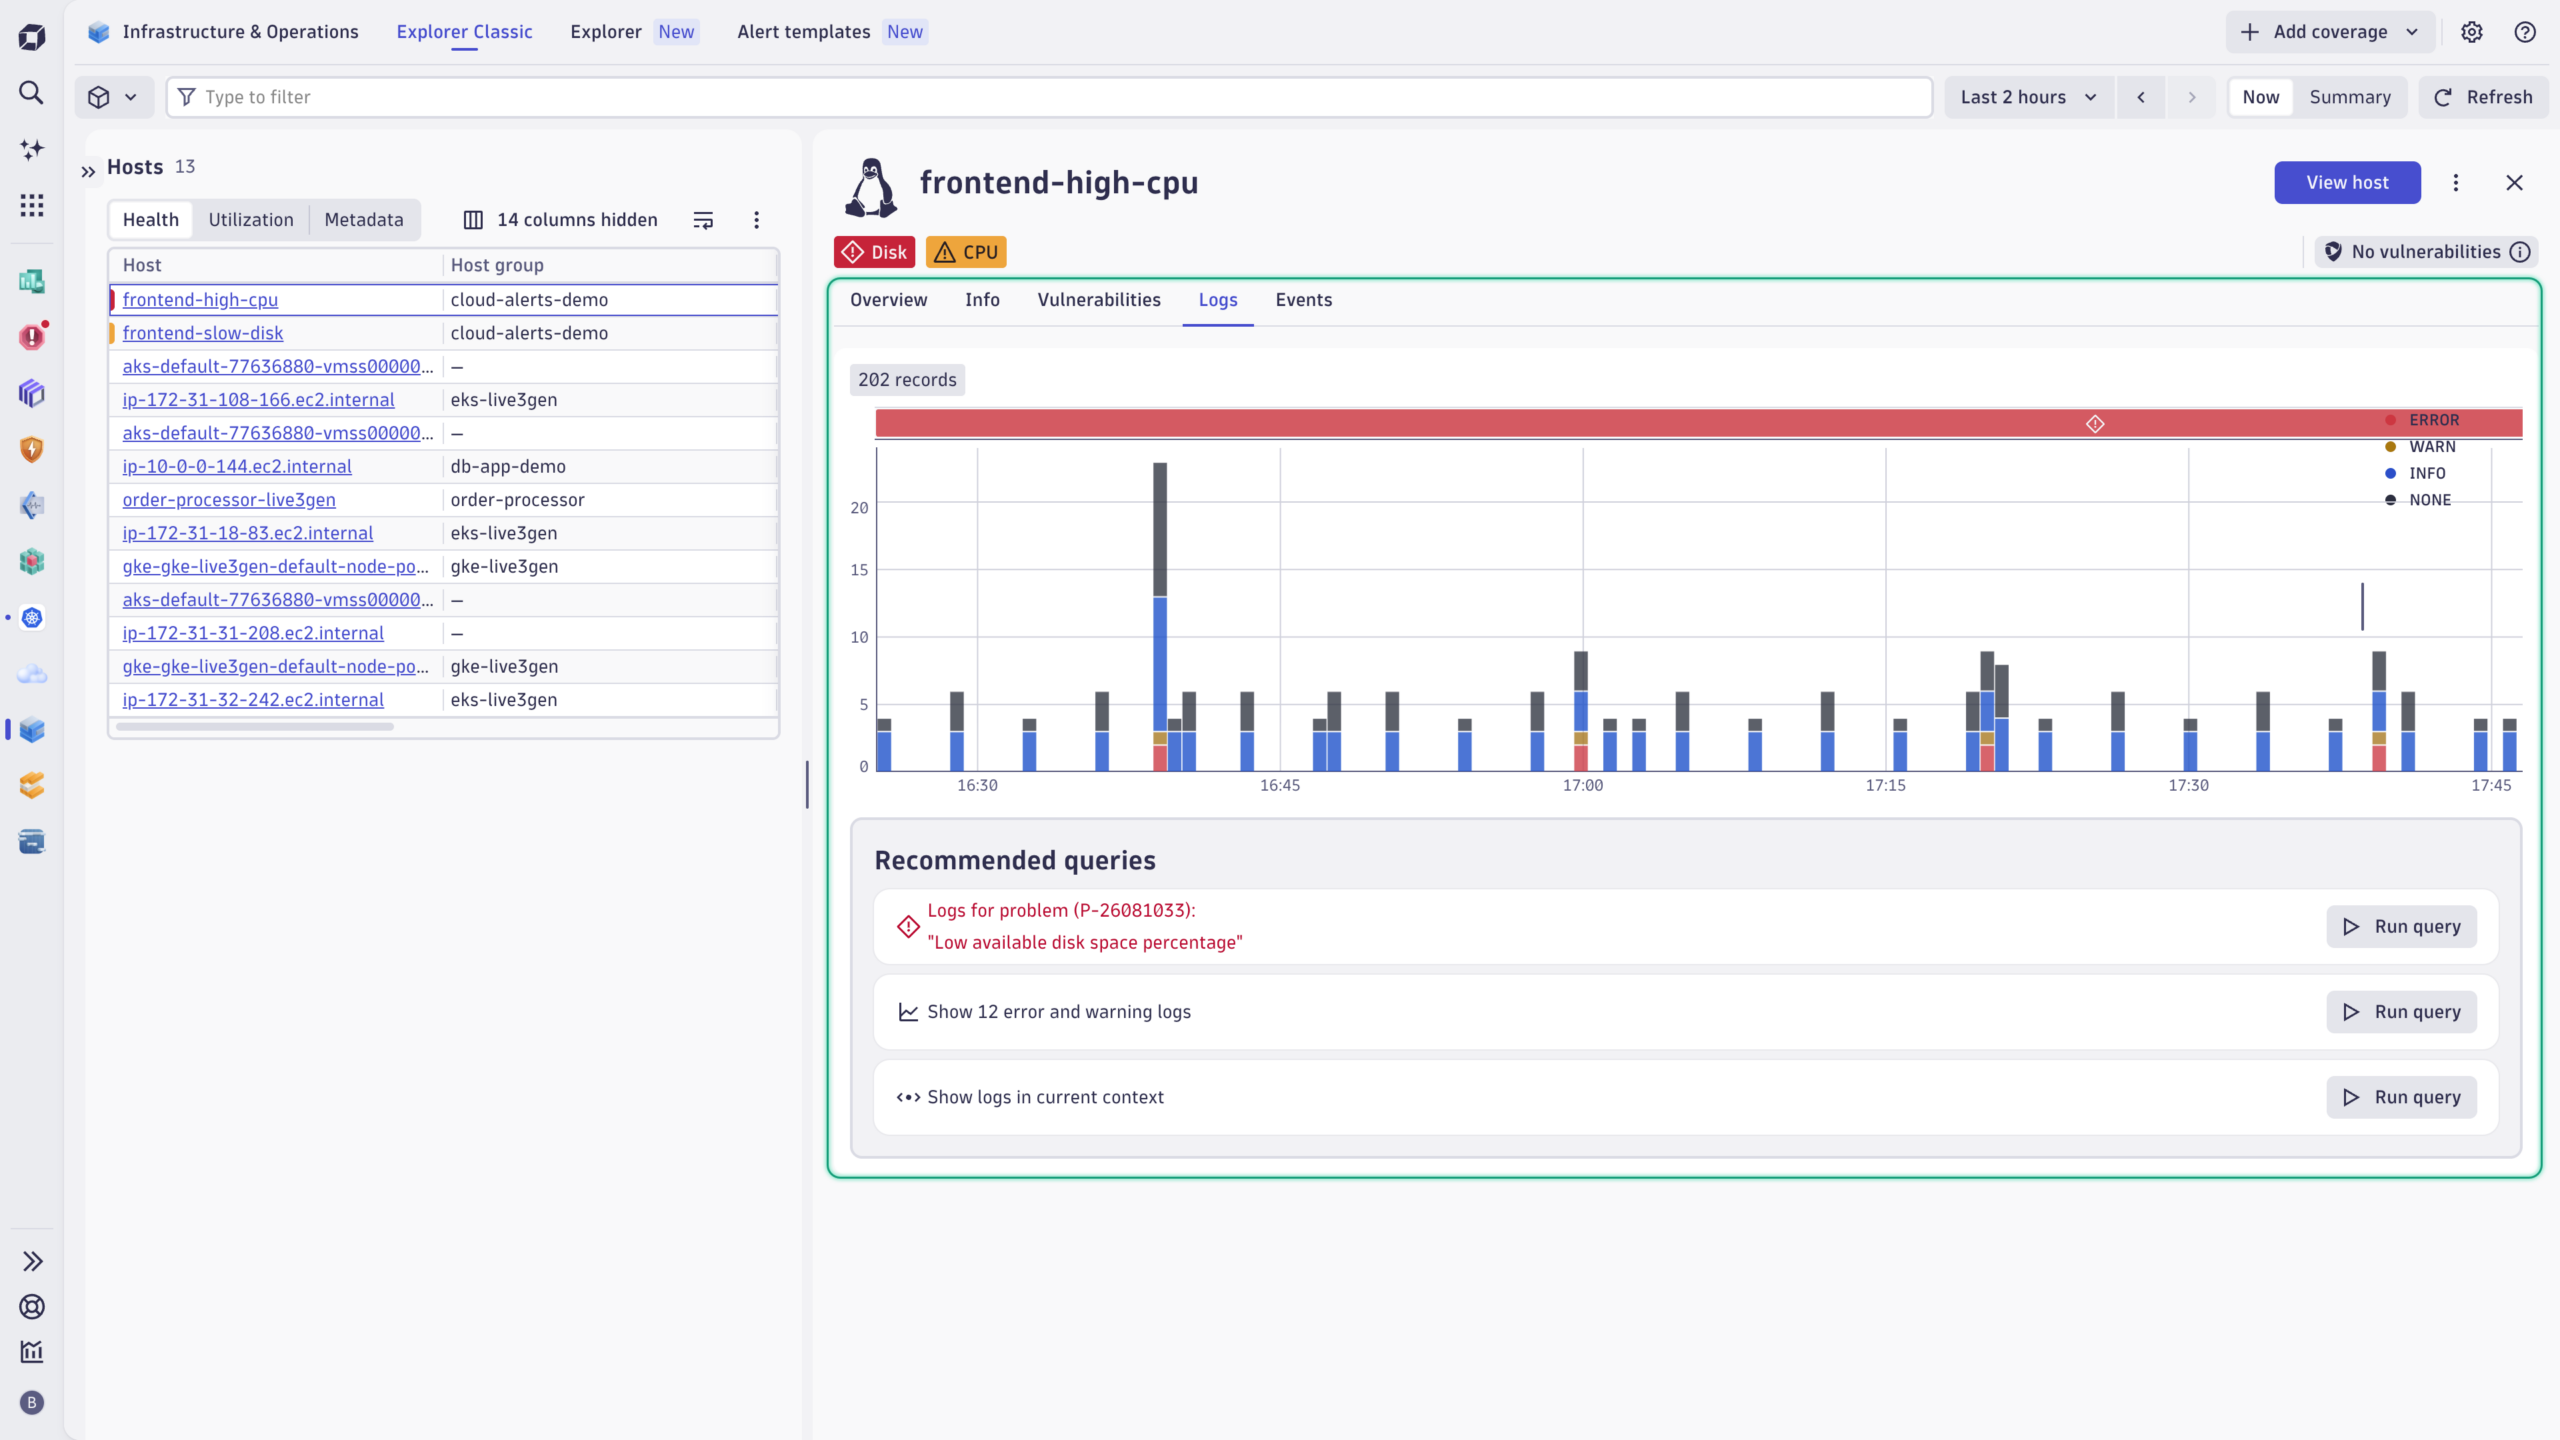
Infrastructure & Operations now links directly to related data in Logs, Clouds, Kubernetes, and Services, carrying your active filters, timeframe, and segment over automatically. You land in the target app with the same context already applied, instead of rebuilding a query or filter by hand.
Performance, drilldowns, and navigation improvements
Labels for Dashboards and Notebooks.
Add and remove labels on dashboards and notebooks, then filter your content list by one or more labels to find what you need faster.
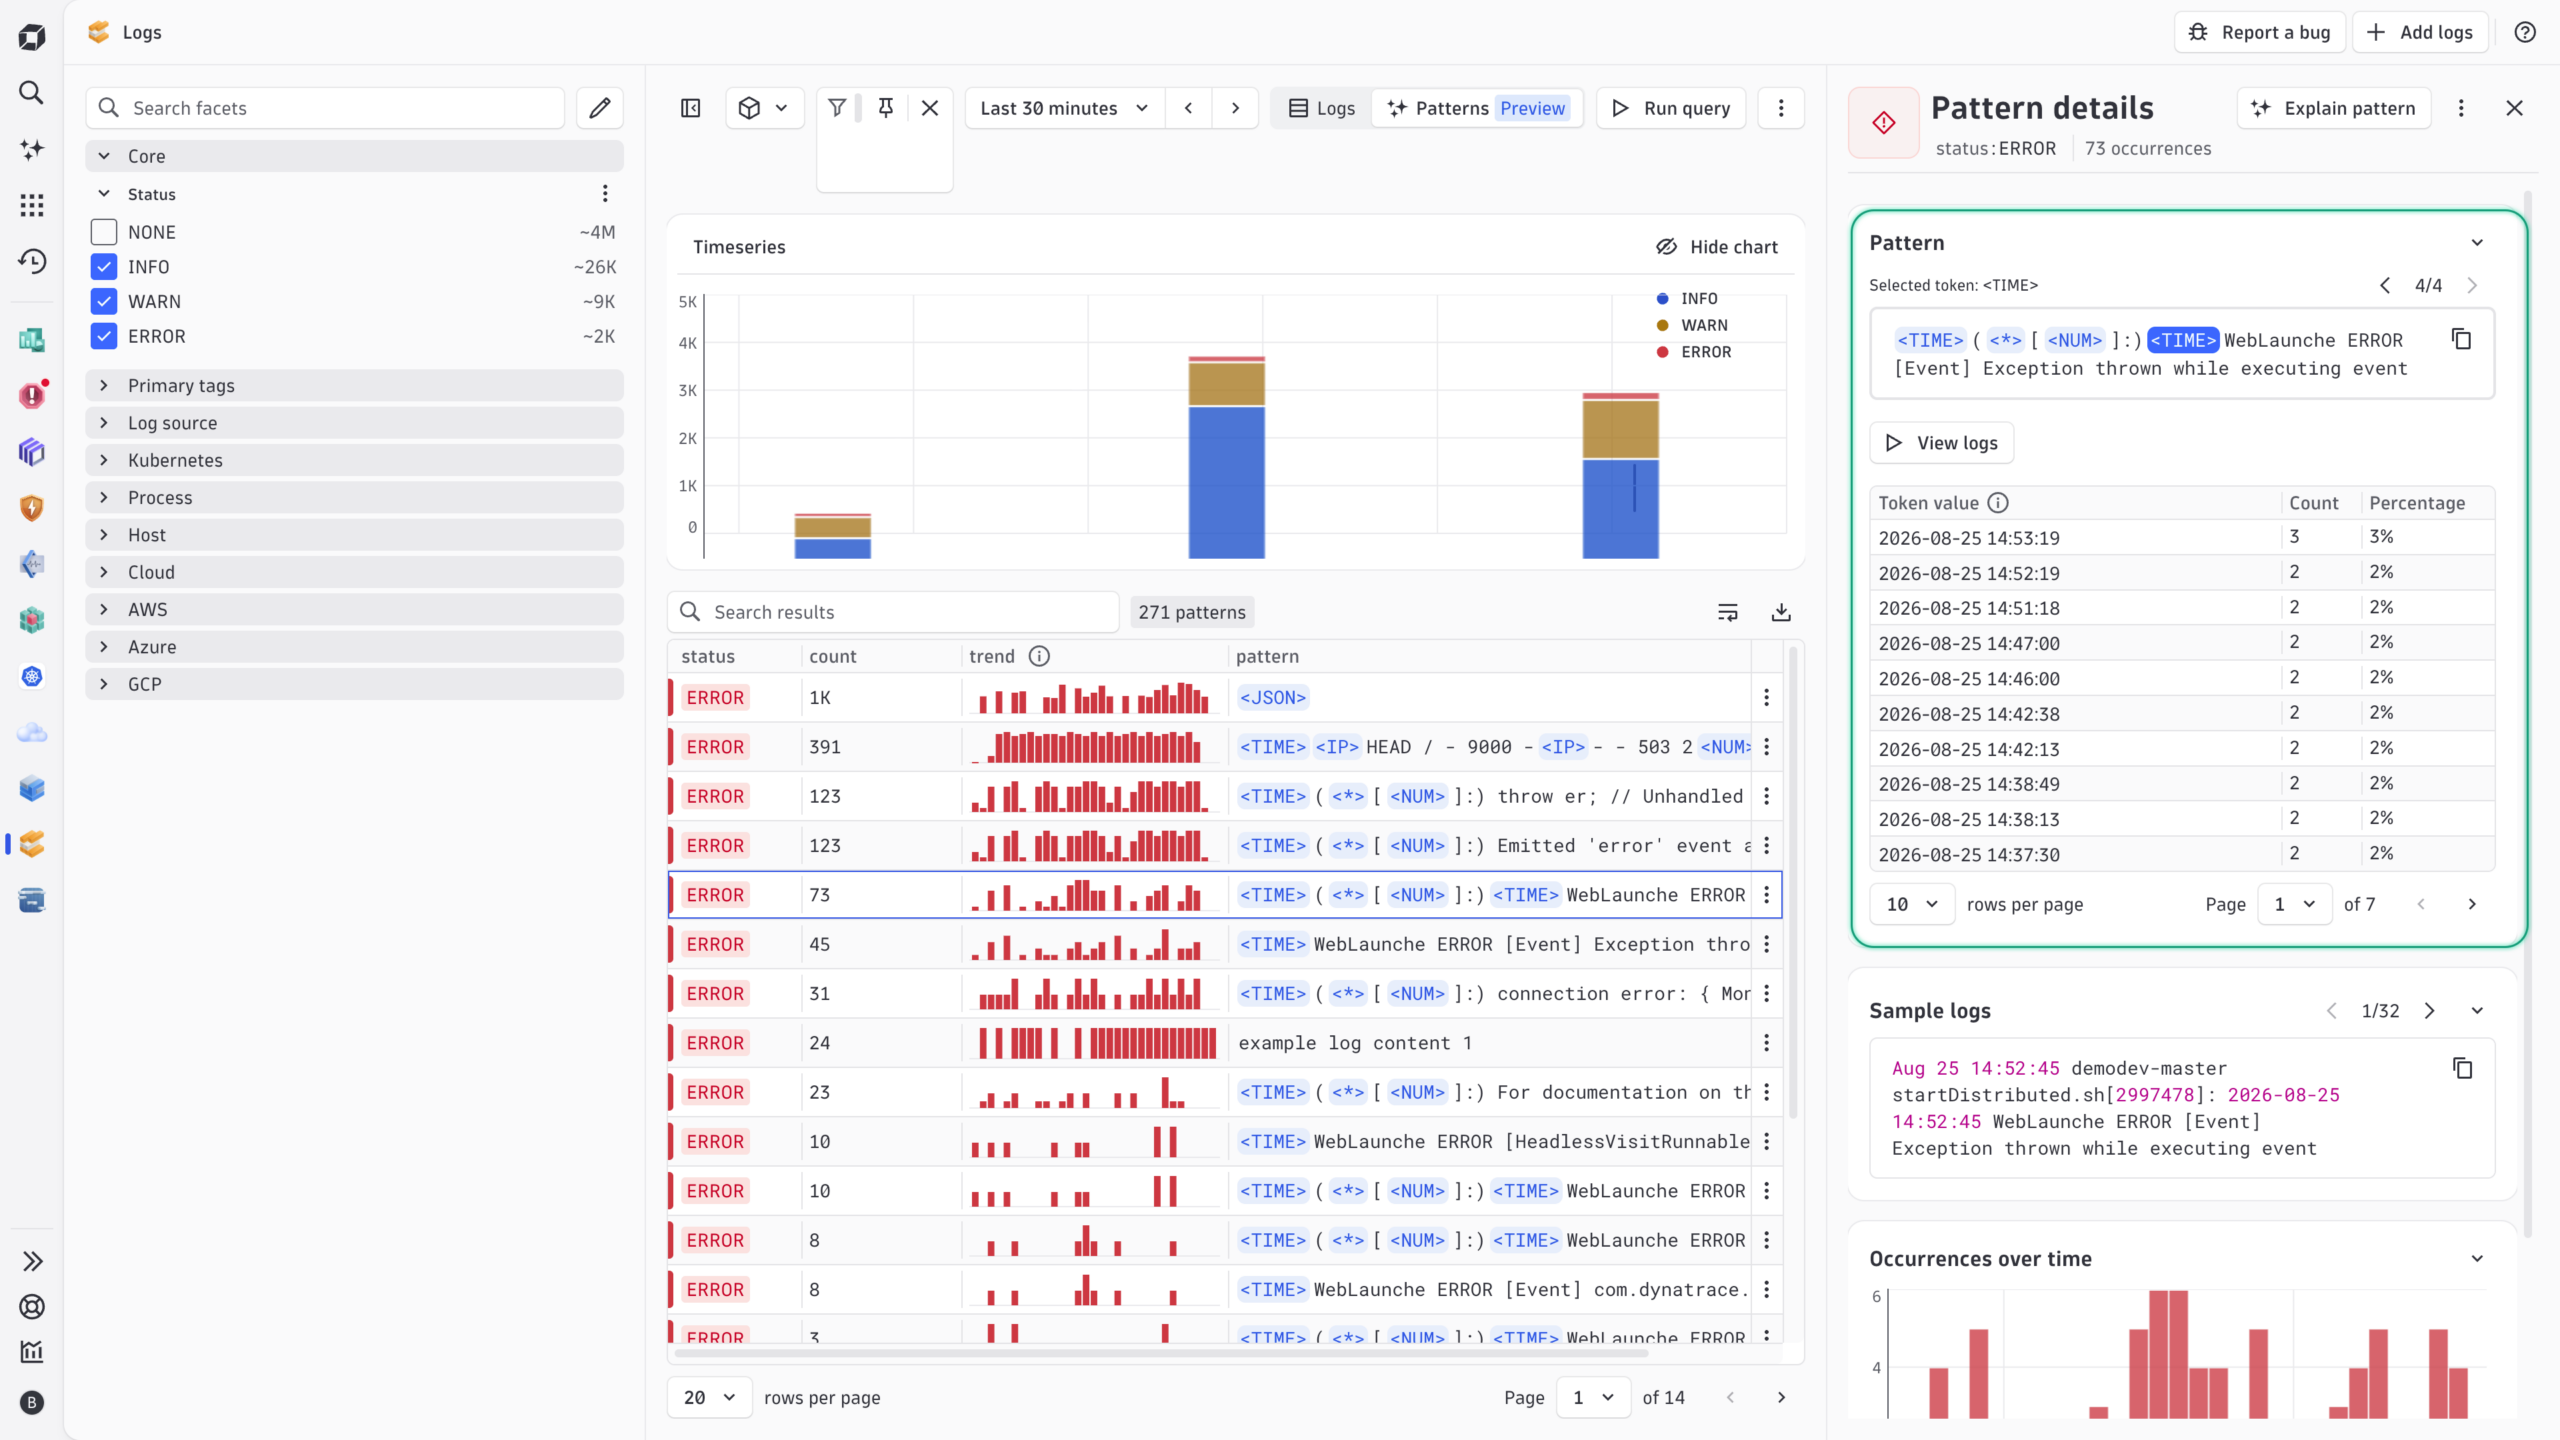
Log Pattern Analysis gets a sharper details experience.
A set of UX improvements make pattern investigation faster and less cluttered:
- Readable defaults, full content on demand. Pattern and log sample viewports in the details sidebar are now constrained to a comfortable reading size by default; an explicit expand action reveals the full content when needed.
- Consolidated close control. Two close icons in the log sheet are merged into a single, unambiguous control, reducing visual noise during investigation.
- Two-step feedback. The feedback interaction shows only thumbs up/down initially; selecting one scrolls the panel to the comment area and submit button instead of requiring a manual scroll to find them.
- Filter to a token value directly. A View logs for related token value action is now available in the three-dot menu on any row in the token value table, filtering the log list to entries that match that exact value and highlighting the filtered token in the log sheet.
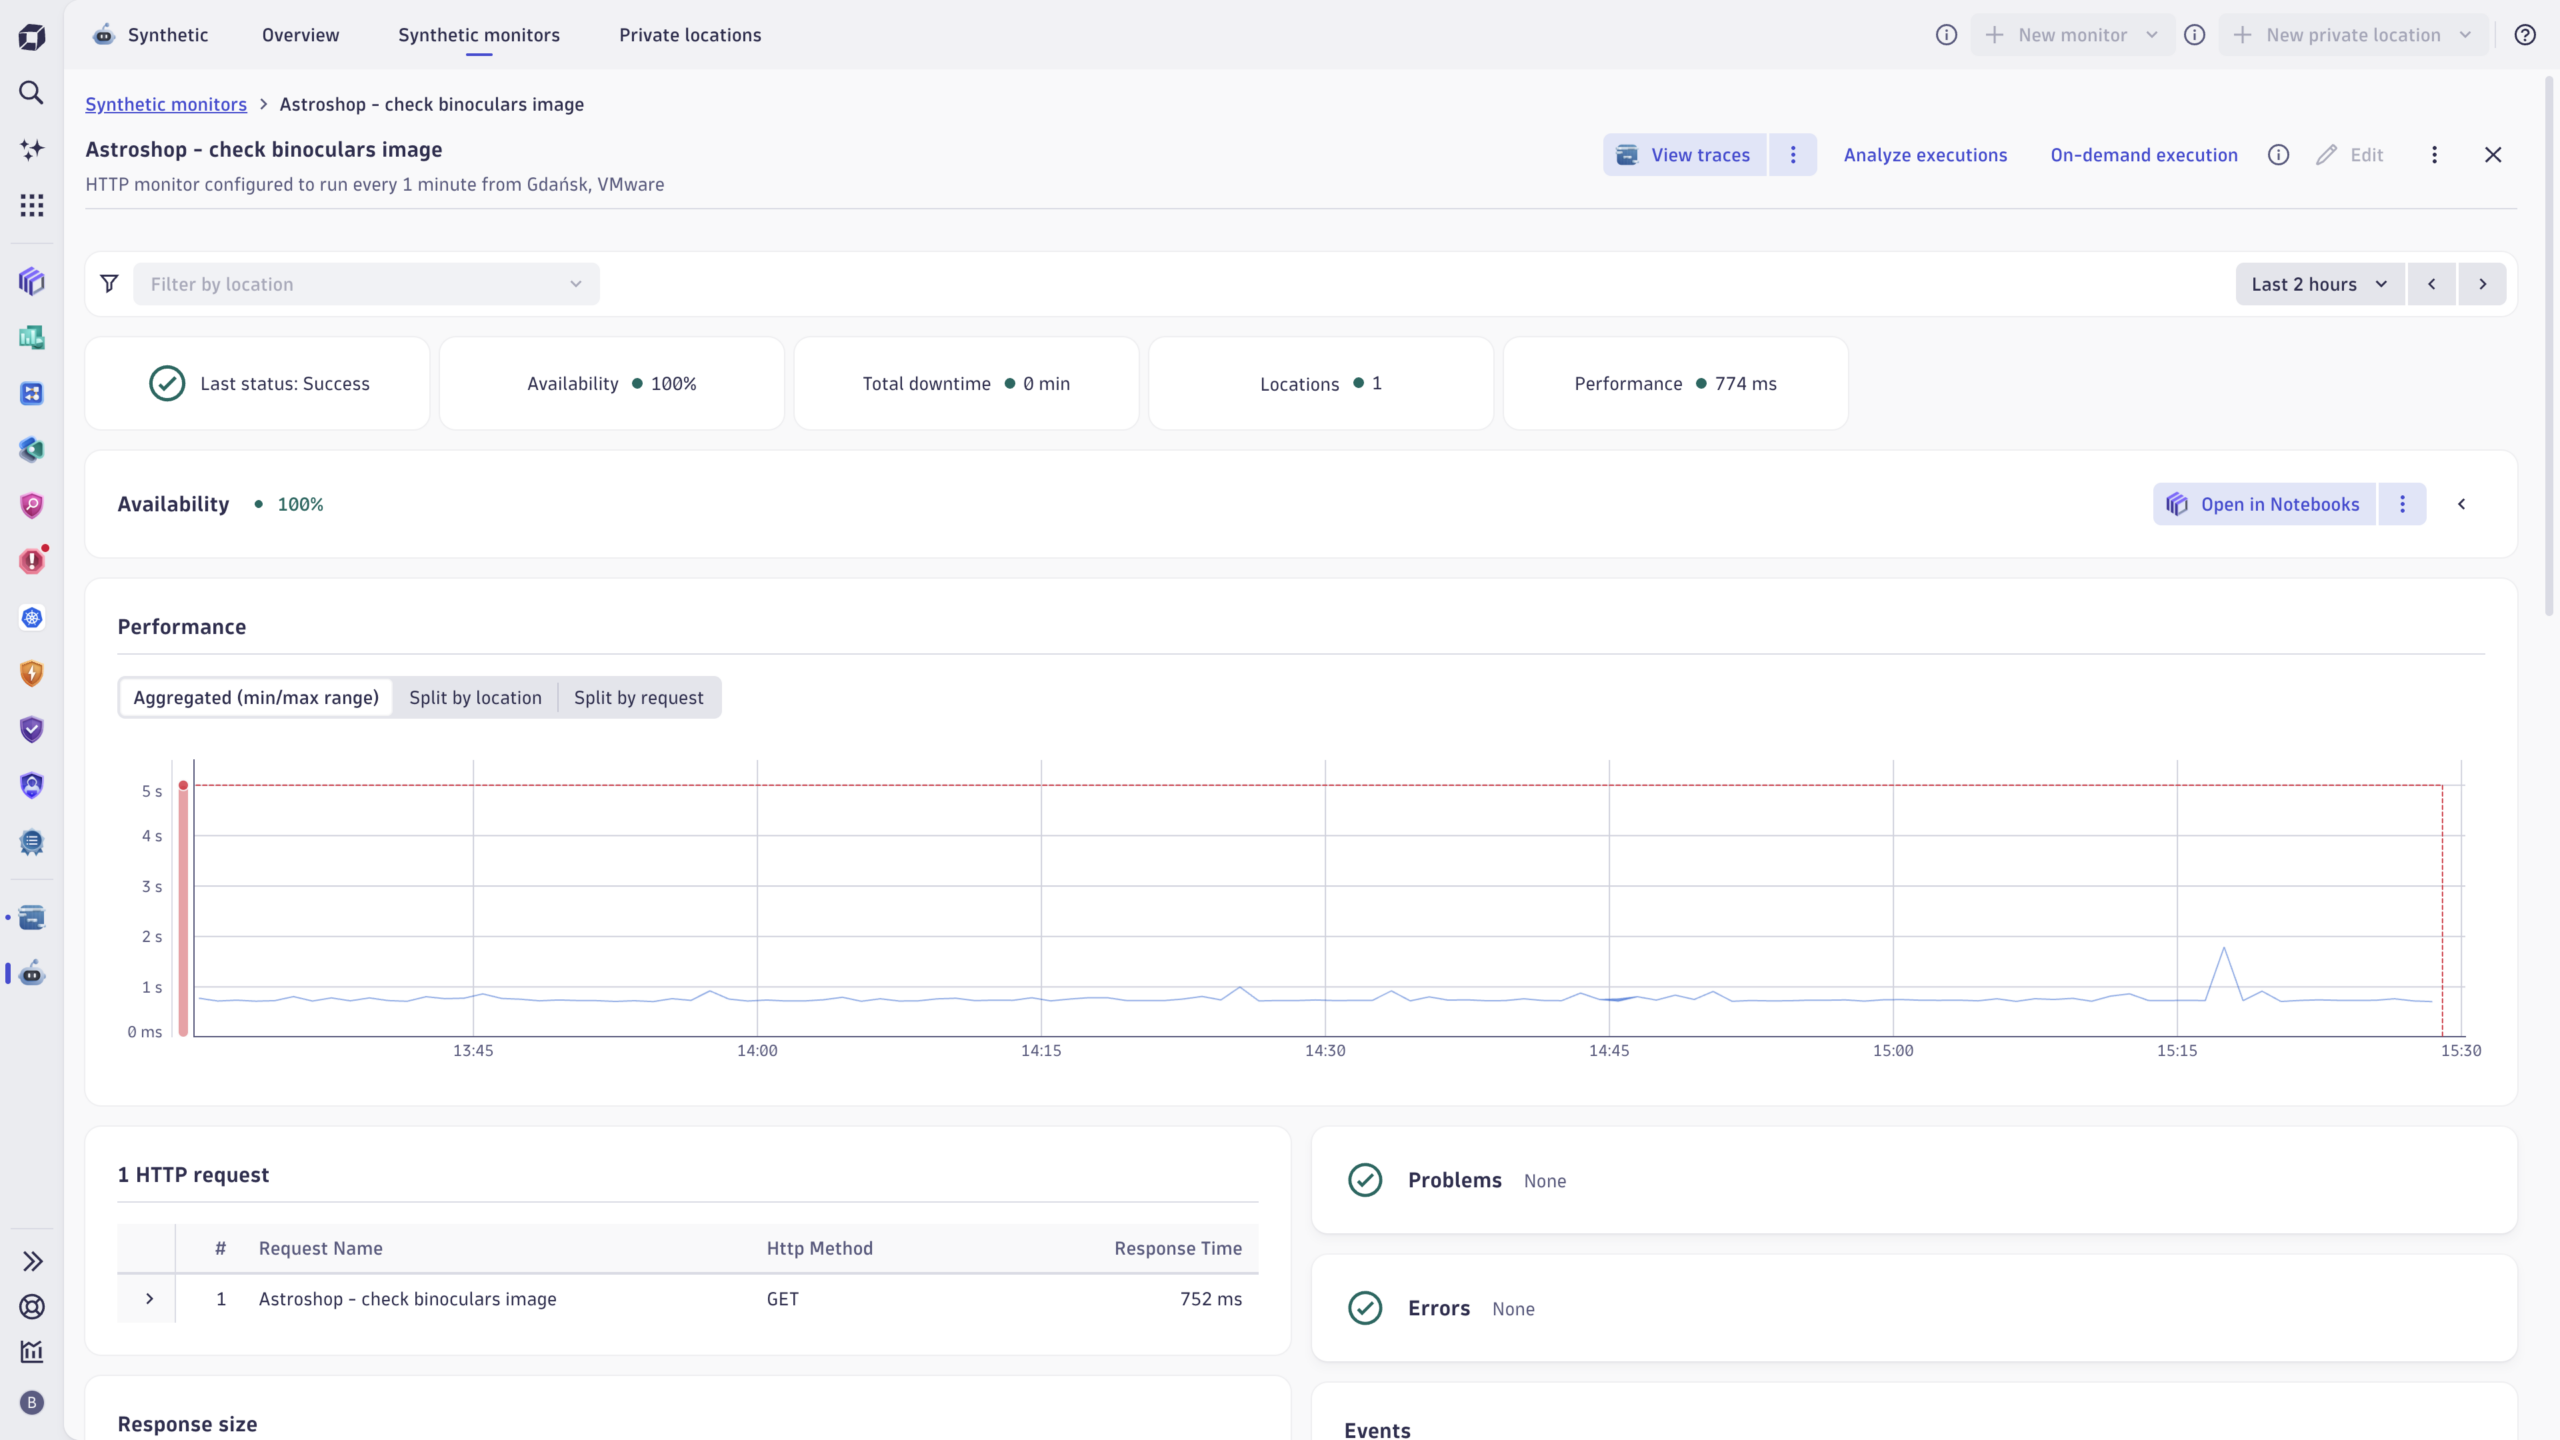
Synthetic waterfall links into Distributed Tracing. The request details panel in the Synthetic waterfall now shows a direct View in Distributed Tracing action when the request carries a trace ID. One click opens the matching trace in Distributed Tracing with the timeframe pre-applied with no manual search required.
Call chain loading is improved. The initial call chain load is now capped at 10 levels. Progress is shown in the top bar without covering the graph so you can watch levels arrive as they stream in. Once loading settles, a notification tells you whether the chain loaded fully or was cut at 10 levels, with a Go deeper action to continue when more levels are available.
Kubernetes Containers list adds filtering. The Containers view now supports Kubernetes-aware filters, making it easier to scope the list to a specific cluster, namespace, or workload without navigating away.
Logs drills into Live Debugger. From any log entry in the Logs app, you can now jump directly into Live Debugger to investigate the underlying code execution without losing context between apps.
Database backtrace. The Services app adds a Service backtrace modal to the Database queries view. Open any database statement to see the full upstream call chain — which services and endpoints call it, how load is distributed across them, and whether any caller carries errors — so you can spot fan-out patterns and gauge blast radius before a slow query spreads further.
DPS usage and cost insights
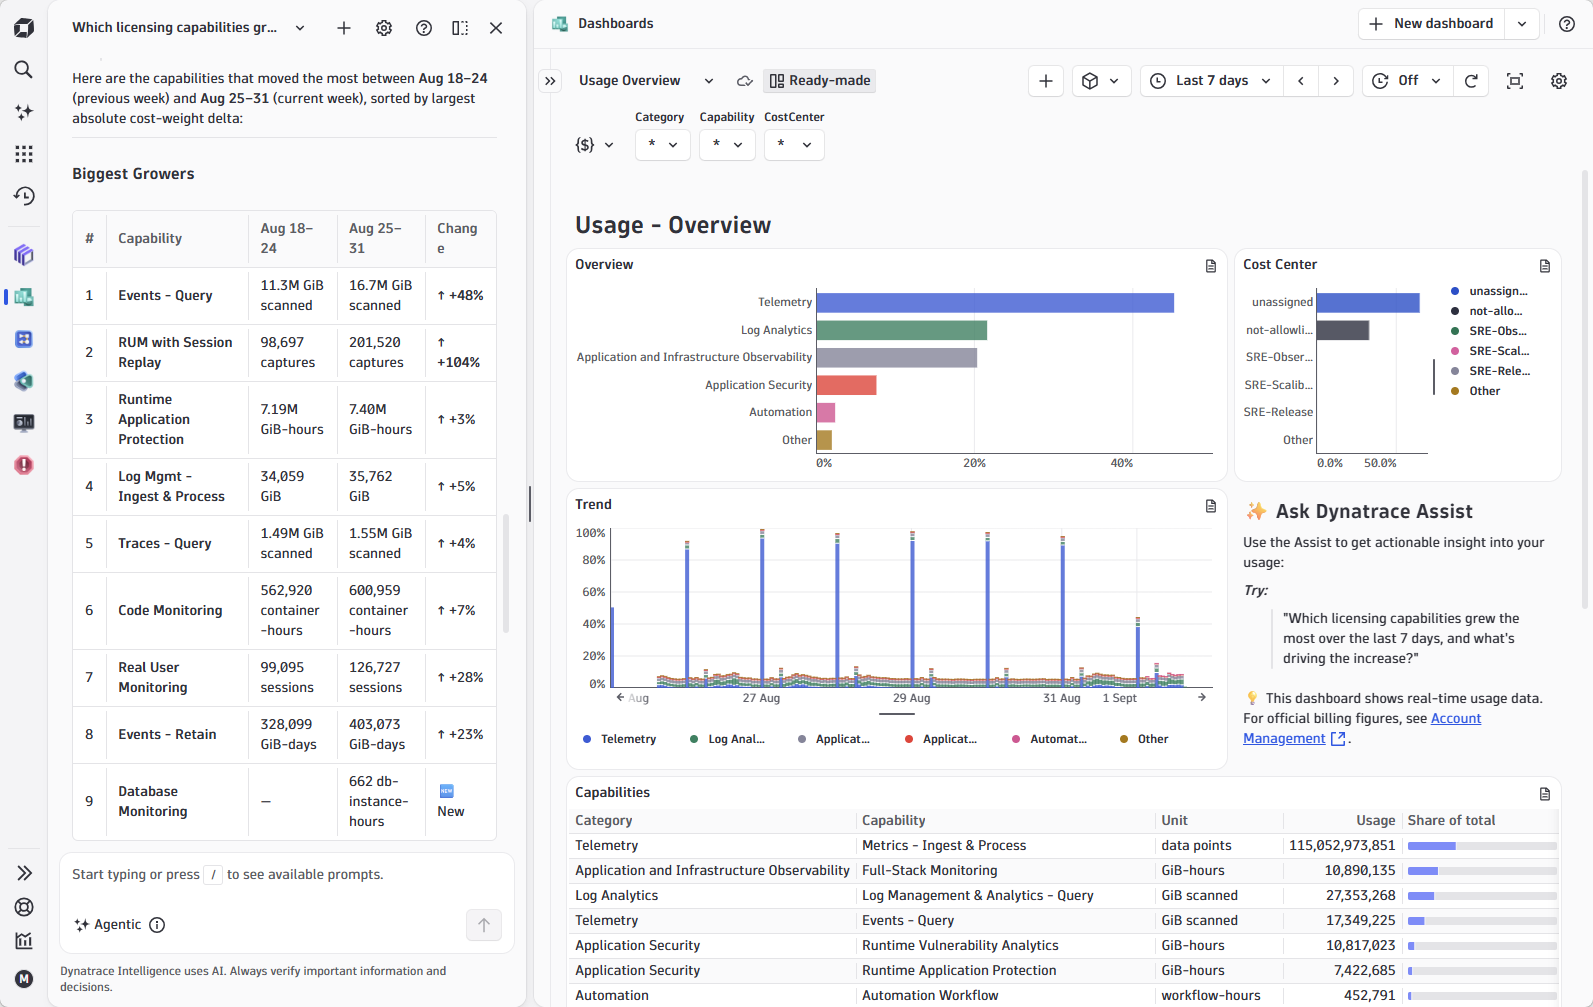
Usage – Overview dashboard. This new ready-made dashboard provides you with actionable insights, with drilldowns that quickly identify cost spikes, root causes, and the teams driving usage. It contains an overview of usage by rate-card capability and category, showing trends over time, and a breakdown of costs by cost center.
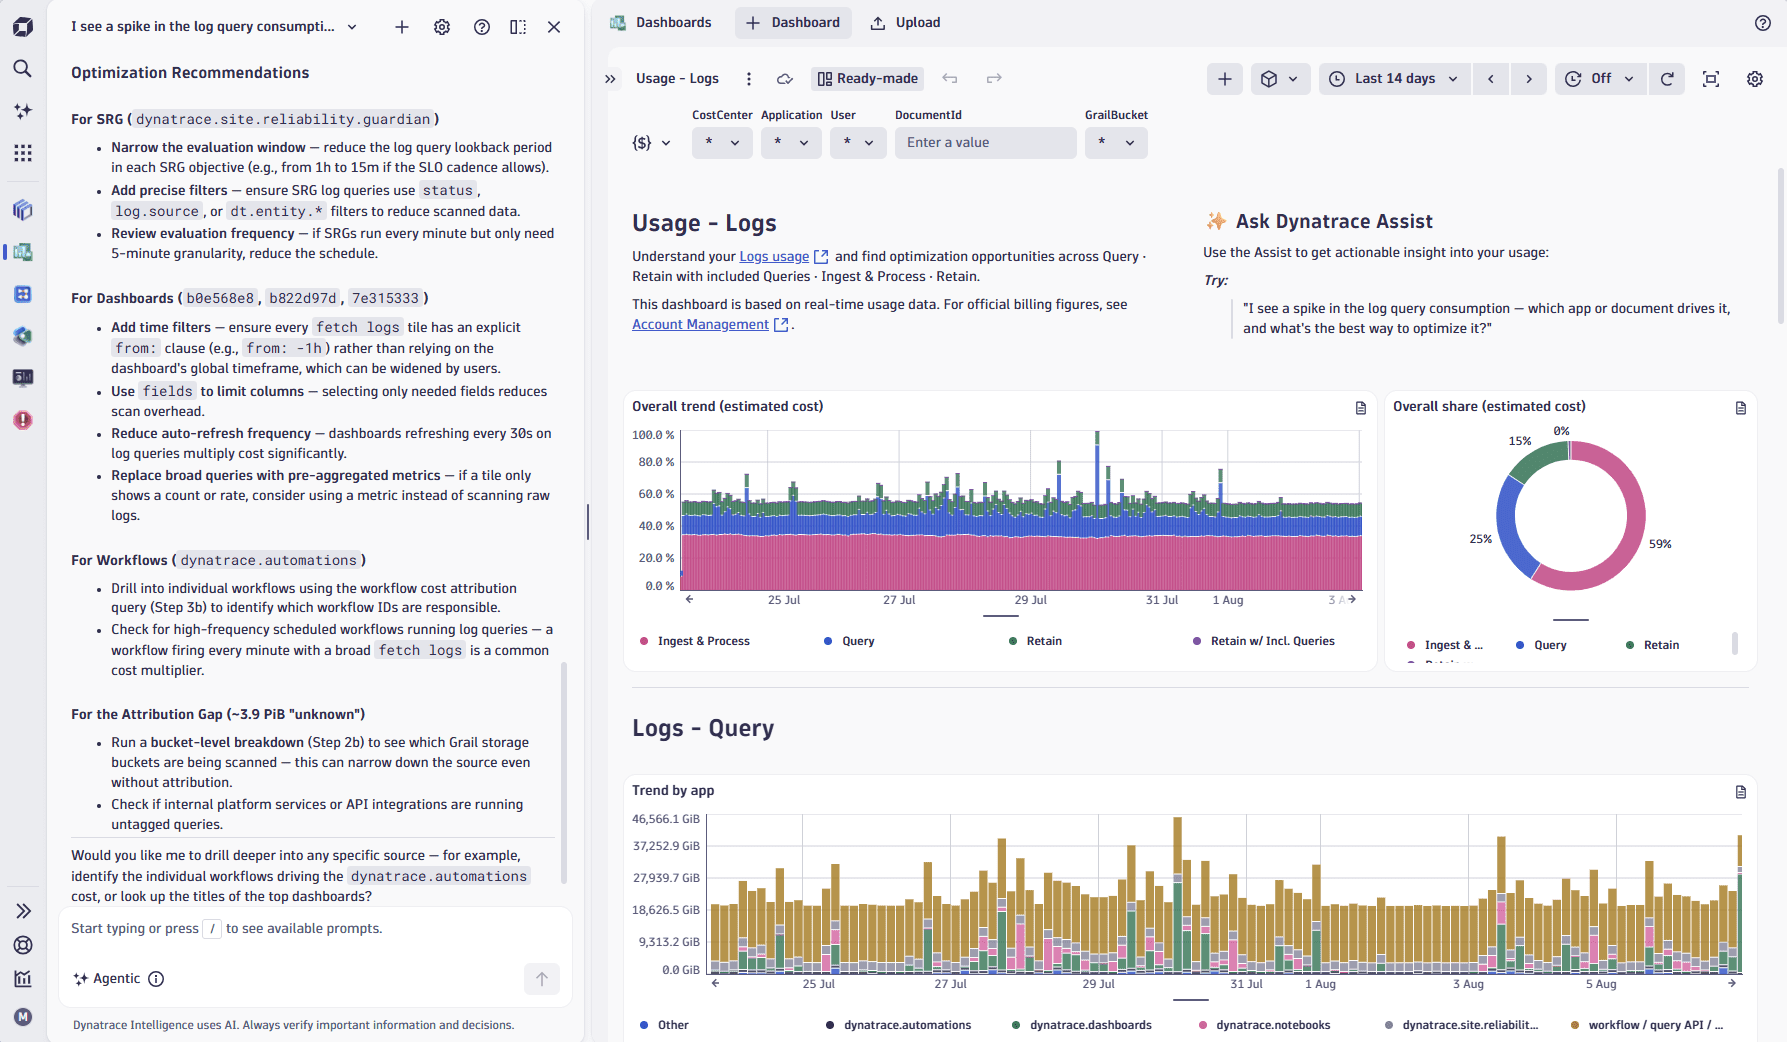
Usage – Logs dashboard. This new ready-made dashboard gives you a unified view of your Log Management & Analytics usage across Query, Ingest & Process, Retain, and Retain with Included Queries with per-capability usage breakdowns, optimization recommendations, and consistent filters across all sections.
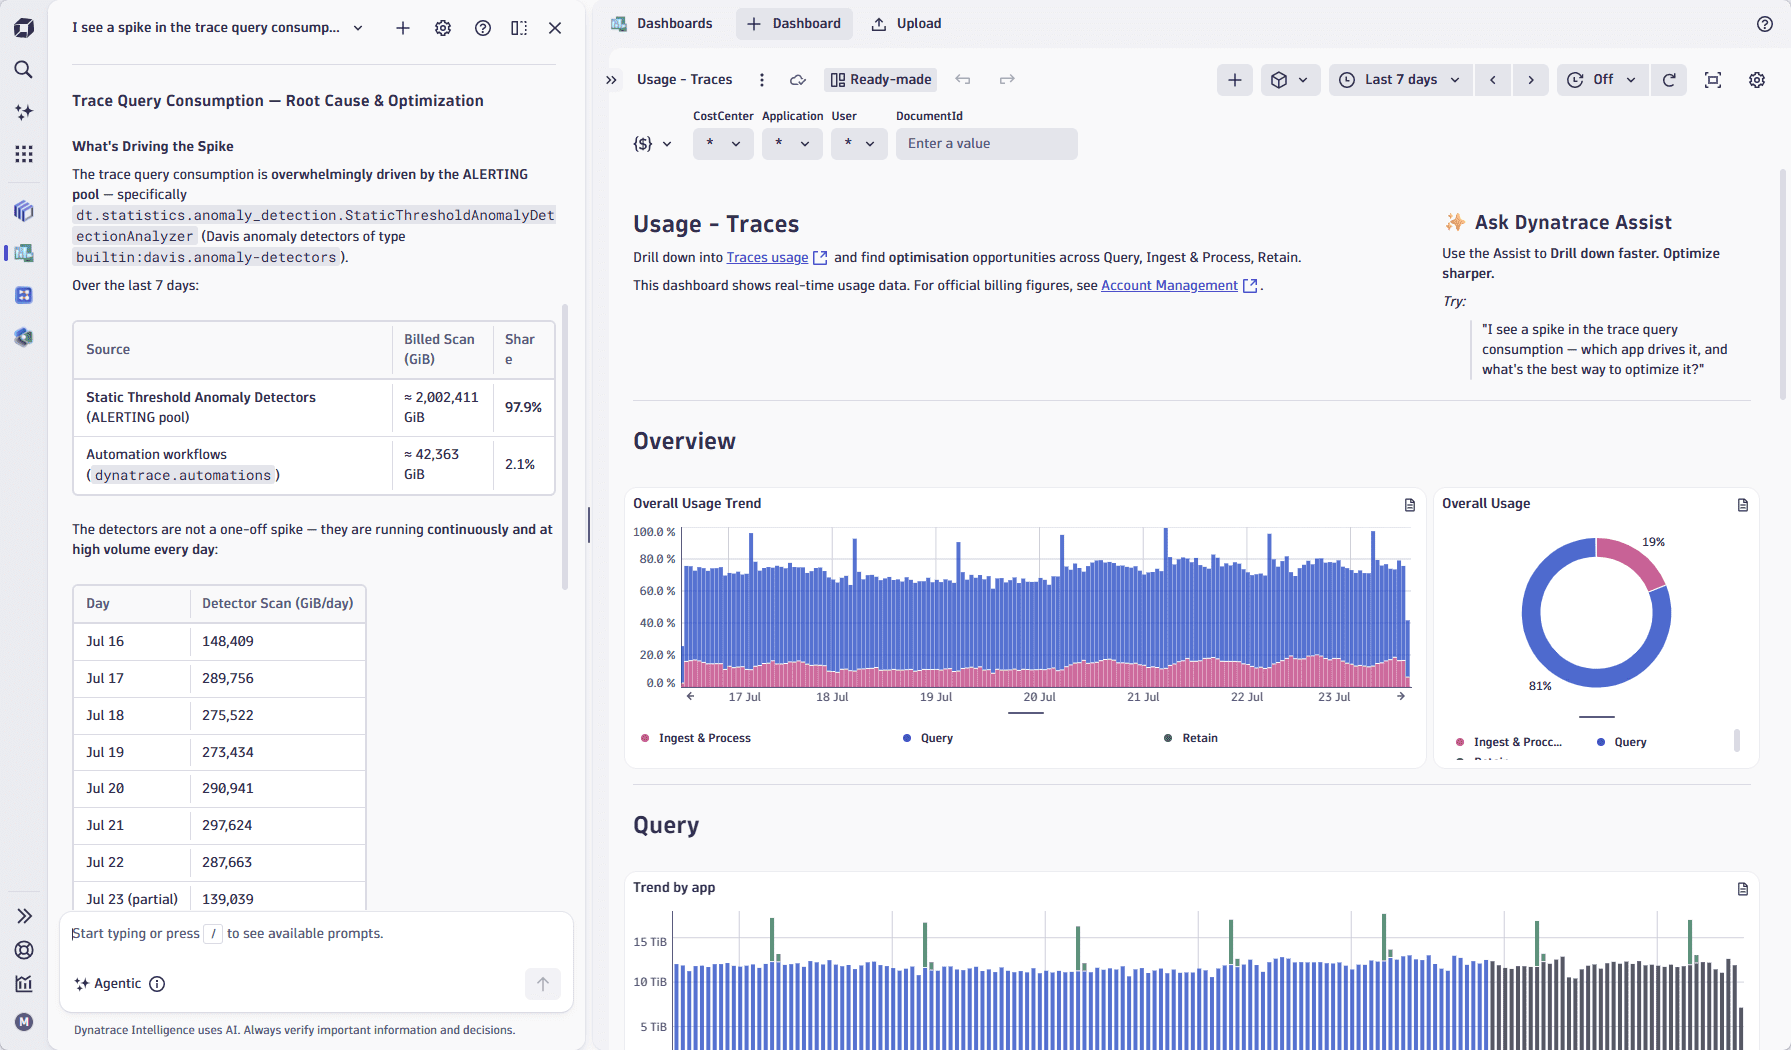
Usage – Traces dashboard. This updated ready-made dashboard gives you a unified view of your traces billing across all three capabilities — Query, Ingest & Process, and Retain — with estimated cost attribution, growth trend analysis, and actionable query optimization guidance.
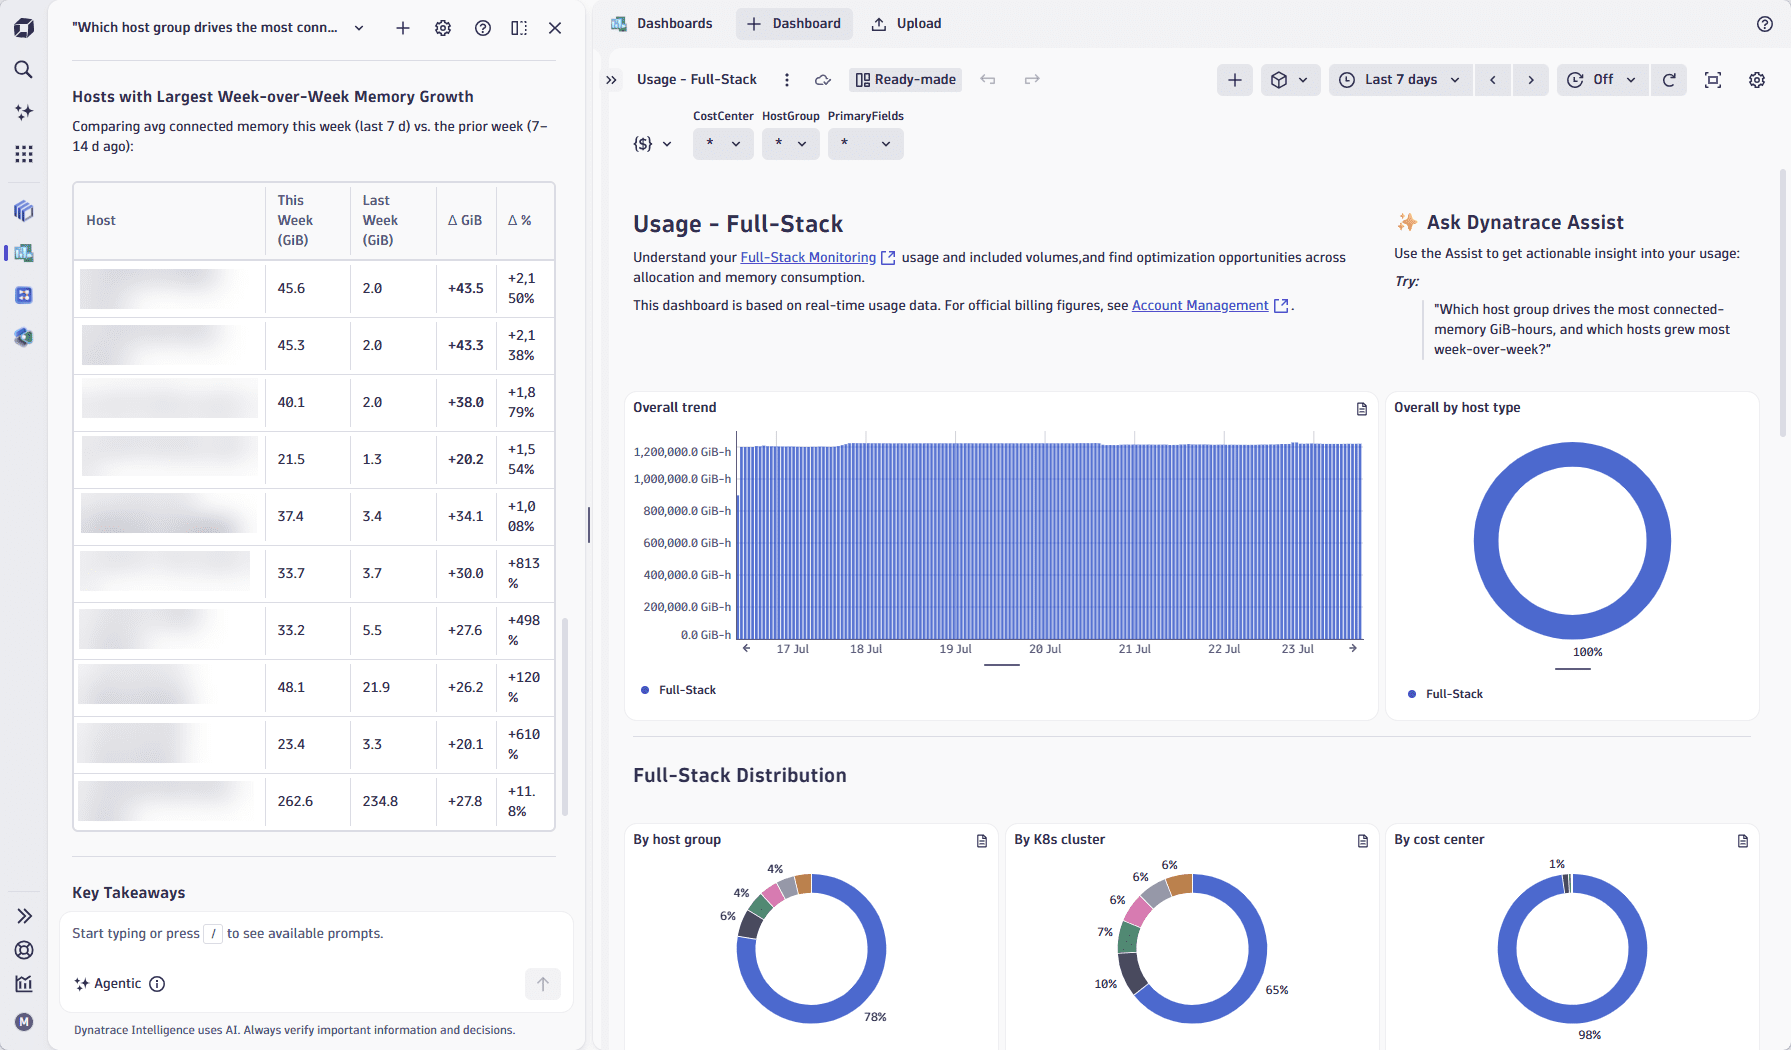
Usage – Full-Stack dashboard. This new ready-made dashboard gives you a real-time, end-to-end view of your Full-Stack Monitoring consumption across memory (GiB-hours), metrics data points, and trace ingest, with built-in cost attribution and growth trend analysis to surface optimization opportunities.
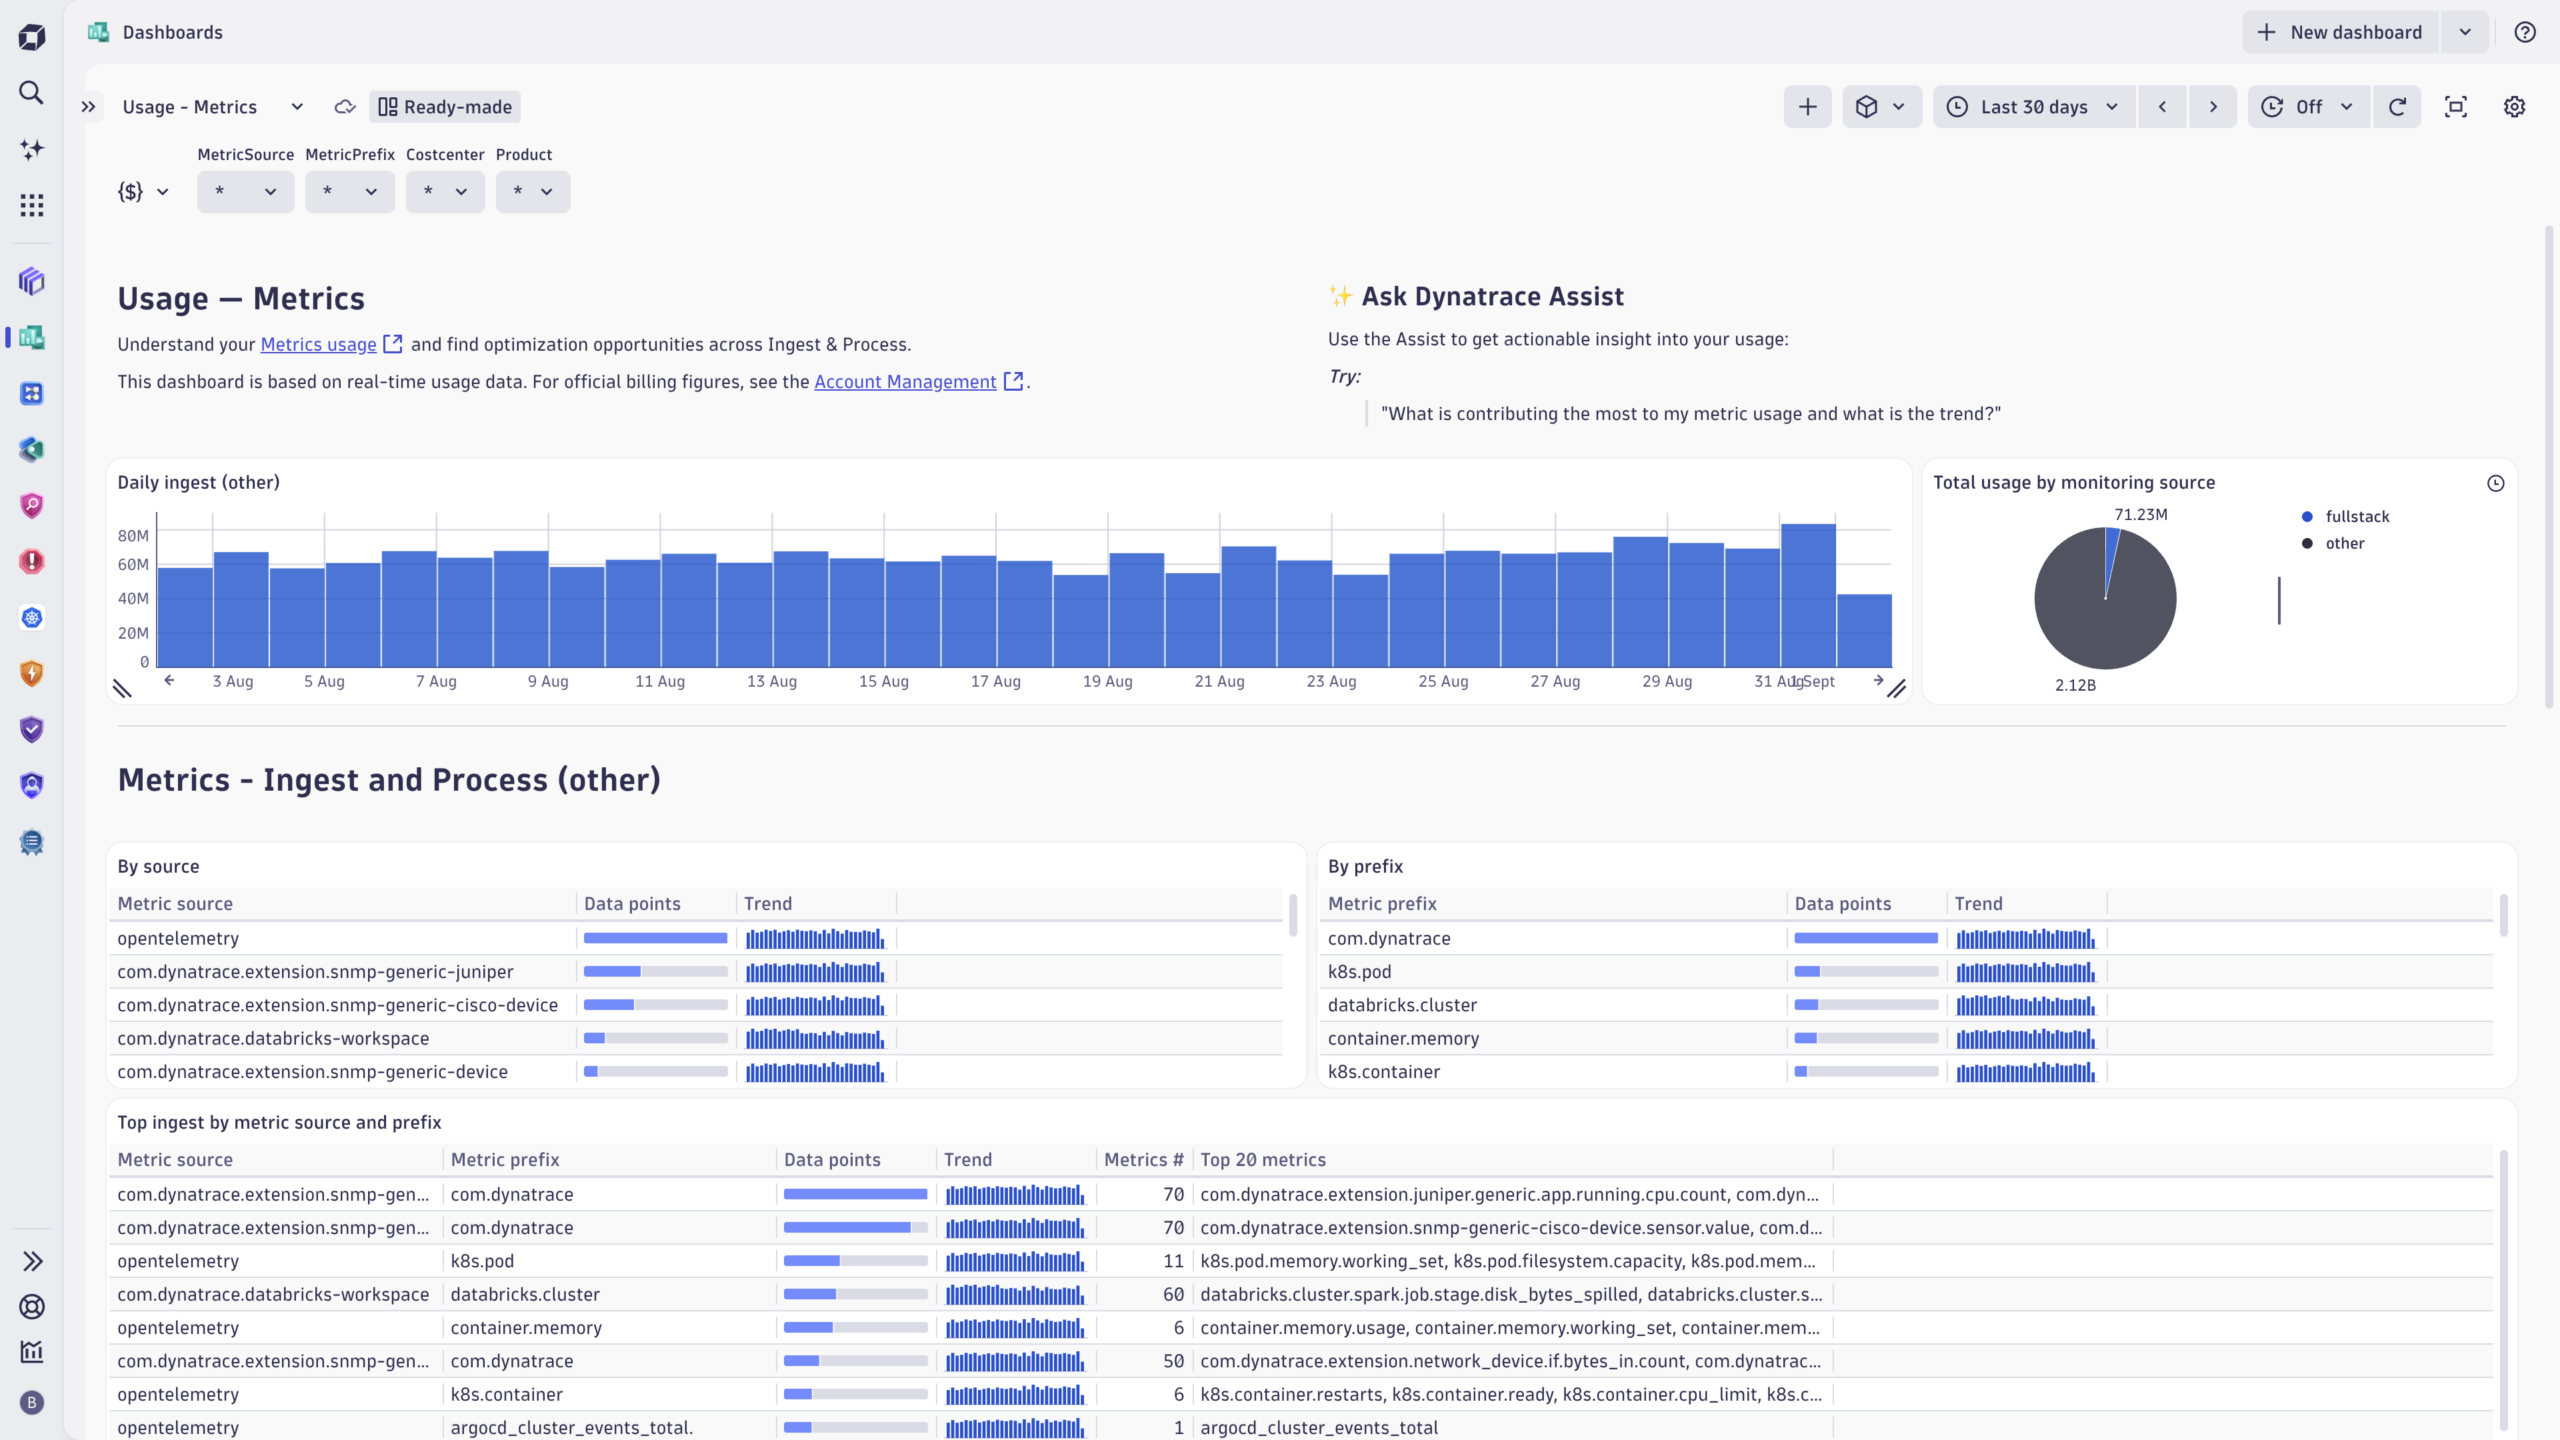
Usage – Metrics dashboard. This new ready-made dashboard lets you view, allocate, and predict your metrics usage across the platform. It provides you with a granular breakout of a metric by source and cost allocation, down to the metric prefix key. You can spot metrics ingest spikes, identify sudden increases in ingest activity and dive into the source as well as optimize your metrics cost by identifying unnecessary metrics for ingest.
Why this matters to practitioners
August’s changes shorten the distance between a problem and its cause. Centralized Kubernetes tagging reduces inconsistent cost and ownership data. Automated vulnerability alerts and a workload-risk skill mean AI security findings reach the right team without anyone running a manual check. Inline lookups make enrichment something you configure once, in one place, instead of a DQL statement you maintain everywhere. And with sprint 346, the conversation starters you already use become agentic by default, and Infrastructure & Operations carries your context straight into Logs, Clouds, Kubernetes, and Services.
None of these require a new tool or a new process, but instead make the workflows you already run faster and more precise.


Looking for answers?
Start a new discussion or ask for help in our Q&A forum.
Go to forum