

This series covers recent Dynatrace releases and updates, focusing on what’s new, what’s changed, and how these recent enhancements can benefit you and your organization. Each post covers newly available capabilities and where to explore them.
If you want to see them in action, head over to our Release Radar launchpad on the Dynatrace Playground.
Smartscape gets a unified topology view and ad-hoc filters
In a significant Smartscape update, a new All topology view shows every relationship for a given node in a single graph: the infrastructure stack, communication flows, and relationships such as monitoring, load balancing, routing, and API dependencies. Where the existing Vertical and Horizontal views each focus on a subset of relationships, the All view provides a more comprehensive view of relationships, from any node in any app across the platform.
Two changes make these views faster and more focused:
- The AWS and Kubernetes views now use flat layouts instead of nested ones, bringing the same relevance-based edge fetching and priority-driven node loading used elsewhere in Smartscape for more consistent visibility across your cloud landscape.
- New ad-hoc node and edge filters let you narrow any view by node type, cloud and infrastructure labels, team ownership, environment, and other properties.
Filters work alongside segments and are saved in the URL, so you can bookmark and share a focused view with segment, timeframe, and filters all preserved.
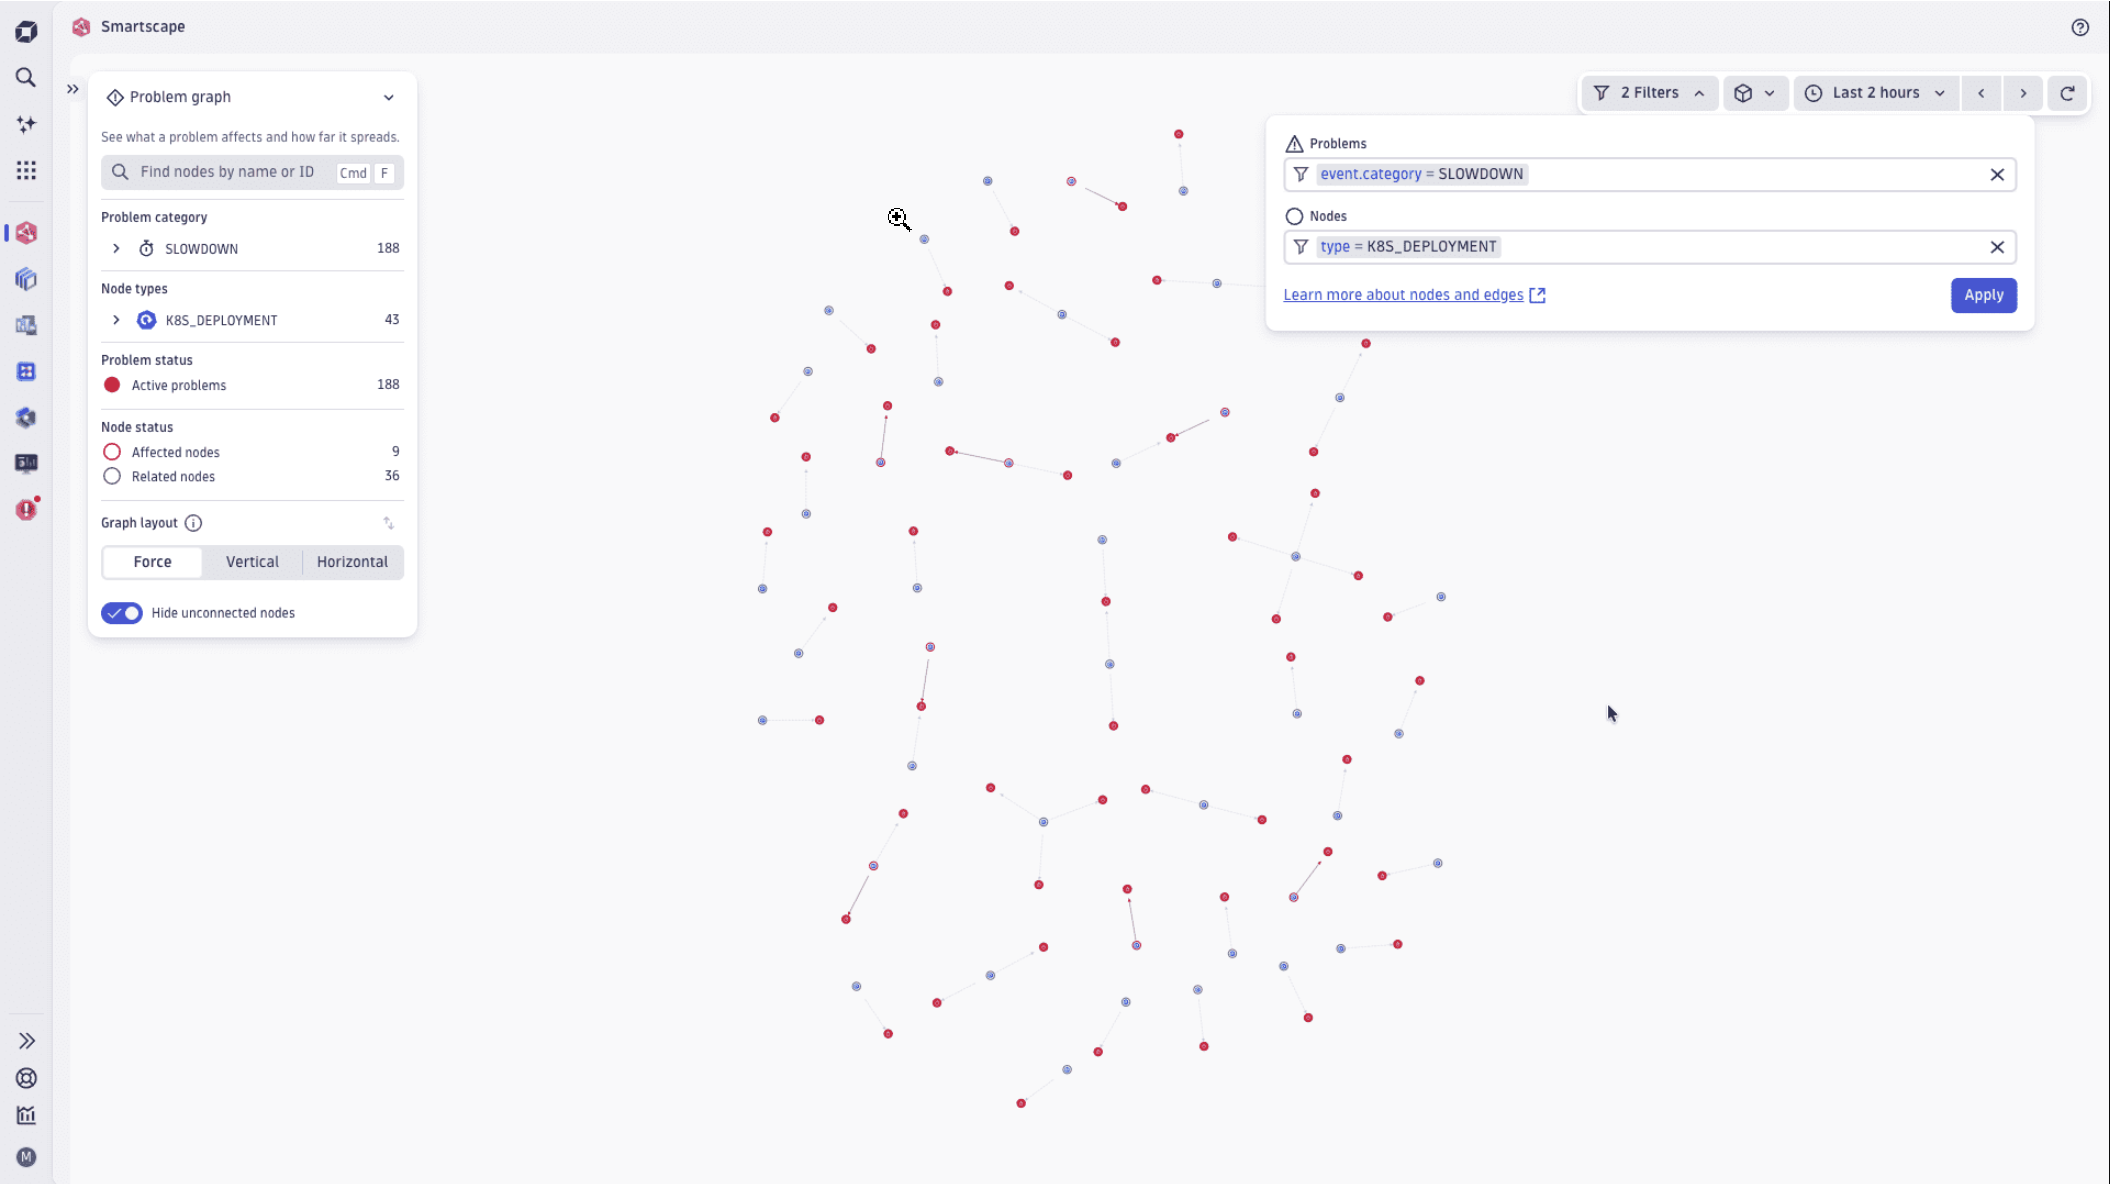
Press Ctrl+F (Cmd+F on Mac) in any Smartscape view to find nodes by name or ID. Matching nodes are highlighted in the graph, and the legend is narrowed to matching entity groups.
For broader context on Smartscape, see The new Dynatrace Smartscape improves operational efficiency across clouds, Kubernetes, infrastructure, and more.
AI Observability gains LLM evaluation, OpenInference, and Python instrumentation
AI applications can fail without obvious indicators — returning responses at normal speed with no errors, while delivering answers that are inaccurate, unsafe, or inconsistent. Traditional performance monitoring misses this entirely.
dt-evals is a new open source CLI that closes that gap. It pulls live gen_ai.* spans directly from your Dynatrace environment. Built-in evaluators use an LLM judge to score real production interactions for faithfulness, hallucination, relevance, toxicity, bias, PII leakage, prompt injection, and drift. The judge writes structured results back to Dynatrace as business events. Evaluation scores sit alongside latency and error metrics in the same dashboards. These scores can trigger alert workflows and gate CI/CD releases based on quality thresholds the same way that performance metrics do. For the thinking behind this approach, see Evaluate LLM and agent quality in Dynatrace AI Observability and LLM evaluations as a foundation for trustworthy agentic AI systems.
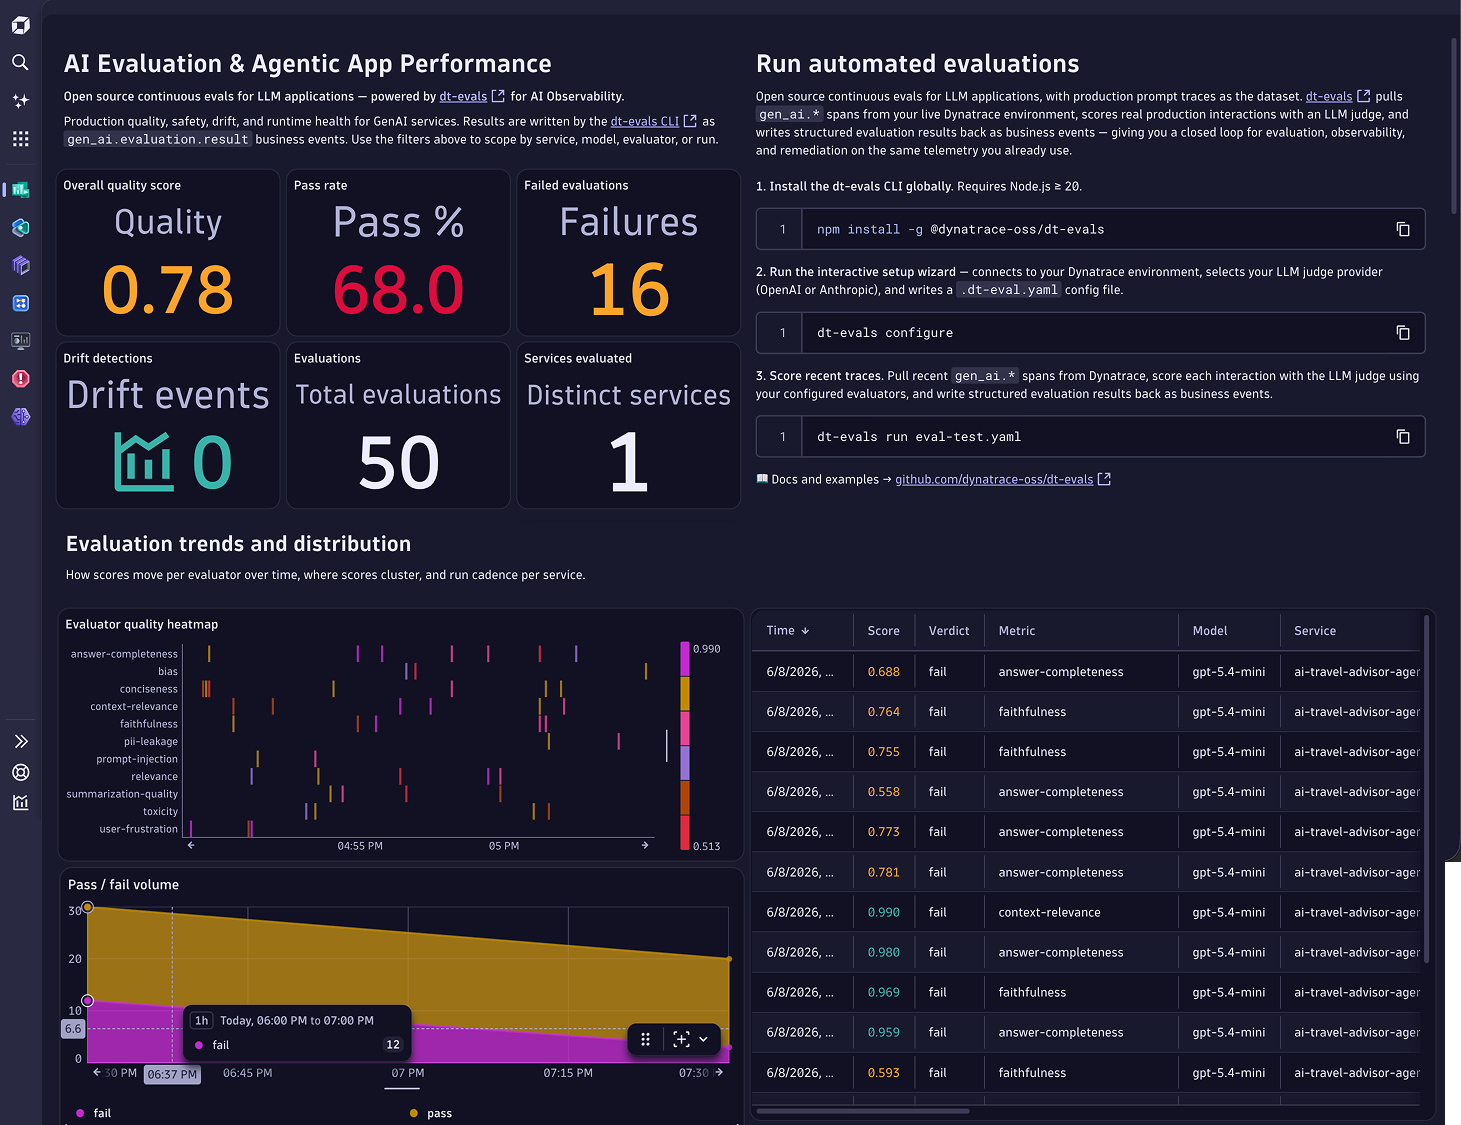
Dynatrace OneAgent now automatically instruments Python applications that use AWS Bedrock, OpenAI, Azure OpenAI, and LangChain. Dynatrace captures distributed traces, logs, and AI-related telemetry for supported model interactions — provider, operation, model, duration, token usage, and prompt and completion metadata where available. To capture prompt and completion content, go to OneAgent features and turn on Python OpenAI prompt capture.
The same visibility extends to teams using OpenInference with OpenTelemetry (OTel). Dynatrace ingests OpenInference traces and normalizes them to the same gen_ai.* attribute schema — covering model usage, token consumption, prompts, completions, agents, tools, embeddings, and guardrails — so OTel-instrumented applications get consistent telemetry without switching instrumentation frameworks.
As AI adoption grows, evaluation and instrumentation together turn AI services into observable, governable assets rather than black boxes.
Logs gains pattern analysis, Kubernetes insights, and in-context traces
Log analysis gets three meaningful upgrades.
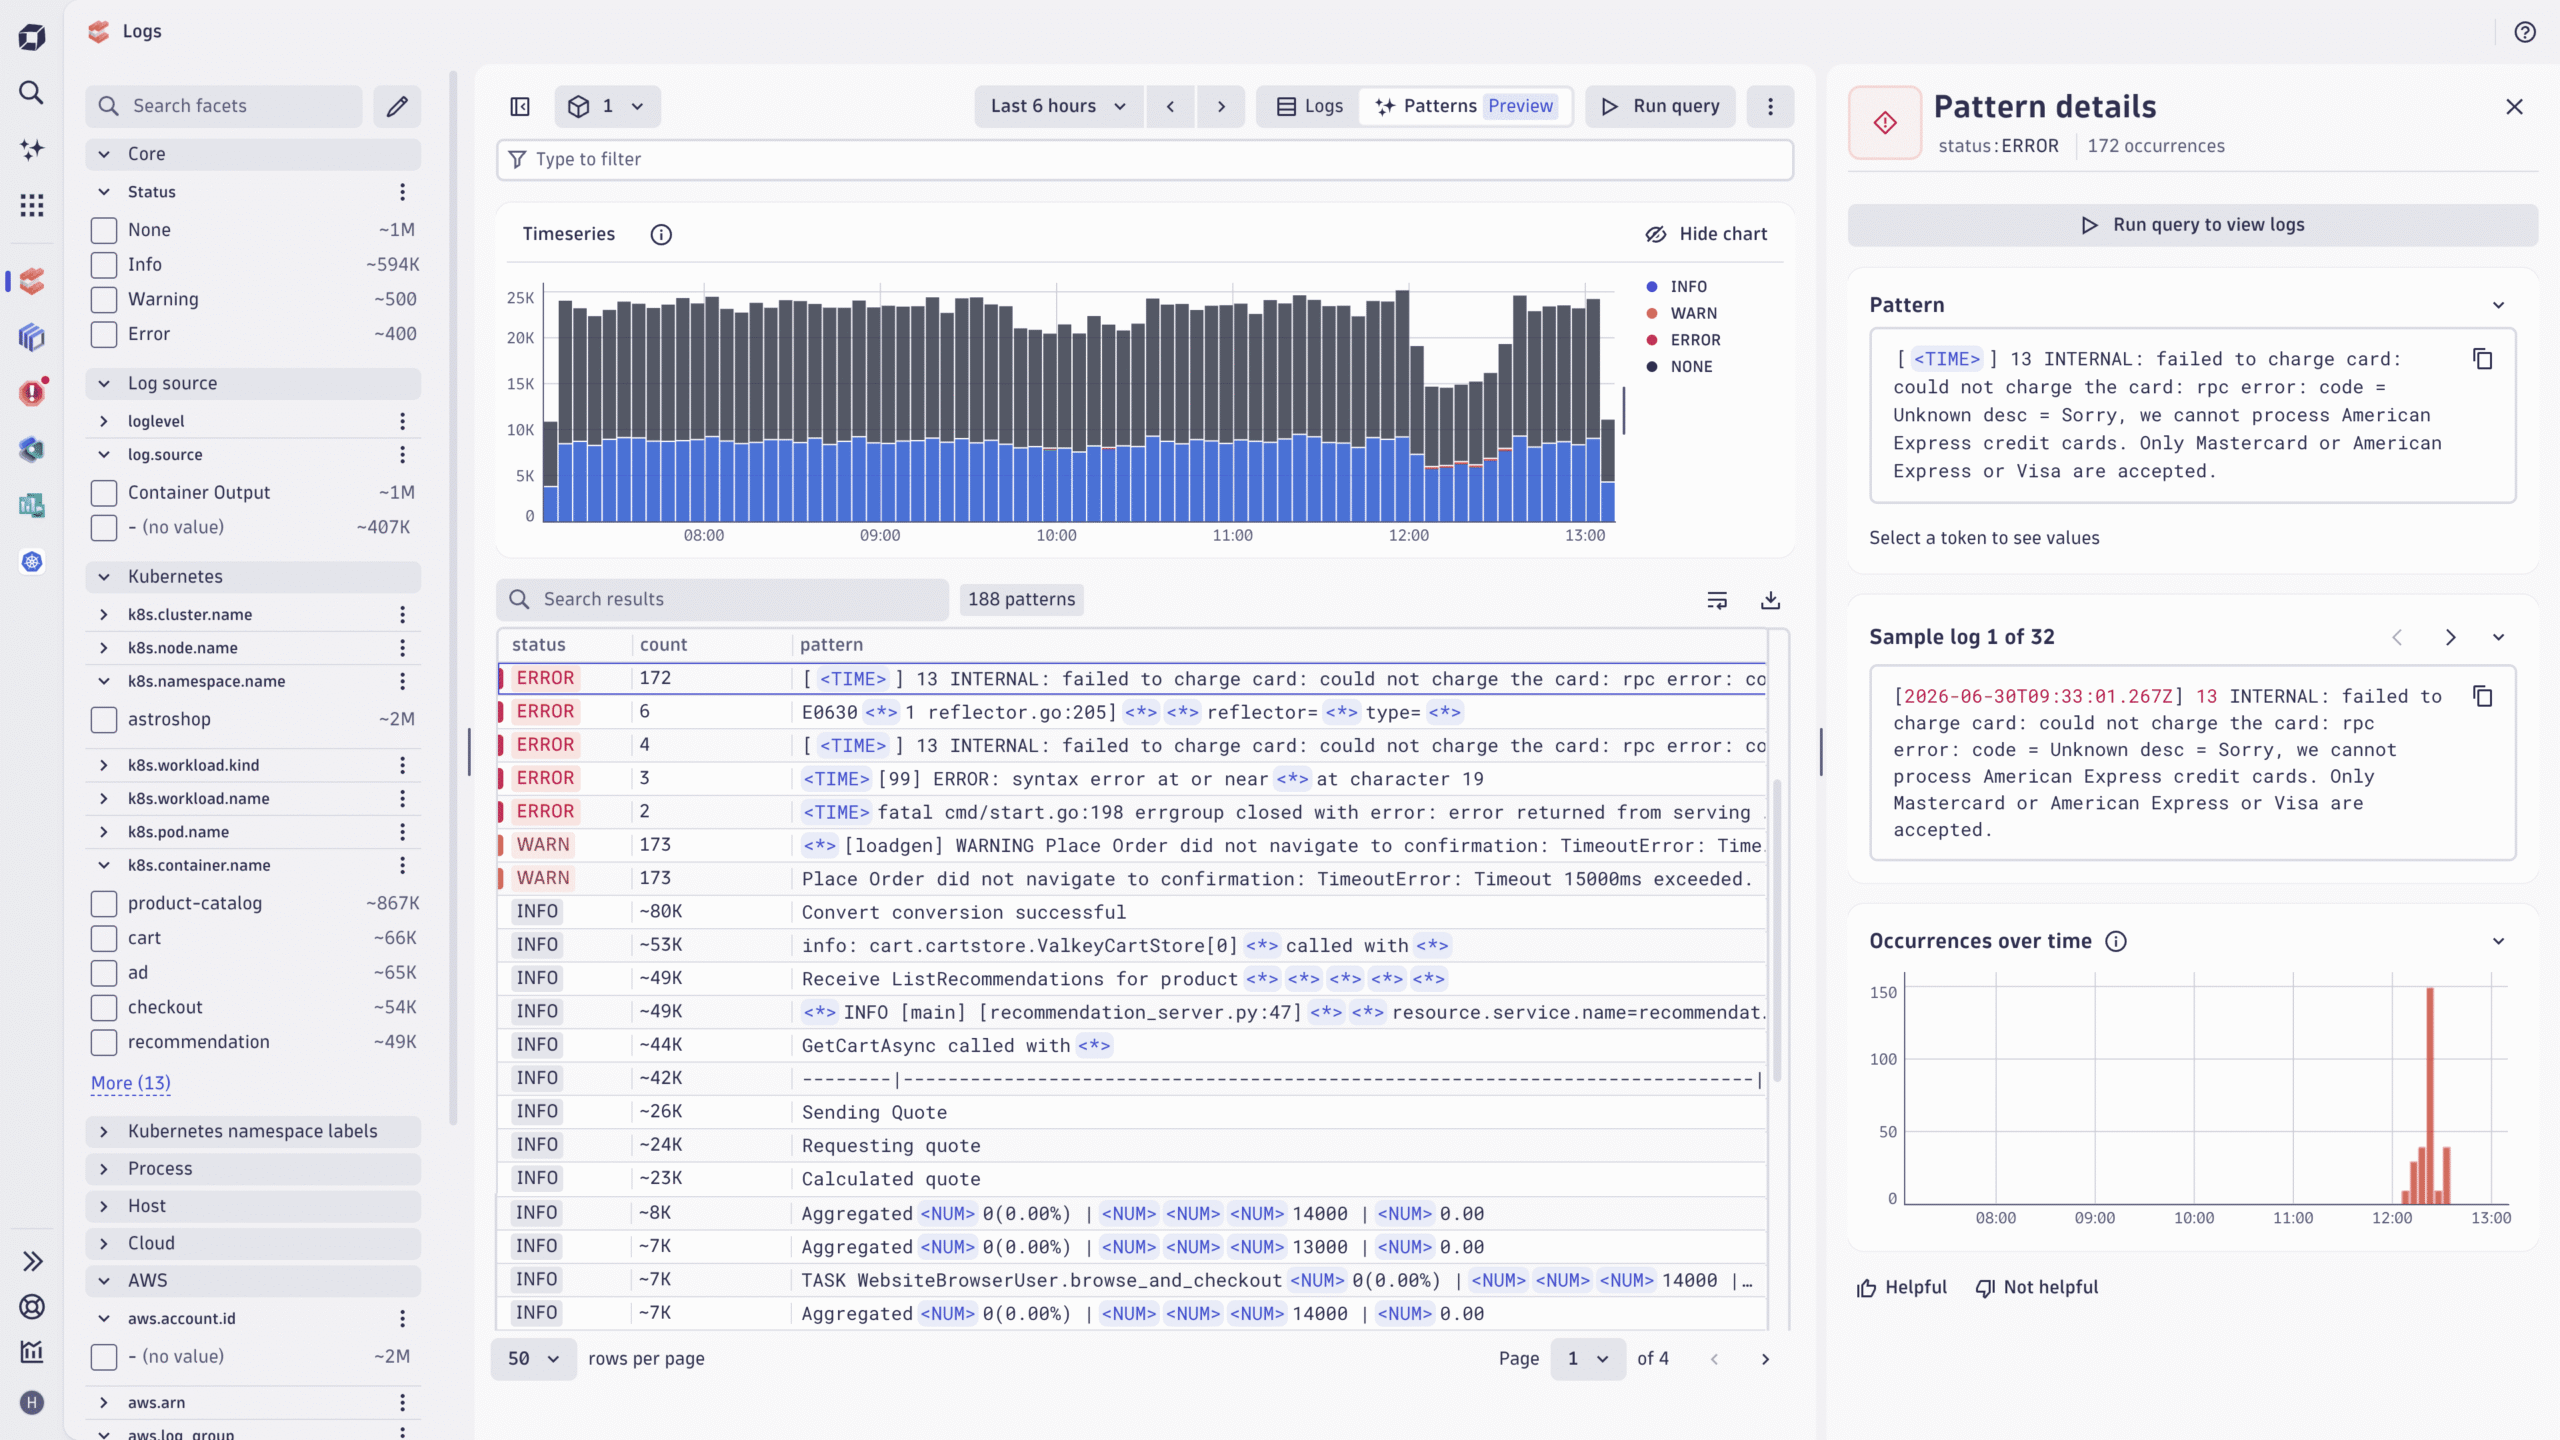
Log pattern analysis (Preview) lets you aggregate query results in Logs into patterns that cluster similar logs together. You can focus quickly on recurring errors, reduce thousands of similar logs to a handful of patterns, recognize the changing parts of a pattern (and their datatypes), and reuse the generated Dynatrace Pattern Language (DPL) for other queries or in OpenPipeline.
In-context trace details mean that when you investigate a log entry with trace context, you can open the associated trace directly inside Logs. A waterfall icon signals that you stay in context rather than navigating away to Distributed Tracing.
Log insights in ready-made Kubernetes dashboards provide built-in log analytics for clusters, namespace workloads, namespace pods, and node pods. Error log counts appear alongside health metrics, with log level distribution and severity trends below. Direct links to the Logs app ensure that a deeper investigation is only one click away.
Faster service investigation with the Services Explorer Preview
The Services app now includes a visual service map that overlays performance and health indicators on service-to-service relationships and messaging flows. It’s the fastest way to understand blast radius during an incident, providing a single view of topology context, performance signals, and bottlenecks without switching views.
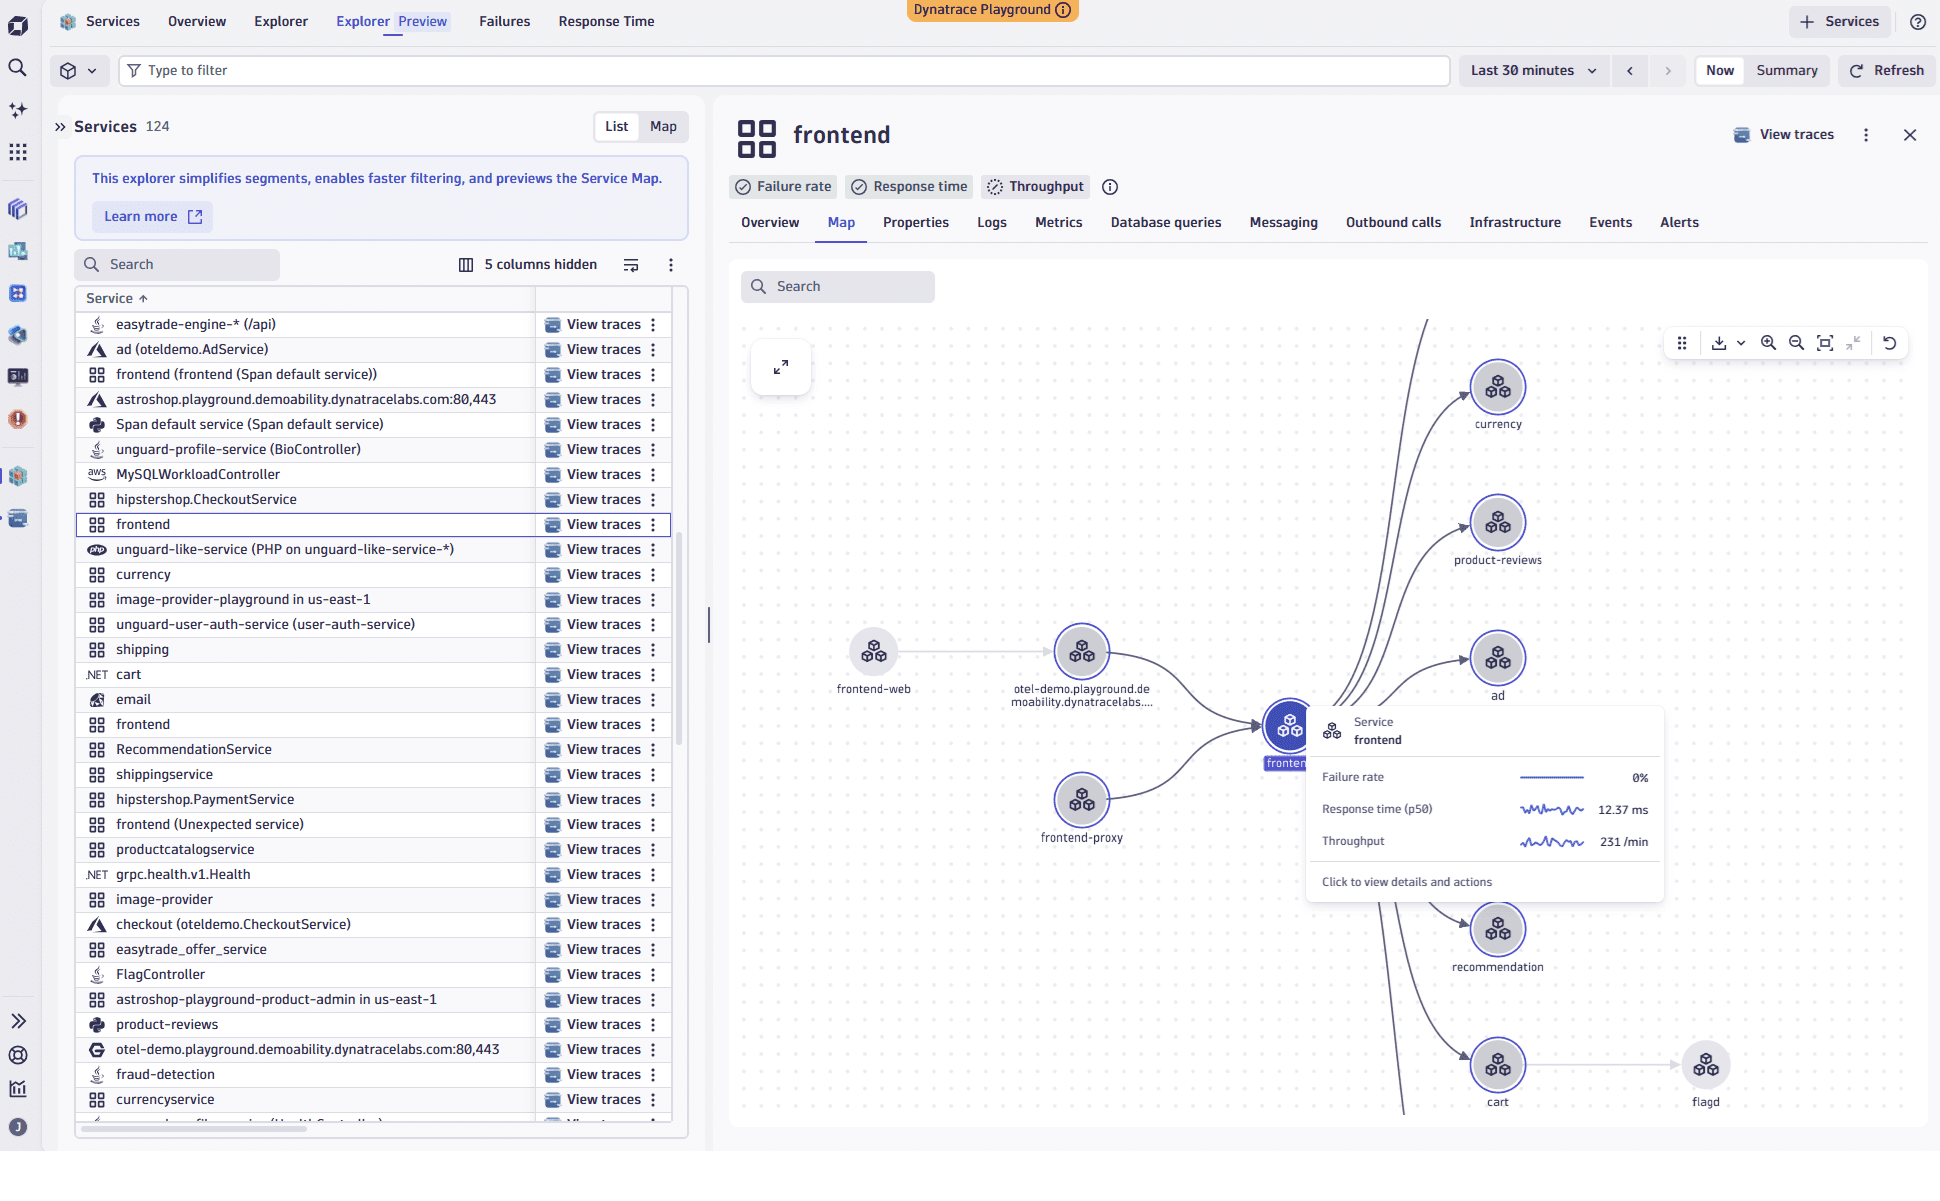
You can also filter services directly by primary Grail fields such as k8s.cluster.name, k8s.namespace.name, aws.region, and azure.location — the same attributes that power segments across Dynatrace. Both capabilities are available in the Explorer Preview view and open for feedback before general availability; see the Community post for details.
New security integrations and a Kubernetes security tab
Threat Observability expands its ingestion options with new integrations. Dynatrace now integrates with Checkmarx for software composition analysis and container security findings, and adds CrowdStrike and Kyverno integrations — pulling detection findings and Kubernetes policy compliance data into Dynatrace as security events. For Kyverno, see Ingest Kyverno compliance findings.
Kubernetes monitoring also gets a dedicated security tab (Kubernetes app version 1.42.0+) that replaces the Vulnerability tab in the Explorer, bringing security context into the same place teams already investigate cluster health.
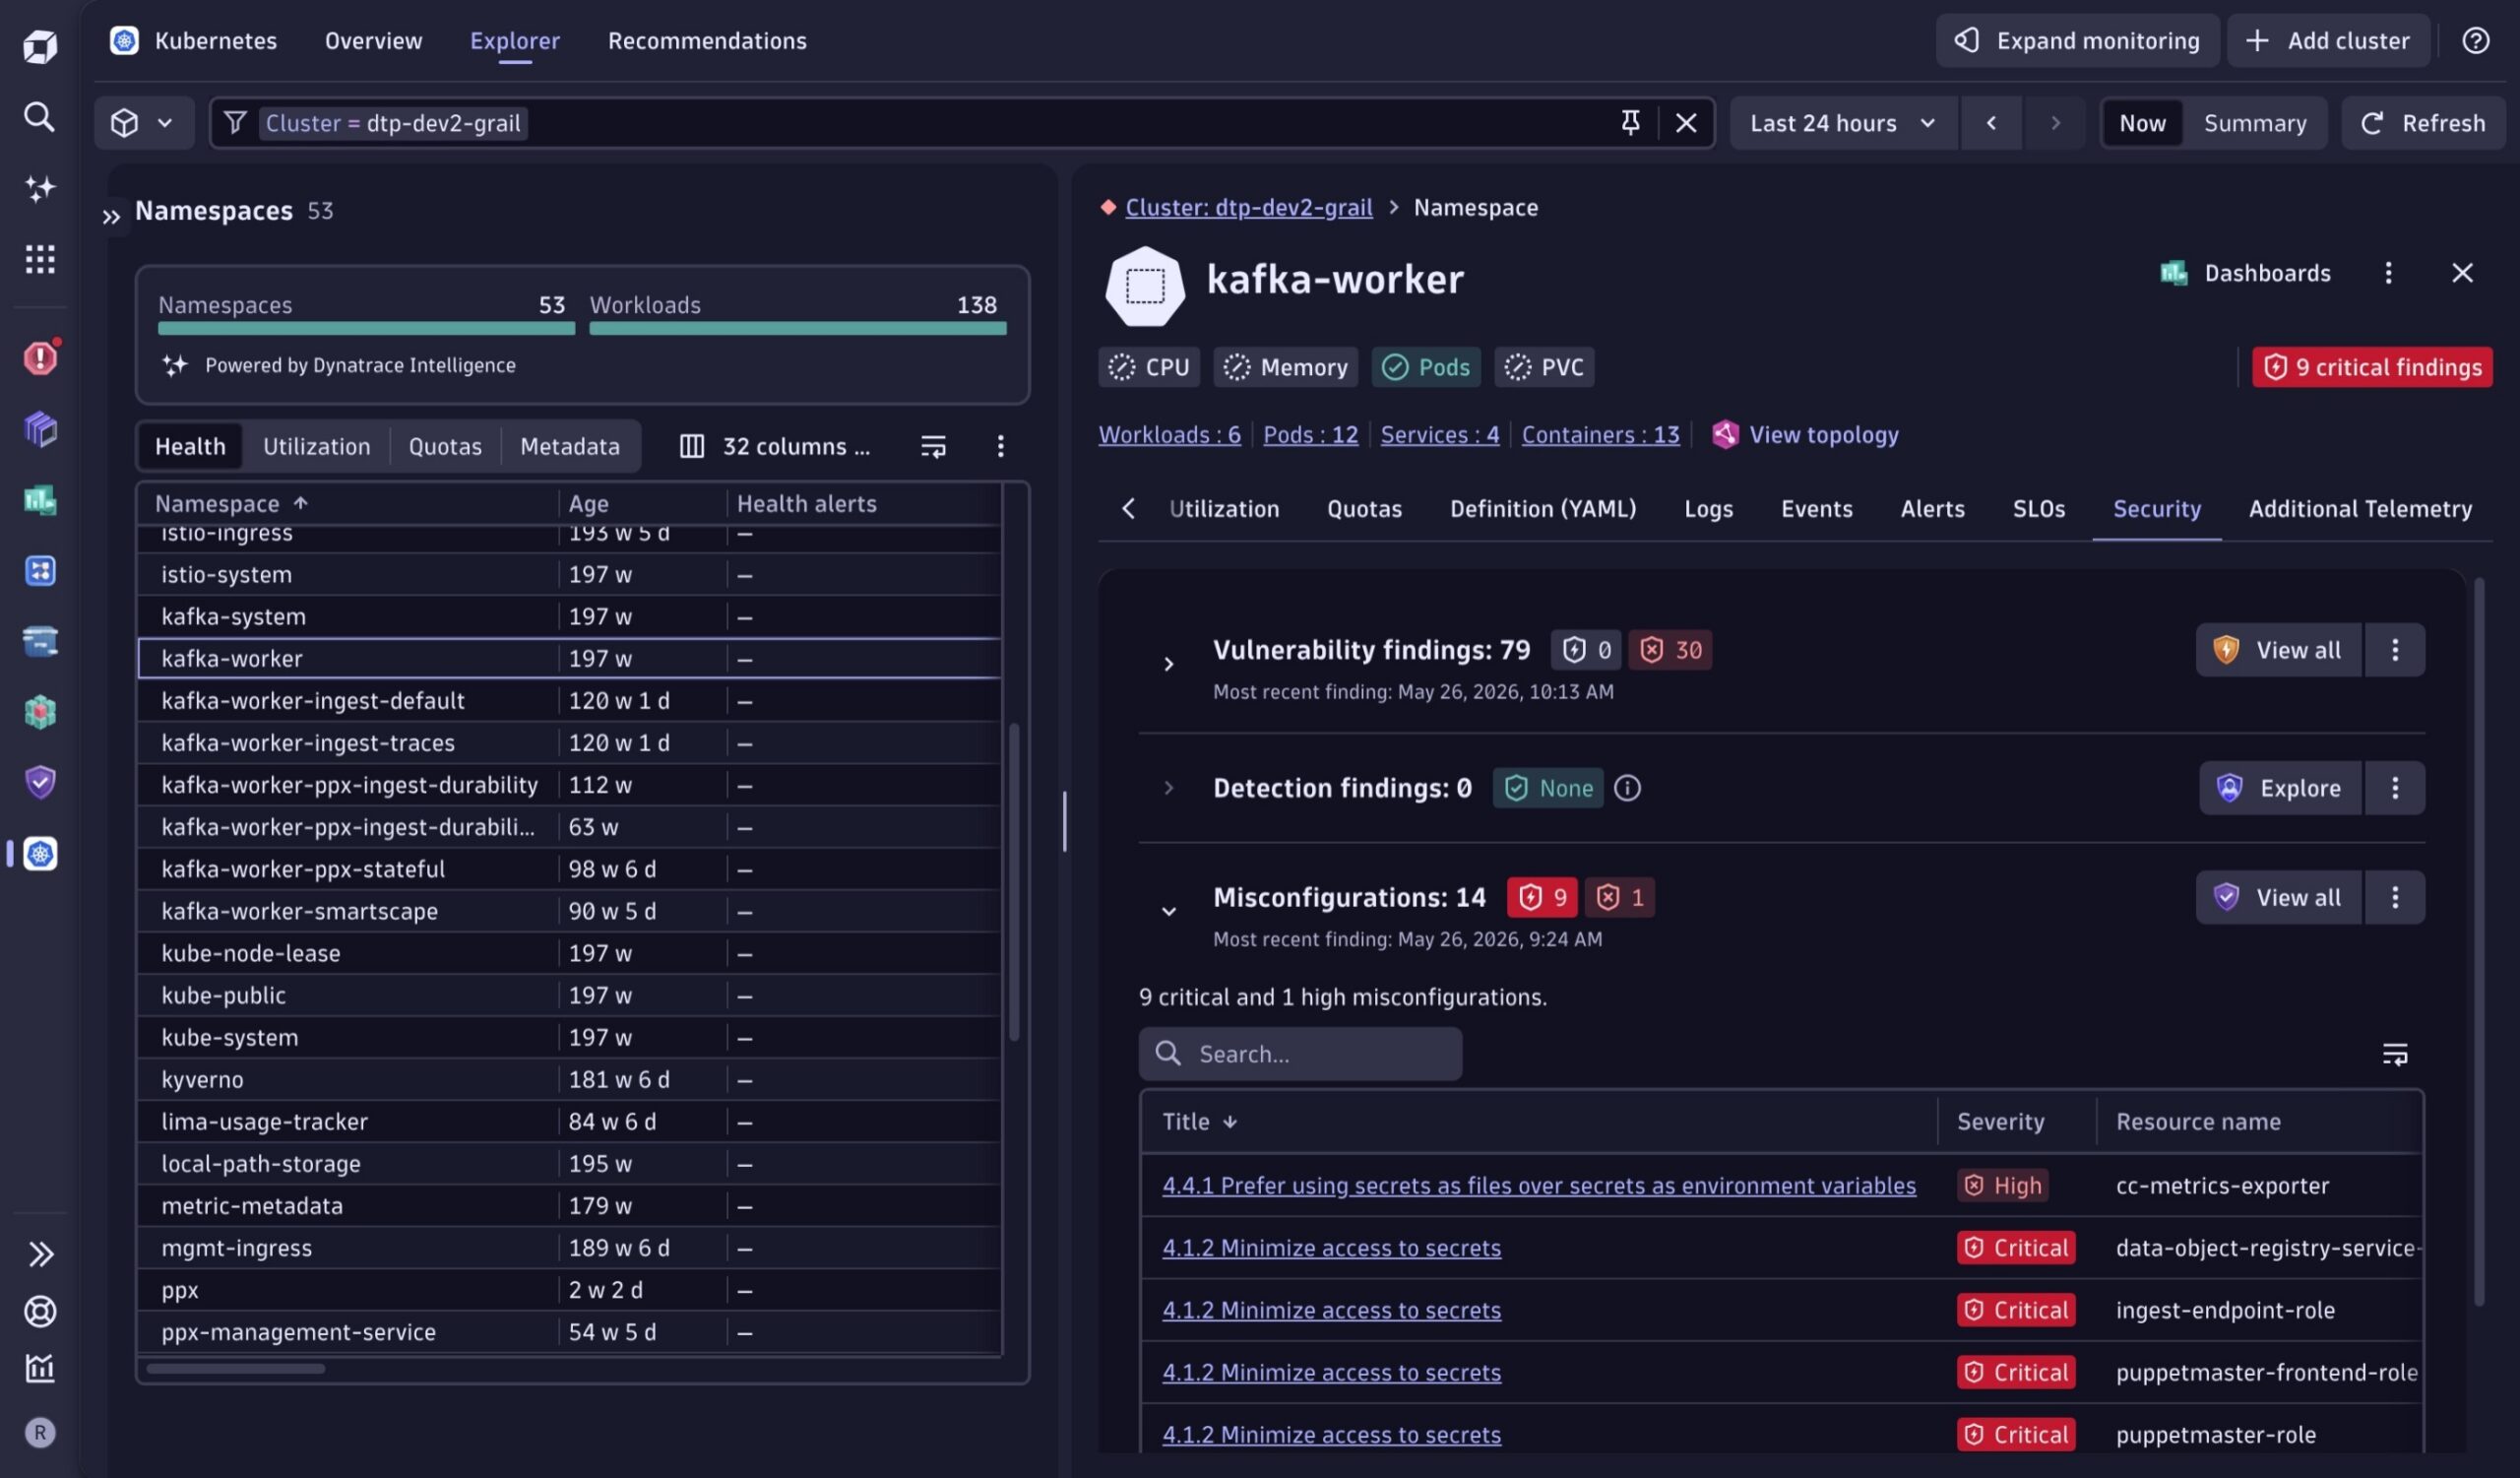
Runtime Vulnerability Analytics now has a native interface, replacing the legacy management-zone-based monitoring rules with a single consolidated workflow.
One change worth flagging for security teams: ingested security.events must now carry a timestamp within −1h/+10min, tightened from the previous −24h/+10min window. Events with older timestamps are dropped, so please review any pipelines that backfill security events.
Performance, drilldowns, and navigation improvements
Improved discovery of ready-made dashboards. Ready-made dashboards deliver instant insights without requiring complex queries. Finding, installing, configuring, and customizing them is now more straightforward — so new users get value faster and experienced users can build confidently on best-practice templates.
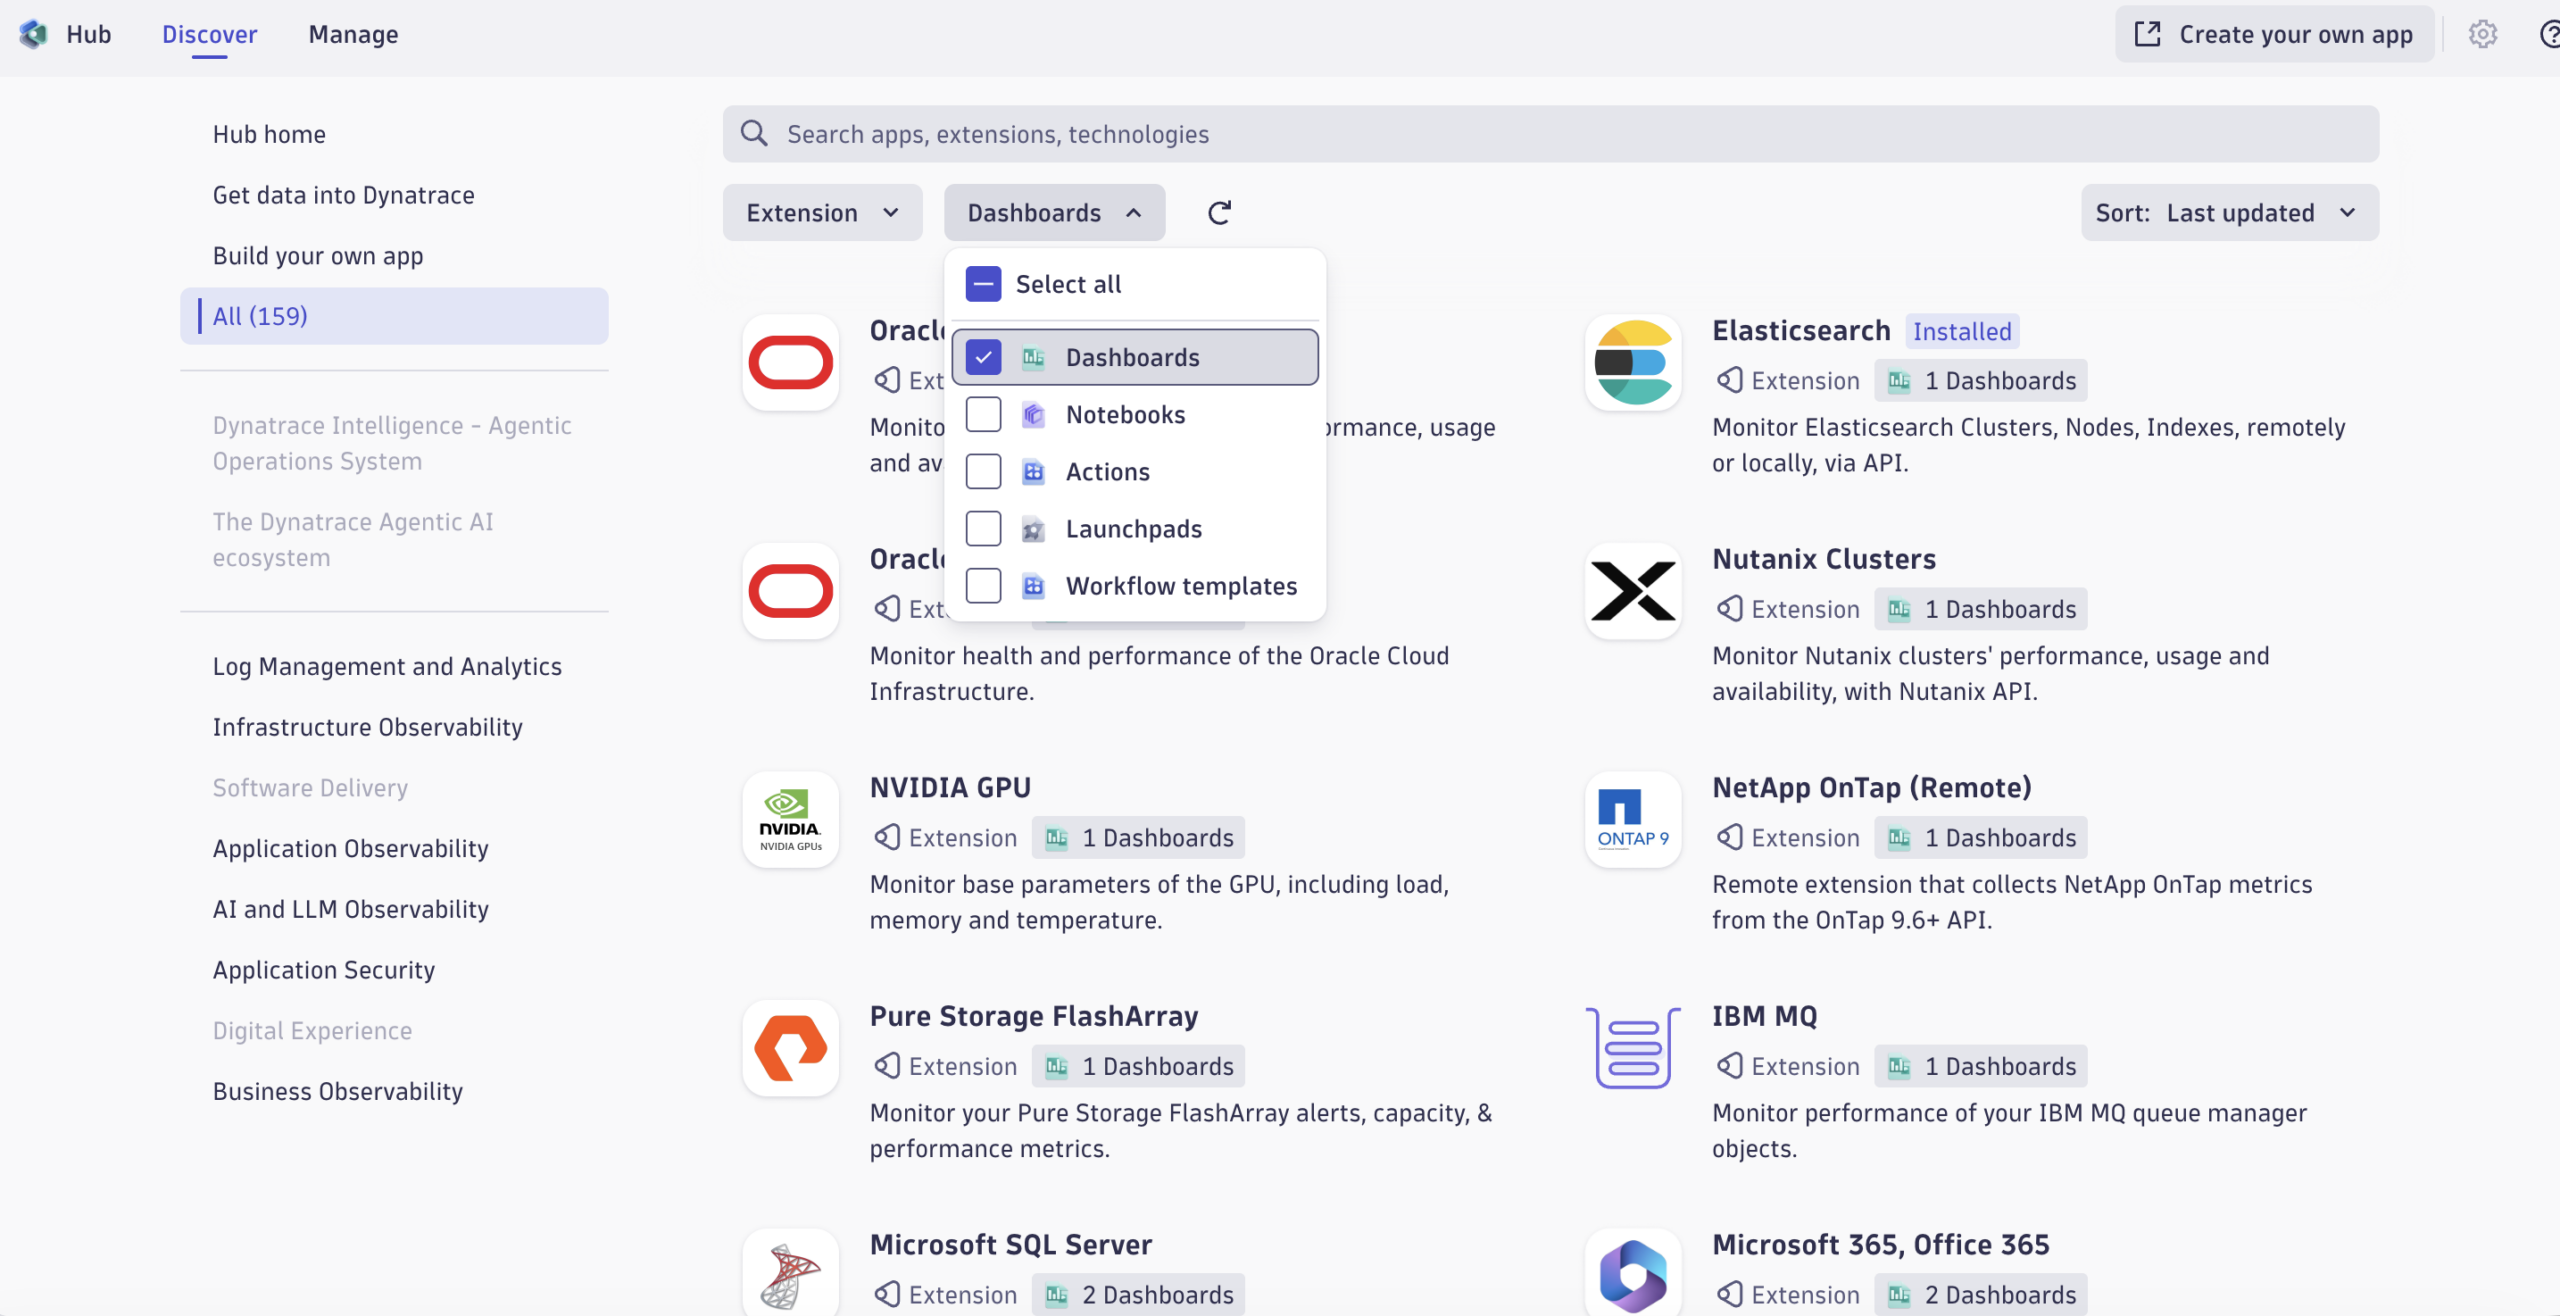
Contents tab added to all extension apps. All extension apps in Dynatrace Hub now include a Contents tab that surfaces the extension’s ready-made dashboards, so you can quickly go from installation to insights.
Session Replay has two improvements:
- Full-screen mode is now available, removing viewport constraints during playback.
- Navigating to a session through Error Inspector now opens Session Replay directly in context, keeping the investigation continuous.
Cleaner Smartscape topology. Inactive Synthetic Locations no longer appear in Smartscape, keeping topology views focused on what’s live.
Smartscape navigation for database tables and indexes. Direct navigation intents let you jump from a database node to its table or index detail view in one click.
Filters stay with you. Automated filtering suggestions scope correctly to OR and AND conditions across all apps. Filter state, search terms, and highlights survive page reloads. HTTP Status Filter selections persist through navigation steps in Distributed Tracing.
DQL durations support decimals. Duration literals (h, m, s, ms, us, ns) now accept decimal numbers — for example, 0.5h or .2m. Note, however, that this doesn’t apply to calendar durations.
More headroom in Distributed Tracing. The log viewer no longer caps at 1,000 entries, with full deduplication across trace and span IDs. Span scan limits are configurable from settings (default 5,000, up to 10,000). Field naming is also cleaned up — Smartscape fields drop the redundant prefix, and classic ME fields are clearly labeled.
More allowlist entries for external requests. You can now add up to 100 allowlist entries, double the previous limit of 50, with existing entries preserved across all environments.
Affected entity names enriched in problem records. A new affected_entity_names array is now populated alongside the existing affected_entity_ids and affected_entity_types arrays, index-aligned across all three.
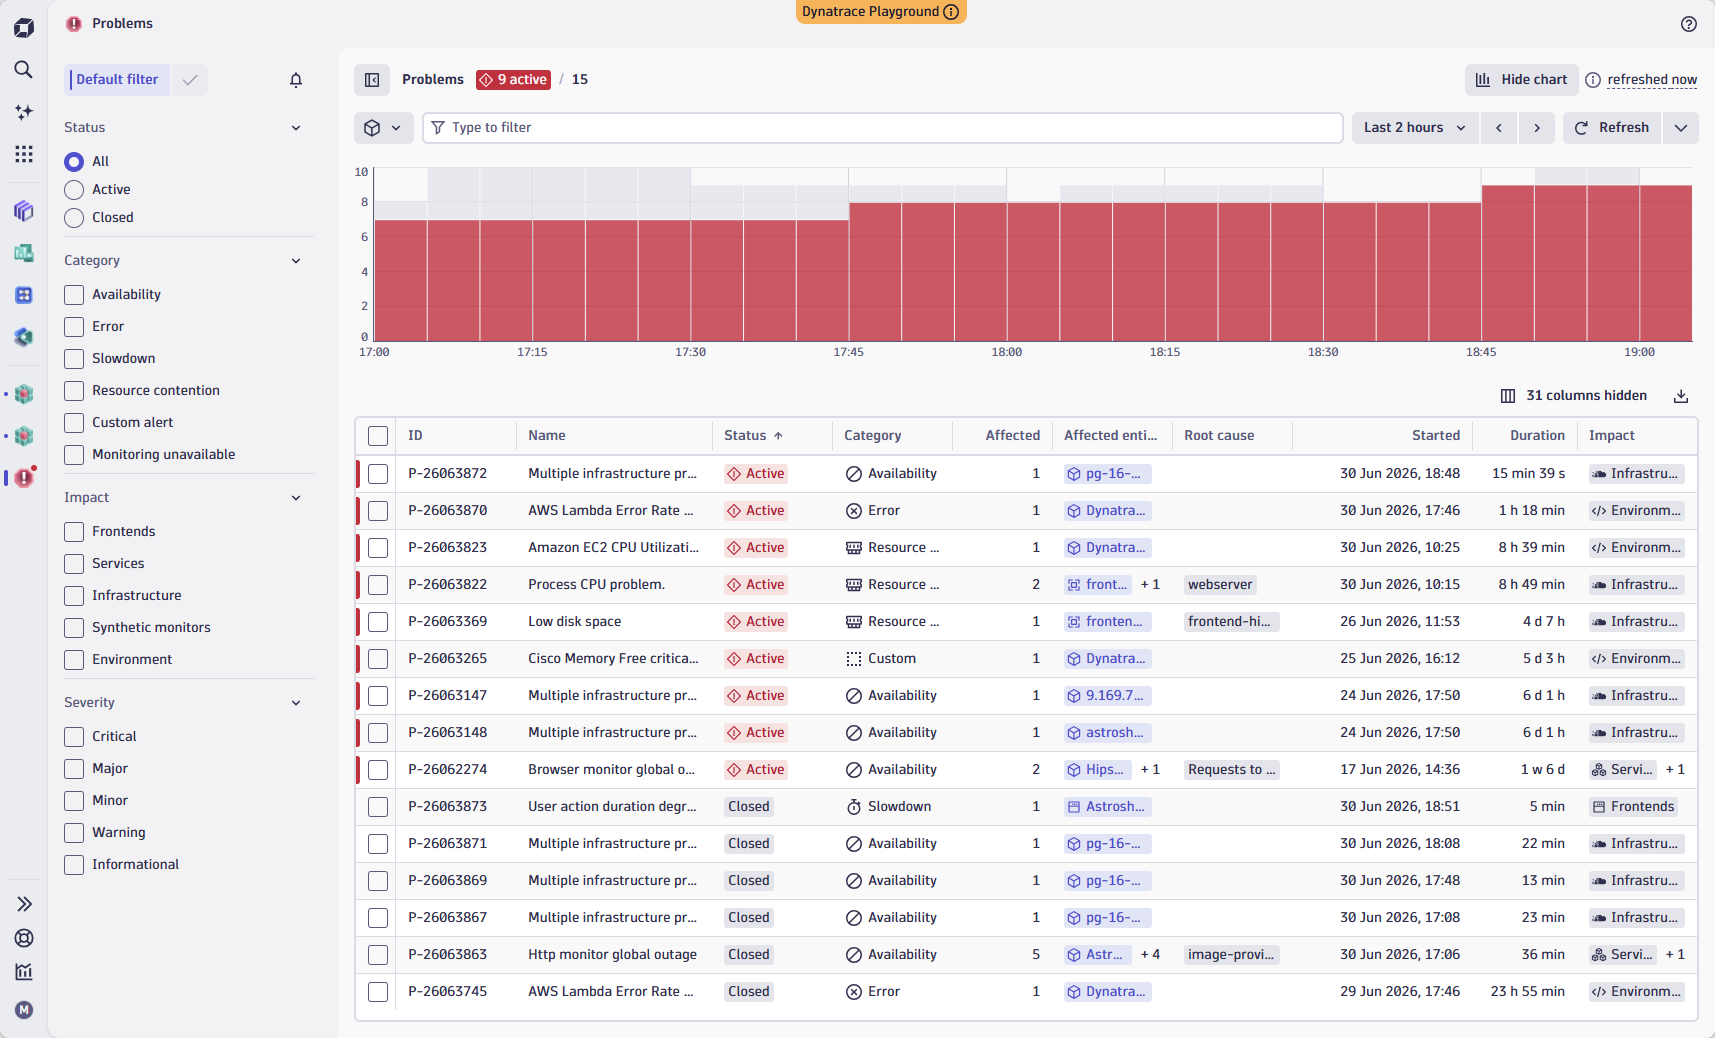
This brings the 3rd-gen platform to parity with classic problem notifications and enables notification workflows and external integrations to reference entity names without additional lookup. The Problems app v1.27 reached General Availability on June 29.
Proactive Cost Intelligence across your entire stack
Dynatrace now makes it easier to understand costs, act before they spike, and optimize with less effort. New Optimize documentation walks Dynatrace Platform Subscription (DPS) customers through the full journey from understanding to optimizing costs, aligned with the FinOps Foundation framework.
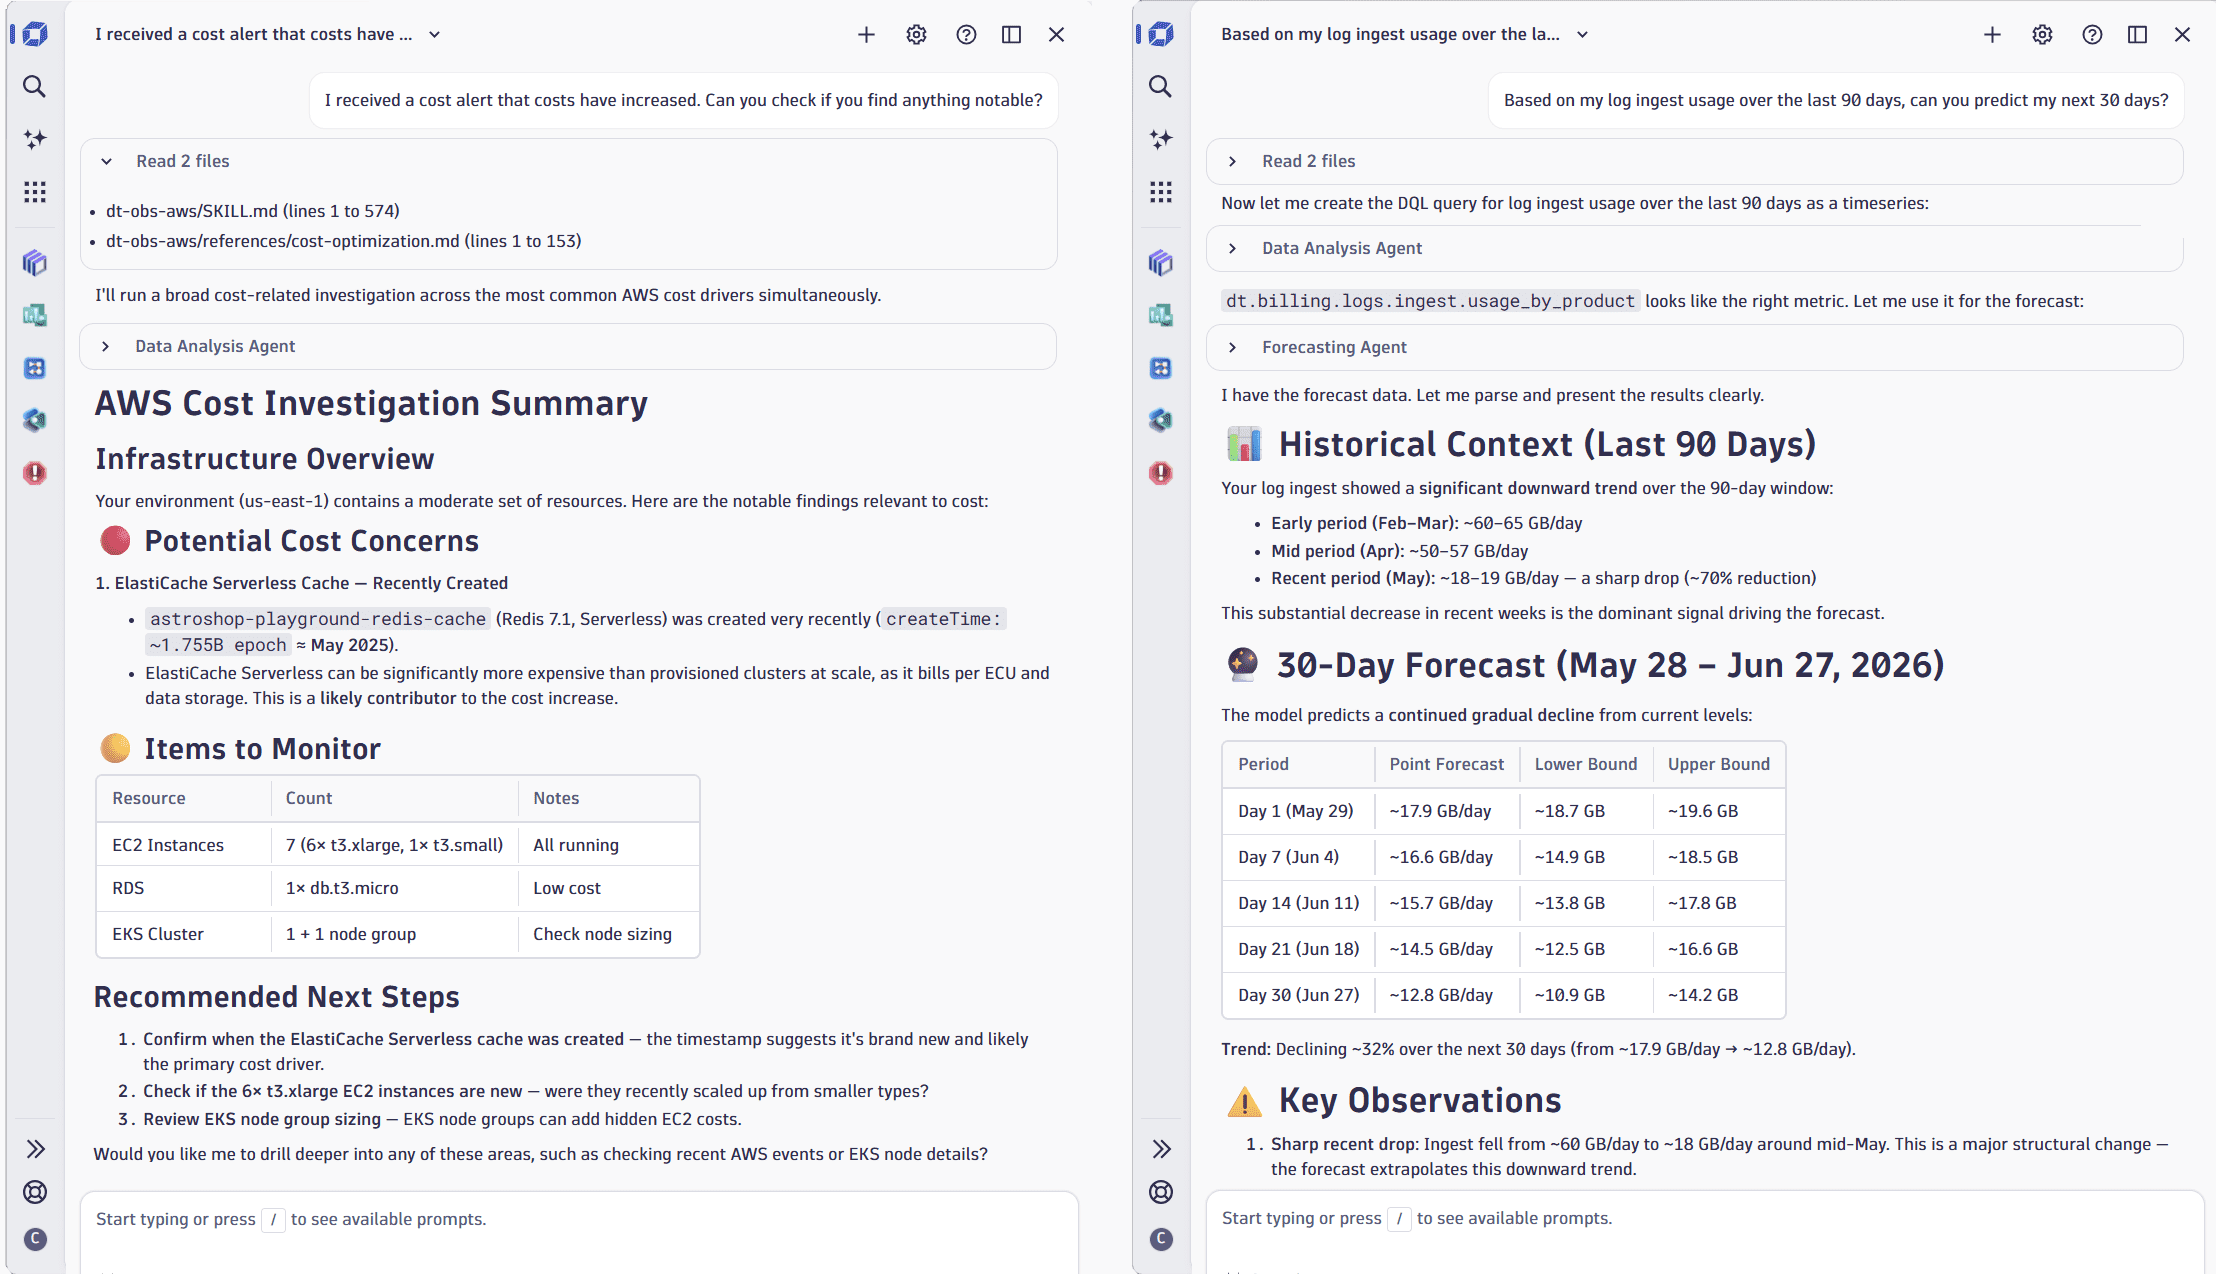
The bigger shift is that Dynatrace Assist can now do the cost analysis work for you, designed to reduce the need for specialist expertise. You can ask it to:
- Understand spikes — “I received a notification that costs have increased. Can you find anything notable?” returns the root cause along with a full drilldown into your billing_usage
- Predict costs — “Based on my log ingest usage over the last 90 days, can you predict my usage for the next 30 days?” returns a capability-level forecast based on actual consumption, useful when onboarding new teams.
- Optimize usage — “Are there any log queries duplicated by multiple users?” surfaces overlapping queries with concrete suggestions to improve them.
For more on building cost discipline into your observability practice, see Driving your FinOps strategy with observability best practices.
Why these changes matter
Taken together, the June releases make everyday investigation work feel less fragmented. You get more context in the places where teams already troubleshoot: a fuller Smartscape view, AI quality signals alongside performance data, log patterns that identify root causes faster, service maps for incident response, and security and cost insights that are easier to act on without switching tools or relying on specialists.
These are the kinds of changes that add up across a week of real work.
Check out all these updates in action on our Release Radar launchpad.




Looking for answers?
Start a new discussion or ask for help in our Q&A forum.
Go to forum