
Built explicitly for large-scale IT environments, Dynatrace now provides an Operating System Services monitoring solution with an advanced, AI-powered alerting system, including last known state and optional availability metrics. This helps ensure all systems are running as efficiently and securely as possible and reduces the time and resources needed to maintain and monitor relevant systems.
Managing enterprise IT environments takes time
Being responsible for thousands of hosts requires tremendous effort from IT administrators. Besides establishing a secure and reliable environment, keeping up with system updates, implementing backup and recovery procedures, and setting up an adequate communication infrastructure with ticketing systems and other systems for tracking and managing changes and tasks, IT administrators must also monitor and maintain system performance.
Stay ahead of the curve with the OS Services extension for monitored hosts
The new Dynatrace OS Services monitoring capability for Windows and Linux hosts (Systemd is required) ensures that your systems run efficiently and potential problems are addressed as soon as they arise. OS Services monitoring assists in optimizing system performance and responding to service outages.
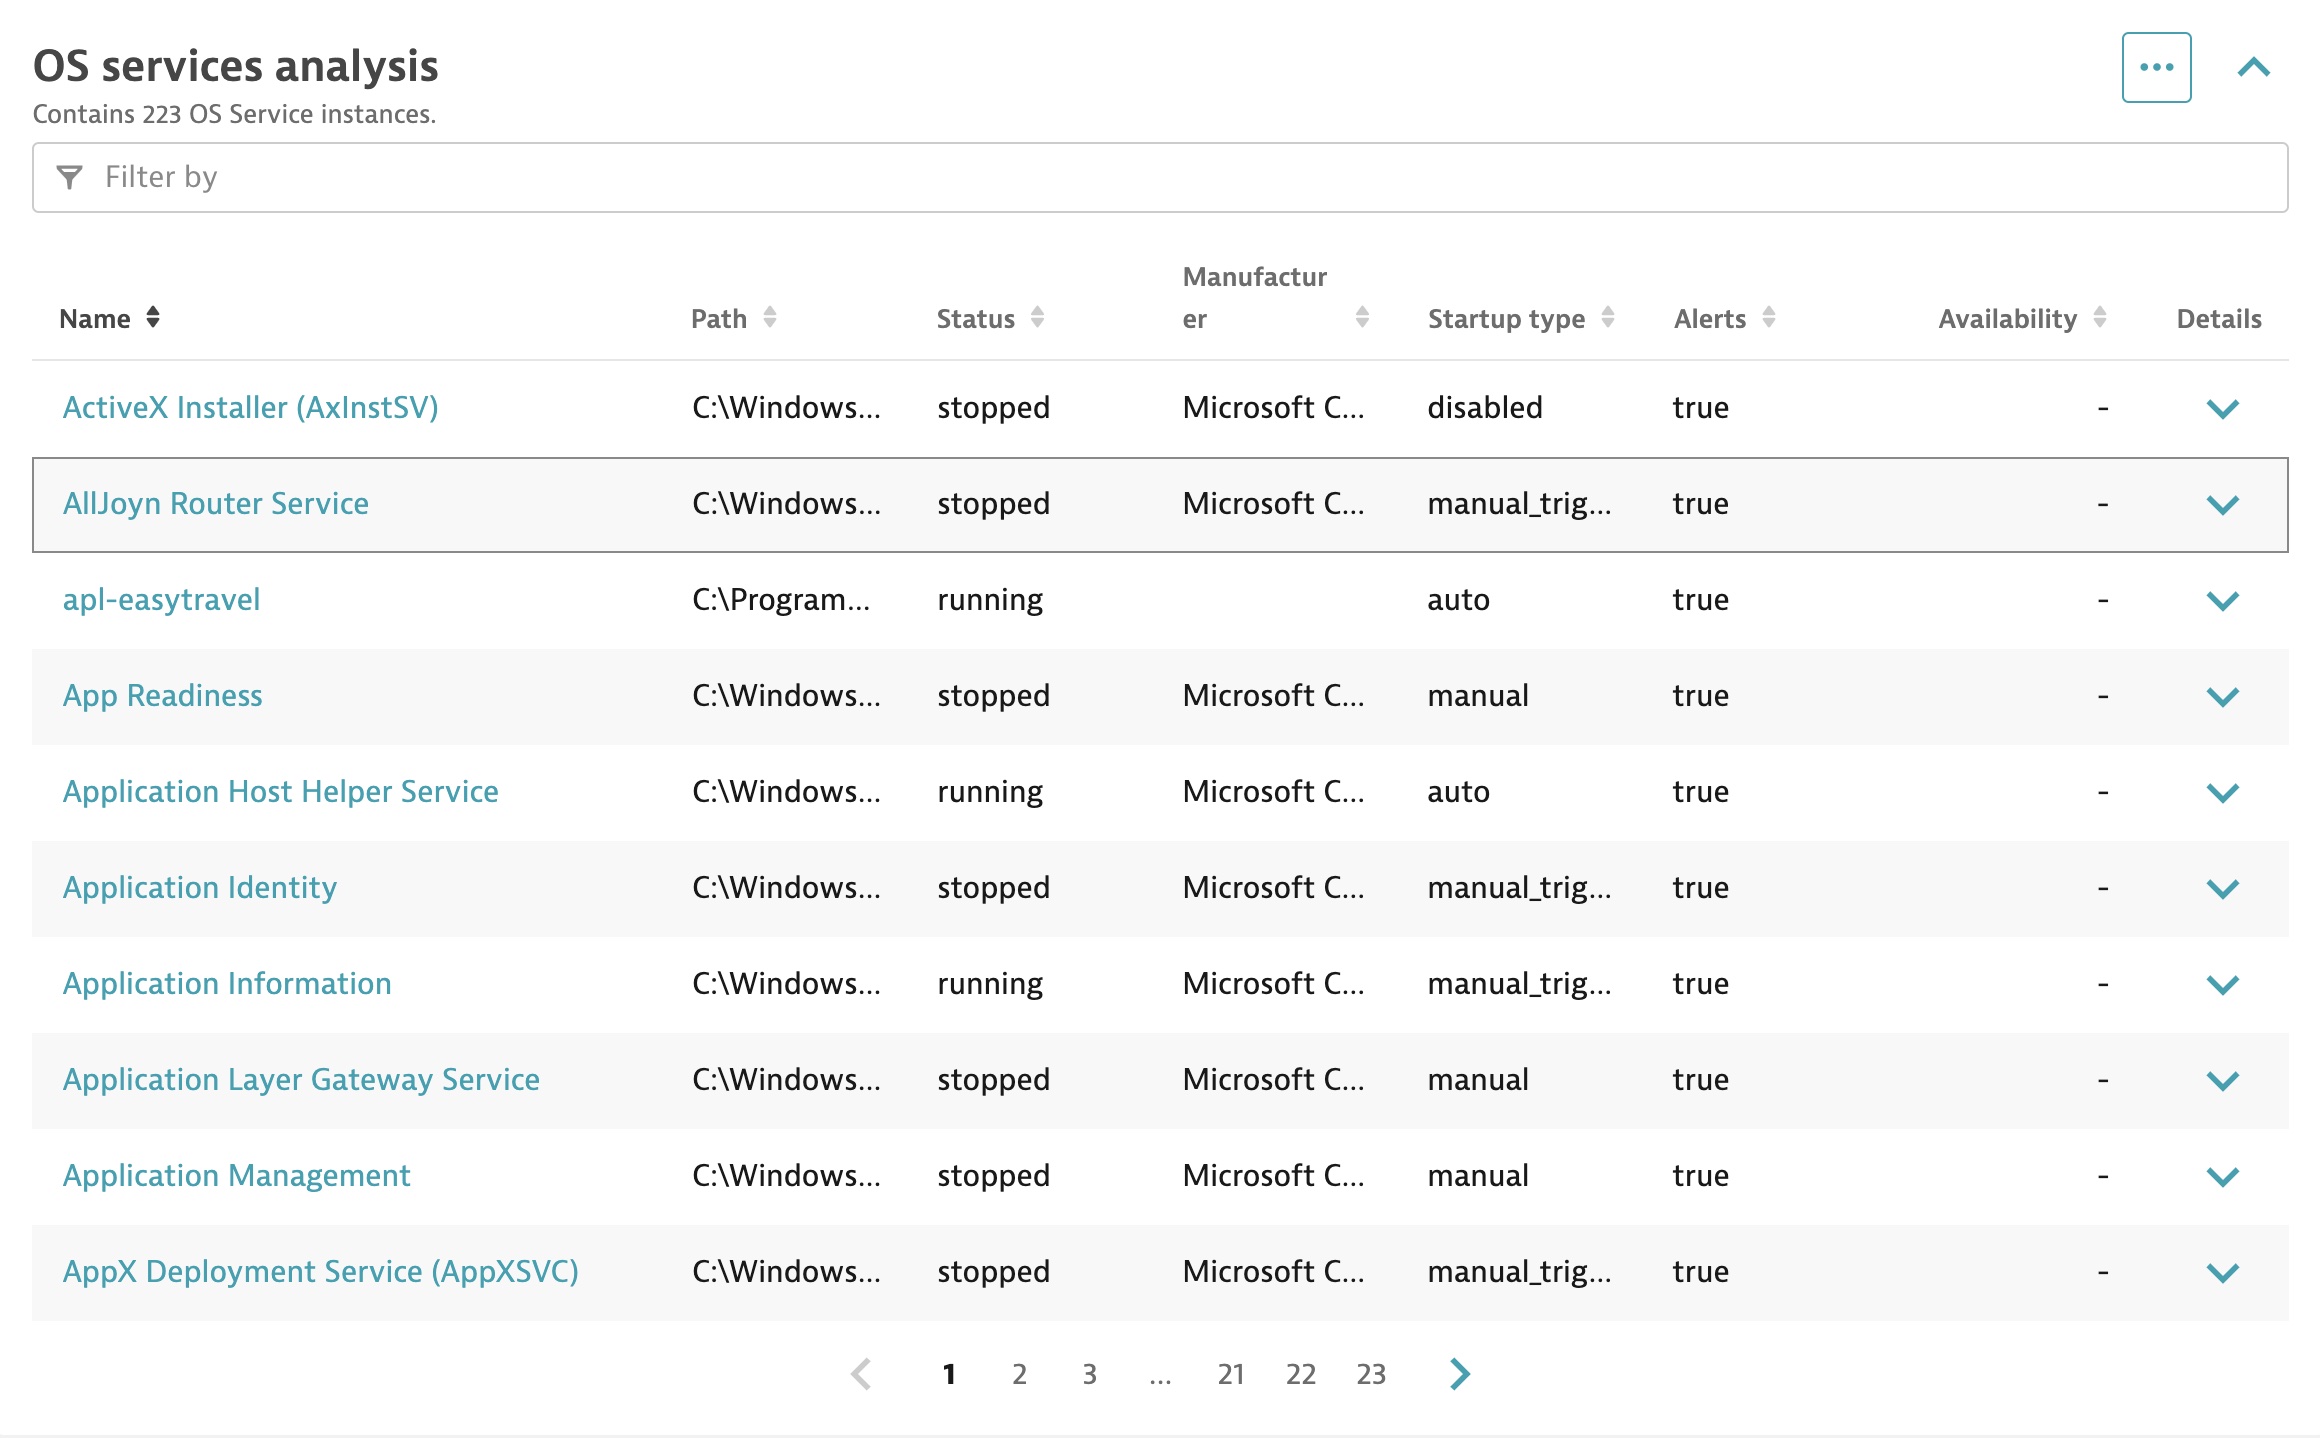
Out of the box, OS Services monitoring can be used to automatically track all OS Services in your environment. Automated alerting notifies you if one of your services isn’t running on both Windows and Linux.
For advanced use cases, a comprehensive detection rule engine supports virtually any requirement you have for detecting and alerting on issues with specific OS Services. You can, for example, configure detection and alerting rules for all Microsoft services or a specific subset of Linux services.
To broaden the scope of OS Services monitoring, you can choose to generate availability metrics for any monitored service (note that custom availability metrics consume custom metric DDUs).
The OS services analysis page in the Dynatrace web UI now displays a list of OS Services and other configured services, including their last known state.
Enterprise-grade scope and laser-sharp accuracy with the new rule builder
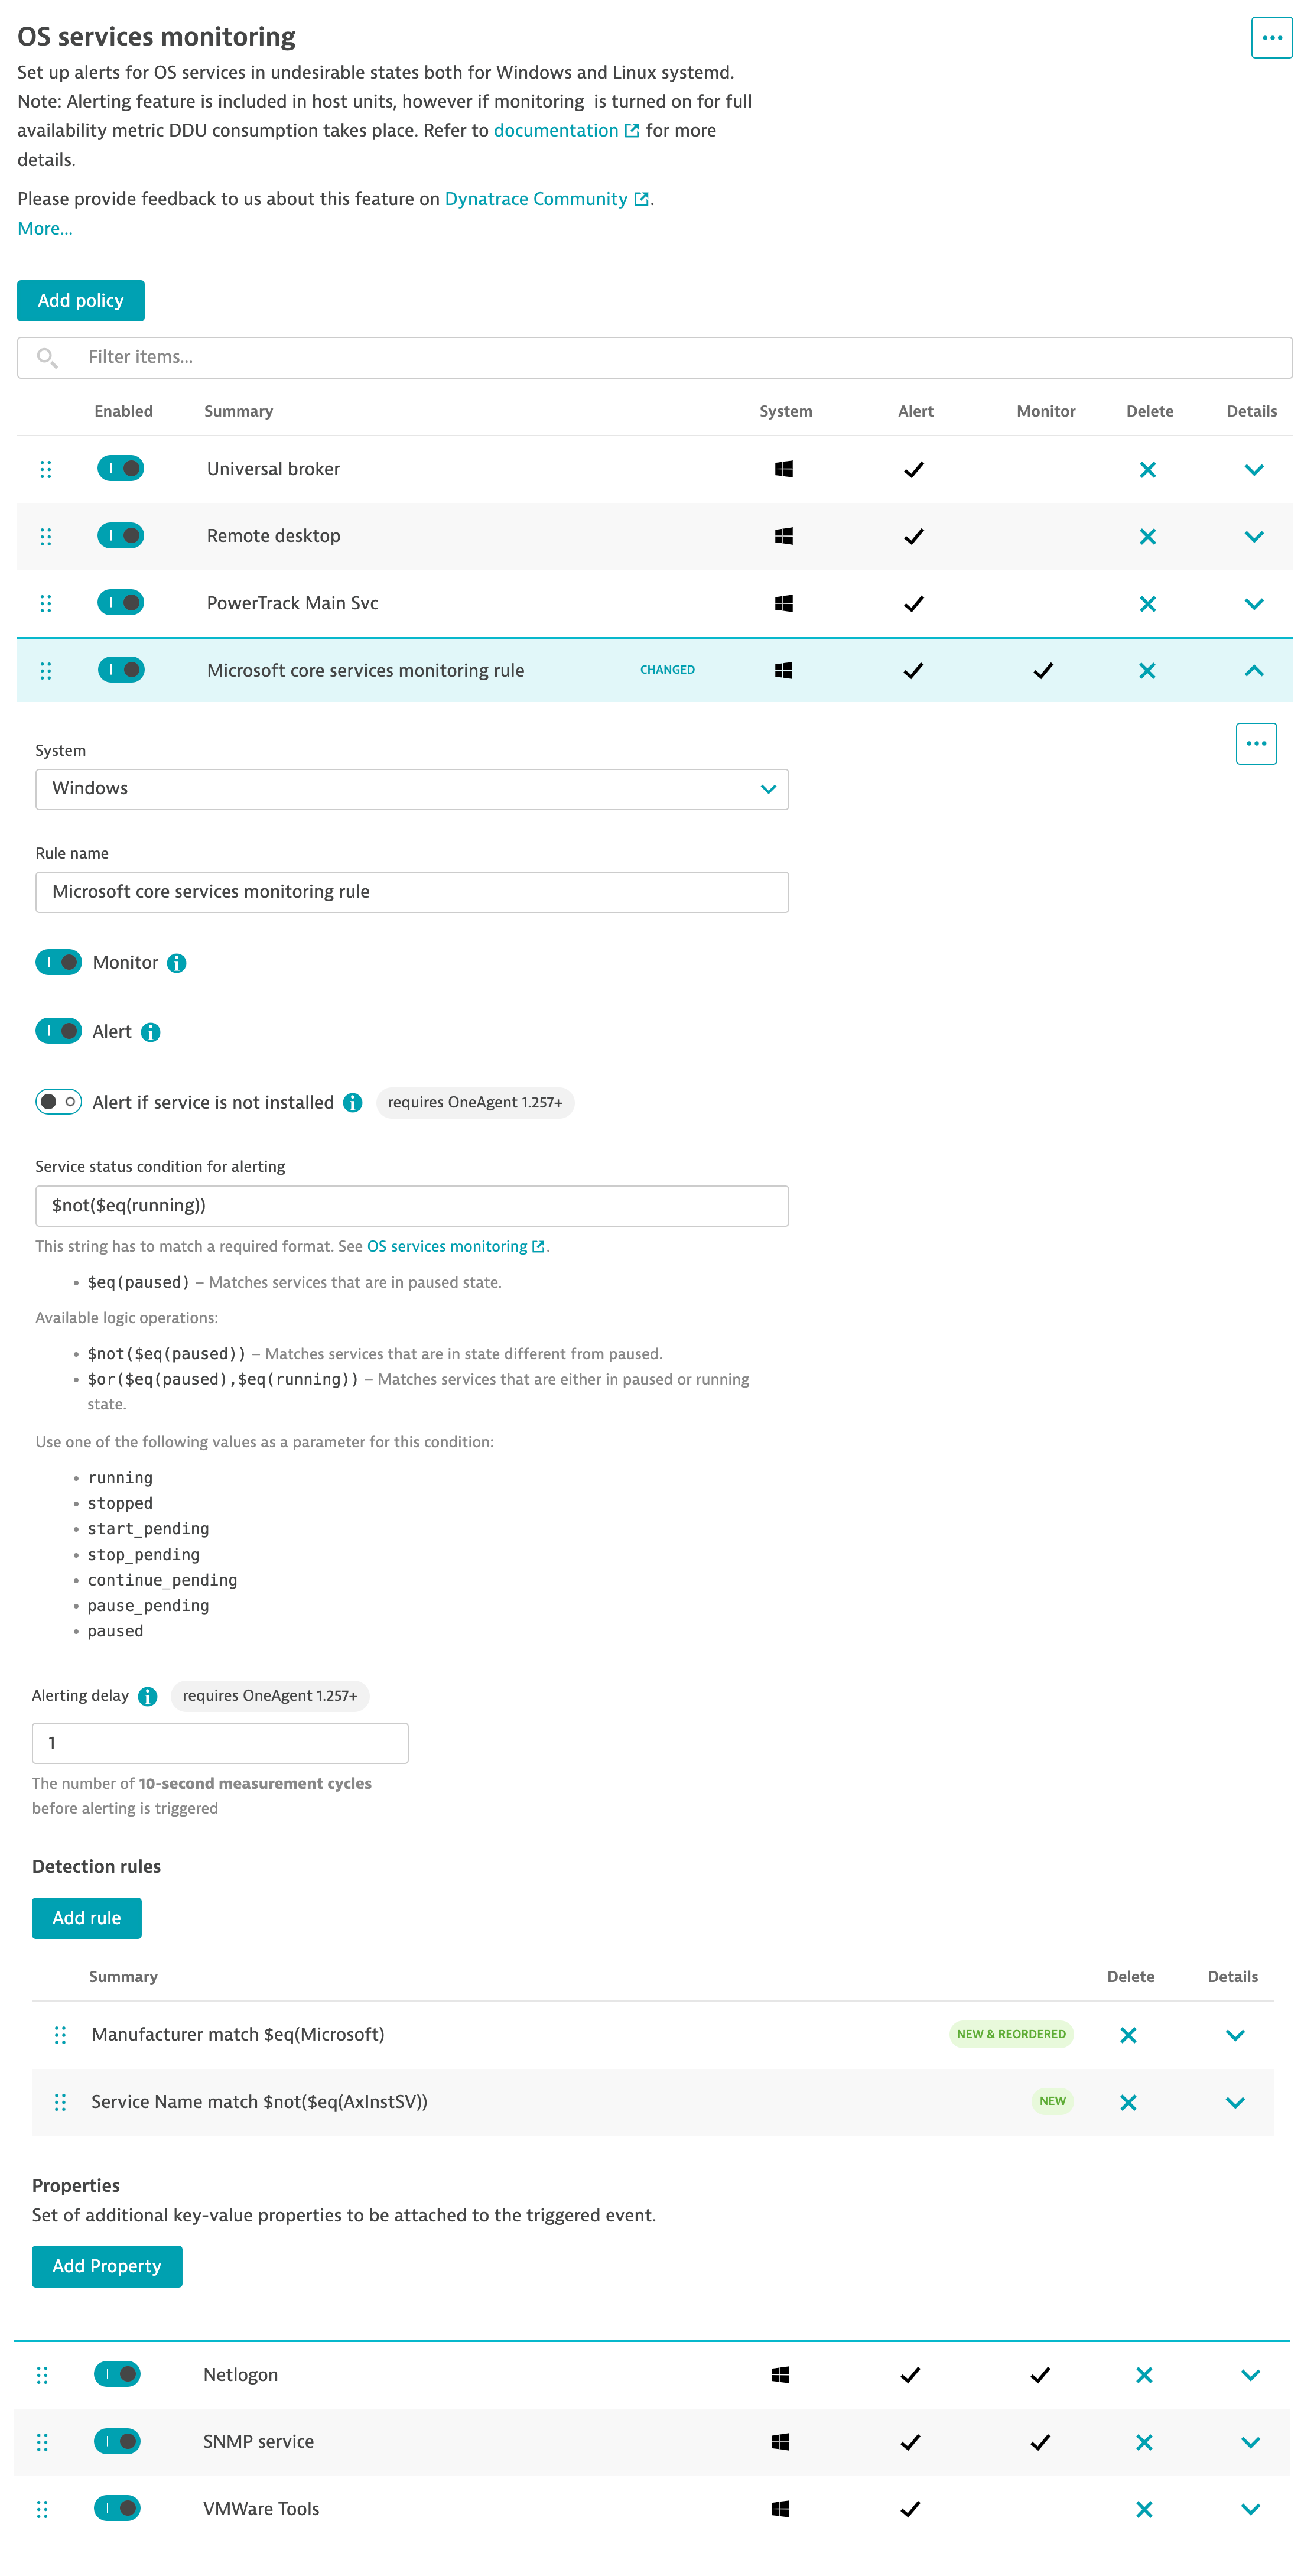
The new Dynatrace detection rule builder allows you to build flexible, yet powerful, alerting rules for thousands of hosts via either the Dynatrace web UI or API. Logical priority management of rules ensures that local exceptions can overrule global monitoring rules where applicable. For full details, see Dynatrace Documentation.
Rules can be configured and applied with varying scopes:
- Environment-wide, via global Settings
Go to Settings > OS Services monitoring - Across a host group, via host group settings
From the host group level, go to Settings > OS Services monitoring - Specific hosts, via settings for individual hosts
From the host level, go to Settings > OS Services monitoring
Flexible alerting rules for a proactive approach
Simple but powerful alerting rules can be set up to cover any alerting configuration requirement you have. Detecting all OS Service states is supported both in Windows and Linux systemd.
Service states available for Windows OS services:
- running
- stopped
- start_pending
- stop_pending
- continue_pending
- pause_pending
- paused
Service states available for Linux systemd OS services:
- reloading
- activating
- deactivating
- failed
- inactive
- active
Service properties available for both Windows and Linux OS services:
- StartupType
- ServiceName
Additional Windows OS service properties:
- DisplayName
- Path
- Manufacturer
- Status
These properties can be combined using logical statements. For example, to alert on all Microsoft services except the ActiveX service, the rules and property parameters would appear as:
Manufacturer $eq(Microsoft) [Rule for detecting all Microsoft services]
ServiceName $not($eq(AxInstSV)) [Rule for excluding the ActiveX service]
Rules can be configured and grouped via either the Dynatrace web UI or API.
Start monitoring your OS Services today
Start using OS Service monitoring today. In the monitoring section, go to OS Services.
We’d love to hear from you!
We’re always interested in your feedback.
Feel free to ask questions and provide feedback in the Dynatrace Community Feedback Channel.


Looking for answers?
Start a new discussion or ask for help in our Q&A forum.
Go to forum