
In this blog, we'll introduce the Kiro power for Dynatrace, show what it unlocks for developers, and walk you through how to get it up and running.
What is the Kiro power for Dynatrace?
The Kiro power for Dynatrace delivers live observability data, root cause analysis, and remediation suggestions directly into the Kiro IDE, with no JSON editing or manual MCP setup.
Kiro is an AI-powered IDE that helps developers move from idea to working code through spec-driven development and an agentic assistant. To make the assistant genuinely useful in unfamiliar domains, Kiro recently introduced powers: curated, partner-validated bundles of MCP servers, steering files, and best practices that install with a single click and load on demand when a relevant task comes up. Install a power, and Kiro’s agent gains specialized expertise the moment you need it.
For Dynatrace customers already working in Kiro, it’s the shortest path yet from code to production insight. For developers new to Dynatrace, it’s a one-click way to ground Kiro’s reasoning in real facts from your environment, not guesses.
Why this matters for developers
Developers have historically been one step removed from production. When something breaks after deployment, the path to figuring out what went wrong usually runs through a Site Reliability Engineering (SRE) or operations team, and AI coding assistants can’t automatically and reliably remediate issues in software they’re unfamiliar with. Agents that can write code are guessing about how their code behaves in production unless they have access to real telemetry data.
The Dynatrace Kiro power for Dynatrace closes this gap through Dynatrace Intelligence, the agentic operations system at the core of the Dynatrace platform. Kiro’s answers are grounded in deterministic, causal AI and real-time production data, not probabilistic guesses.
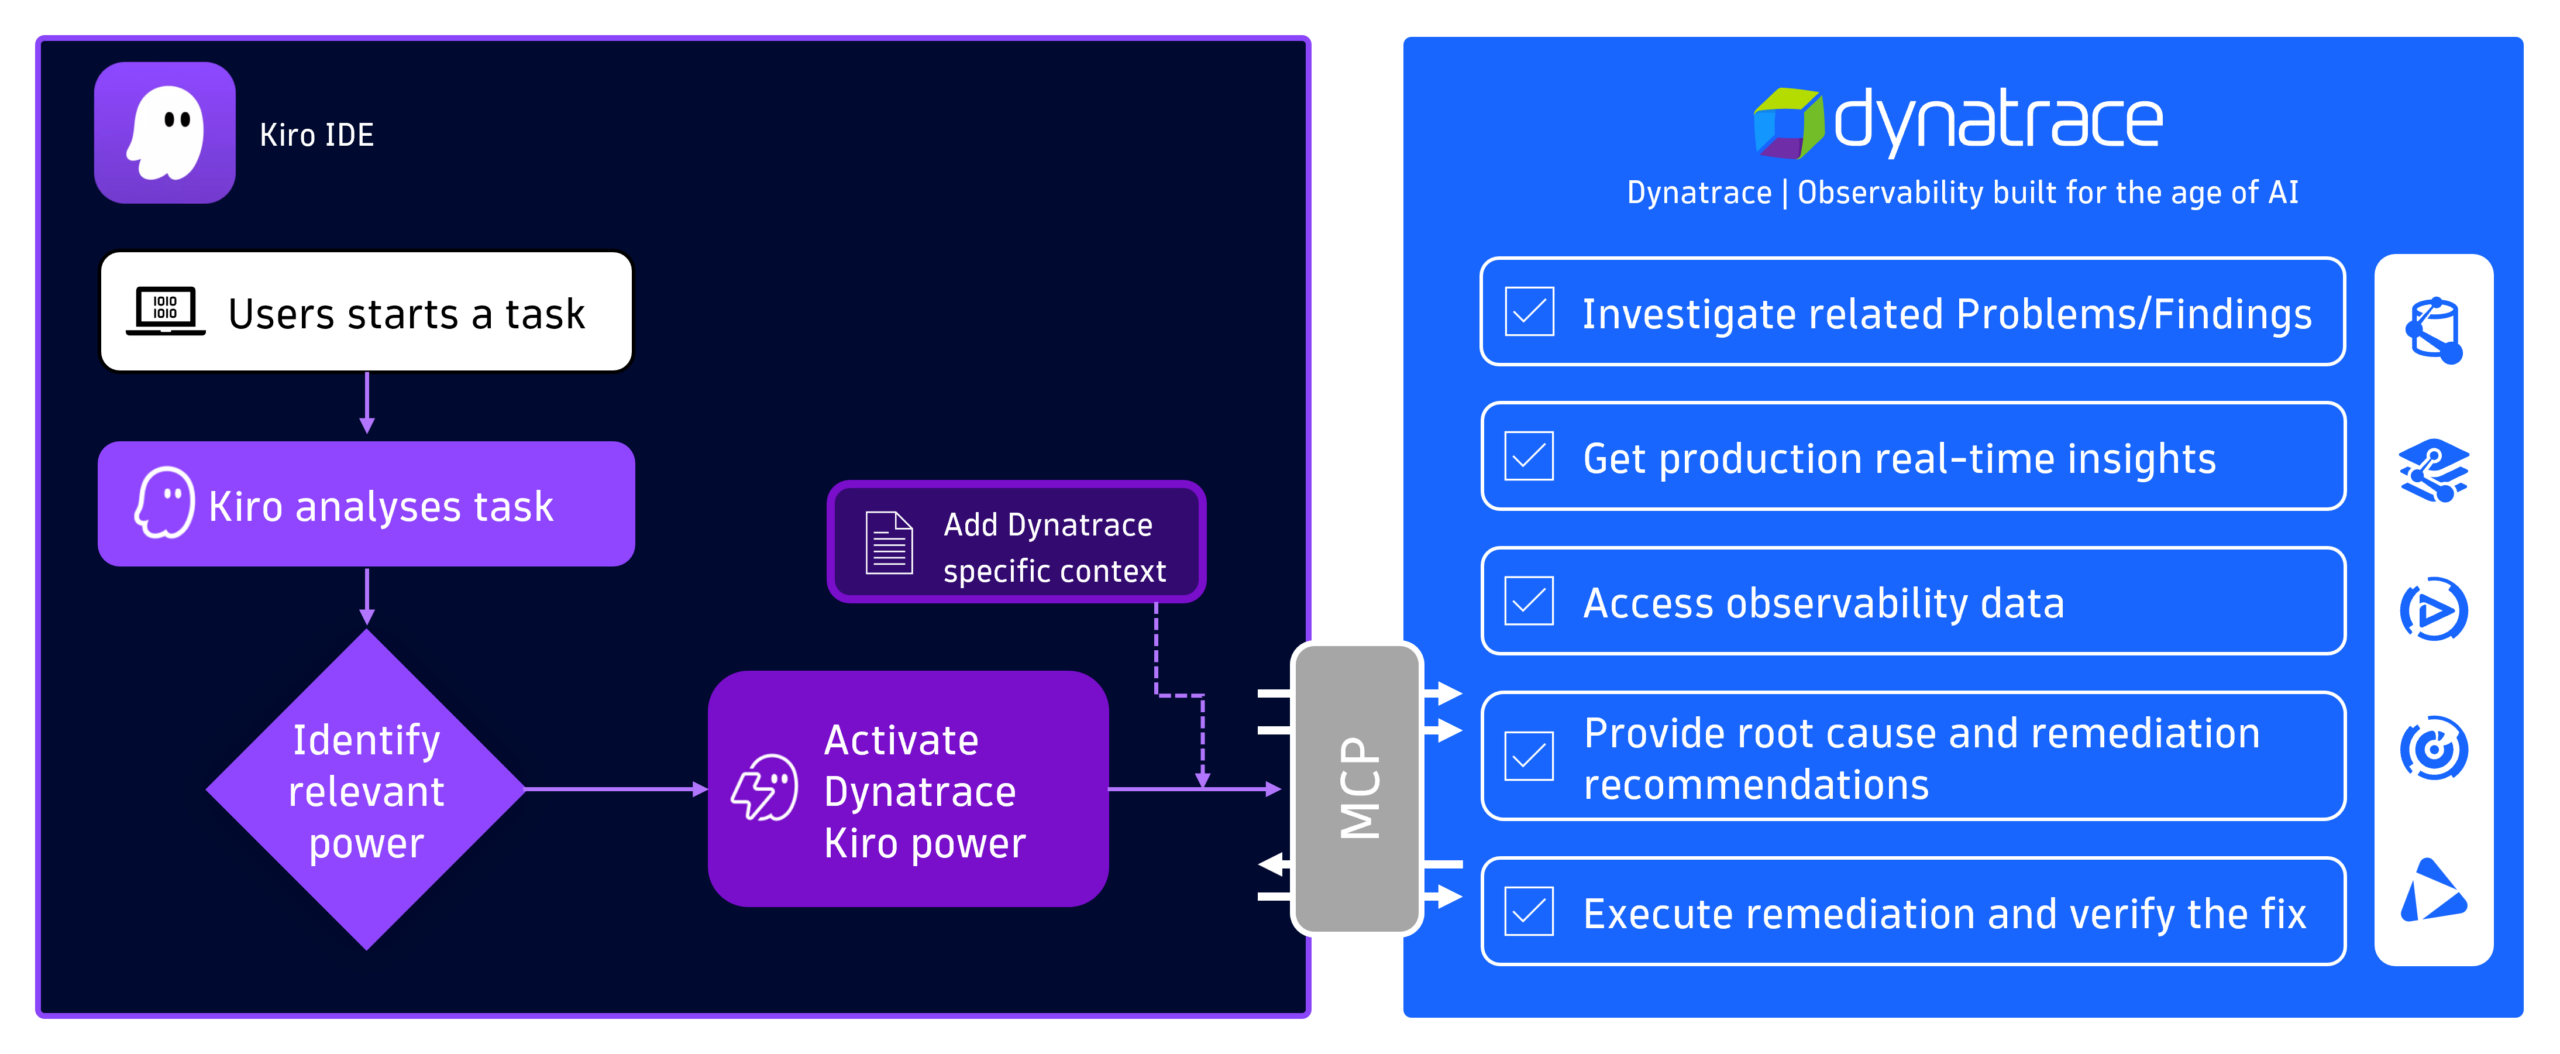
With the tools provided by the Kiro power, developers can:
- Investigate live incidents and get root cause analysis directly in Kiro chat
- Query metrics, logs, and traces from production using natural language
- Surface security vulnerabilities affecting the code they’re working on
- Get remediation suggestions grounded in what’s actually happening in their environment
“Using Kiro powers for Dynatrace has been a total game-changer in the observability space. Deep-dive root cause analysis of complex system issues that once required lengthy manual intervention now happens in seconds, giving us unprecedented speed and confidence.”
Mike Kobush, Sr. Software Performance Engineer, NAIC
How to install the Kiro power for Dynatrace
Getting started takes only a few steps. Once installed, the Kiro power activates automatically when Kiro detects a relevant task. Mention an incident, a slow service, or anything that needs production context, and the Dynatrace tools and guidance will load in Kiro chat.
Prerequisites
- A Dynatrace account. If you don’t already have one, you can start a free 15-day trial.
- Kiro installed on your system.
Prepare the Dynatrace connection
First, create a Dynatrace Platform Token, which Kiro will use to authenticate. Then add the required permissions for the Dynatrace MCP server.
Install the Kiro power
The power can be installed from either the Kiro IDE or the Kiro powers website. For this walkthrough, we’ll use the IDE.
- Launch the Kiro IDE.
- Select the Ghosty icon with the lightning bolt to open the powers panel.
- Select Dynatrace Observability from the Recommended
- Select Install. The power is registered with placeholder values for the Dynatrace URL and token. Therefore, Kiro will show an error message that the MCP server can’t be reached.
- To complete the configuration, select Open Settings and replace the placeholders with your environment details.
Configure your tenant and token
In the settings file, replace the two placeholders:
| Placeholder | Replace with |
| YOUR_DT_URL | https://TENANT_ID.apps.dynatrace.com/platform-reserved/mcp-gateway/v0.1/servers/dynatrace-mcp/mcp. Replace TENANT_ID with your Dynatrace environment ID (visible in your environment URL, for example https://<ENVIRONMENT_ID>.apps.dynatrace.com/ui). |
| YOUR_BEARER_TOKEN | The Dynatrace platform token you created earlier (for example, dt0s16.XXXXX). |
Start asking questions
Open a new chat in Kiro and start interacting with your Dynatrace environment using natural language. Query active problems or security vulnerabilities, request a root cause analysis to identify critical issues in production, or pull related logs and traces, all without leaving the IDE.
See it in action
The short demo below walks through installing the Kiro power for Dynatrace, verifying the connection, and running a first query against your environment to list the top 10 vulnerabilities detected by Dynatrace.

Get started with the Kiro power for Dynatrace
Kiro powers transform what used to be a stitching exercise (MCP servers here, steering files there, custom instructions somewhere else) into one single, ready-to-use bundle. The Kiro power for Dynatrace applies the same idea to observability: live production insight, causal root cause analysis, and remediation grounded in real telemetry, all available the moment a developer needs them.
The result is a tighter loop between writing code and understanding how it behaves in production. Less waiting for diagnostic data from someone else. Less guesswork from an AI assistant operating without context. And, more time spent on the work that actually matters.
Ready to try it? The Kiro Power for Dynatrace is publicly available: install it from kiro.dev or the Kiro IDE and start asking your environment questions.


Looking for answers?
Start a new discussion or ask for help in our Q&A forum.
Go to forum