
Mobile teams have spent years stitching together crash logs, SDK outputs, and guesswork to understand why their apps freeze, crash, or feel slow. Dynatrace has removed that friction with a mobile troubleshooting experience that unifies performance and stability into streamlined end-to-end workflows. This brings together app insights, view‑level performance, crashes, and application not responding (ANR) errors with full contextual enrichment and adds automatic React Native symbolication through built‑in source‑map management.
With crash intelligence from the new Dynatrace RUM experience, practitioners get a dedicated mobile health view that instantly highlights regressions and stability issues, while two ready‑made dashboards surface performance and troubleshooting insights with zero setup. Where traditional tools stop at isolated crash reporting, Dynatrace connects every error and crash signal—across native, hybrid, and cross‑platform apps. The result is a single, intelligent experience that helps teams ship faster, fix issues sooner, and deliver trustworthy mobile apps.
Why mobile troubleshooting has fallen behind
In the web world, metrics like Core Web Vitals provide a common language for performance. In mobile, no such standard exists, despite mobile apps being far more sensitive to performance regressions than desktop applications. There’s an even bigger challenge: while browser‑based issues can be fixed instantly with a quick deployment, mobile bugs require a full app‑store release and rely on users updating their devices; this makes mobile bugs far more difficult and slower to reverse. It also makes proactive observability even more critical for mobile than for web. Furthermore, today’s mobile apps span hundreds of device types and unpredictable network conditions, and frameworks like React Native or Flutter must function reliably across a range of hardware and operating‑system versions. These layers make traditional “crash-only” analytics insufficient.
While a slow app start can cost you a new user before they’ve even reached your home page, a poorly performing view can stall your conversion funnel. And a frozen view can quietly destroy user trust without leaving any clear trace in your logs. Other monitoring tools often treat these problems in isolation: a crash report here, a view-analytics SDK there, an app-start metric captured in another tool… But teams need unified context, not fragmented data on glass.
A dedicated mobile performance experience
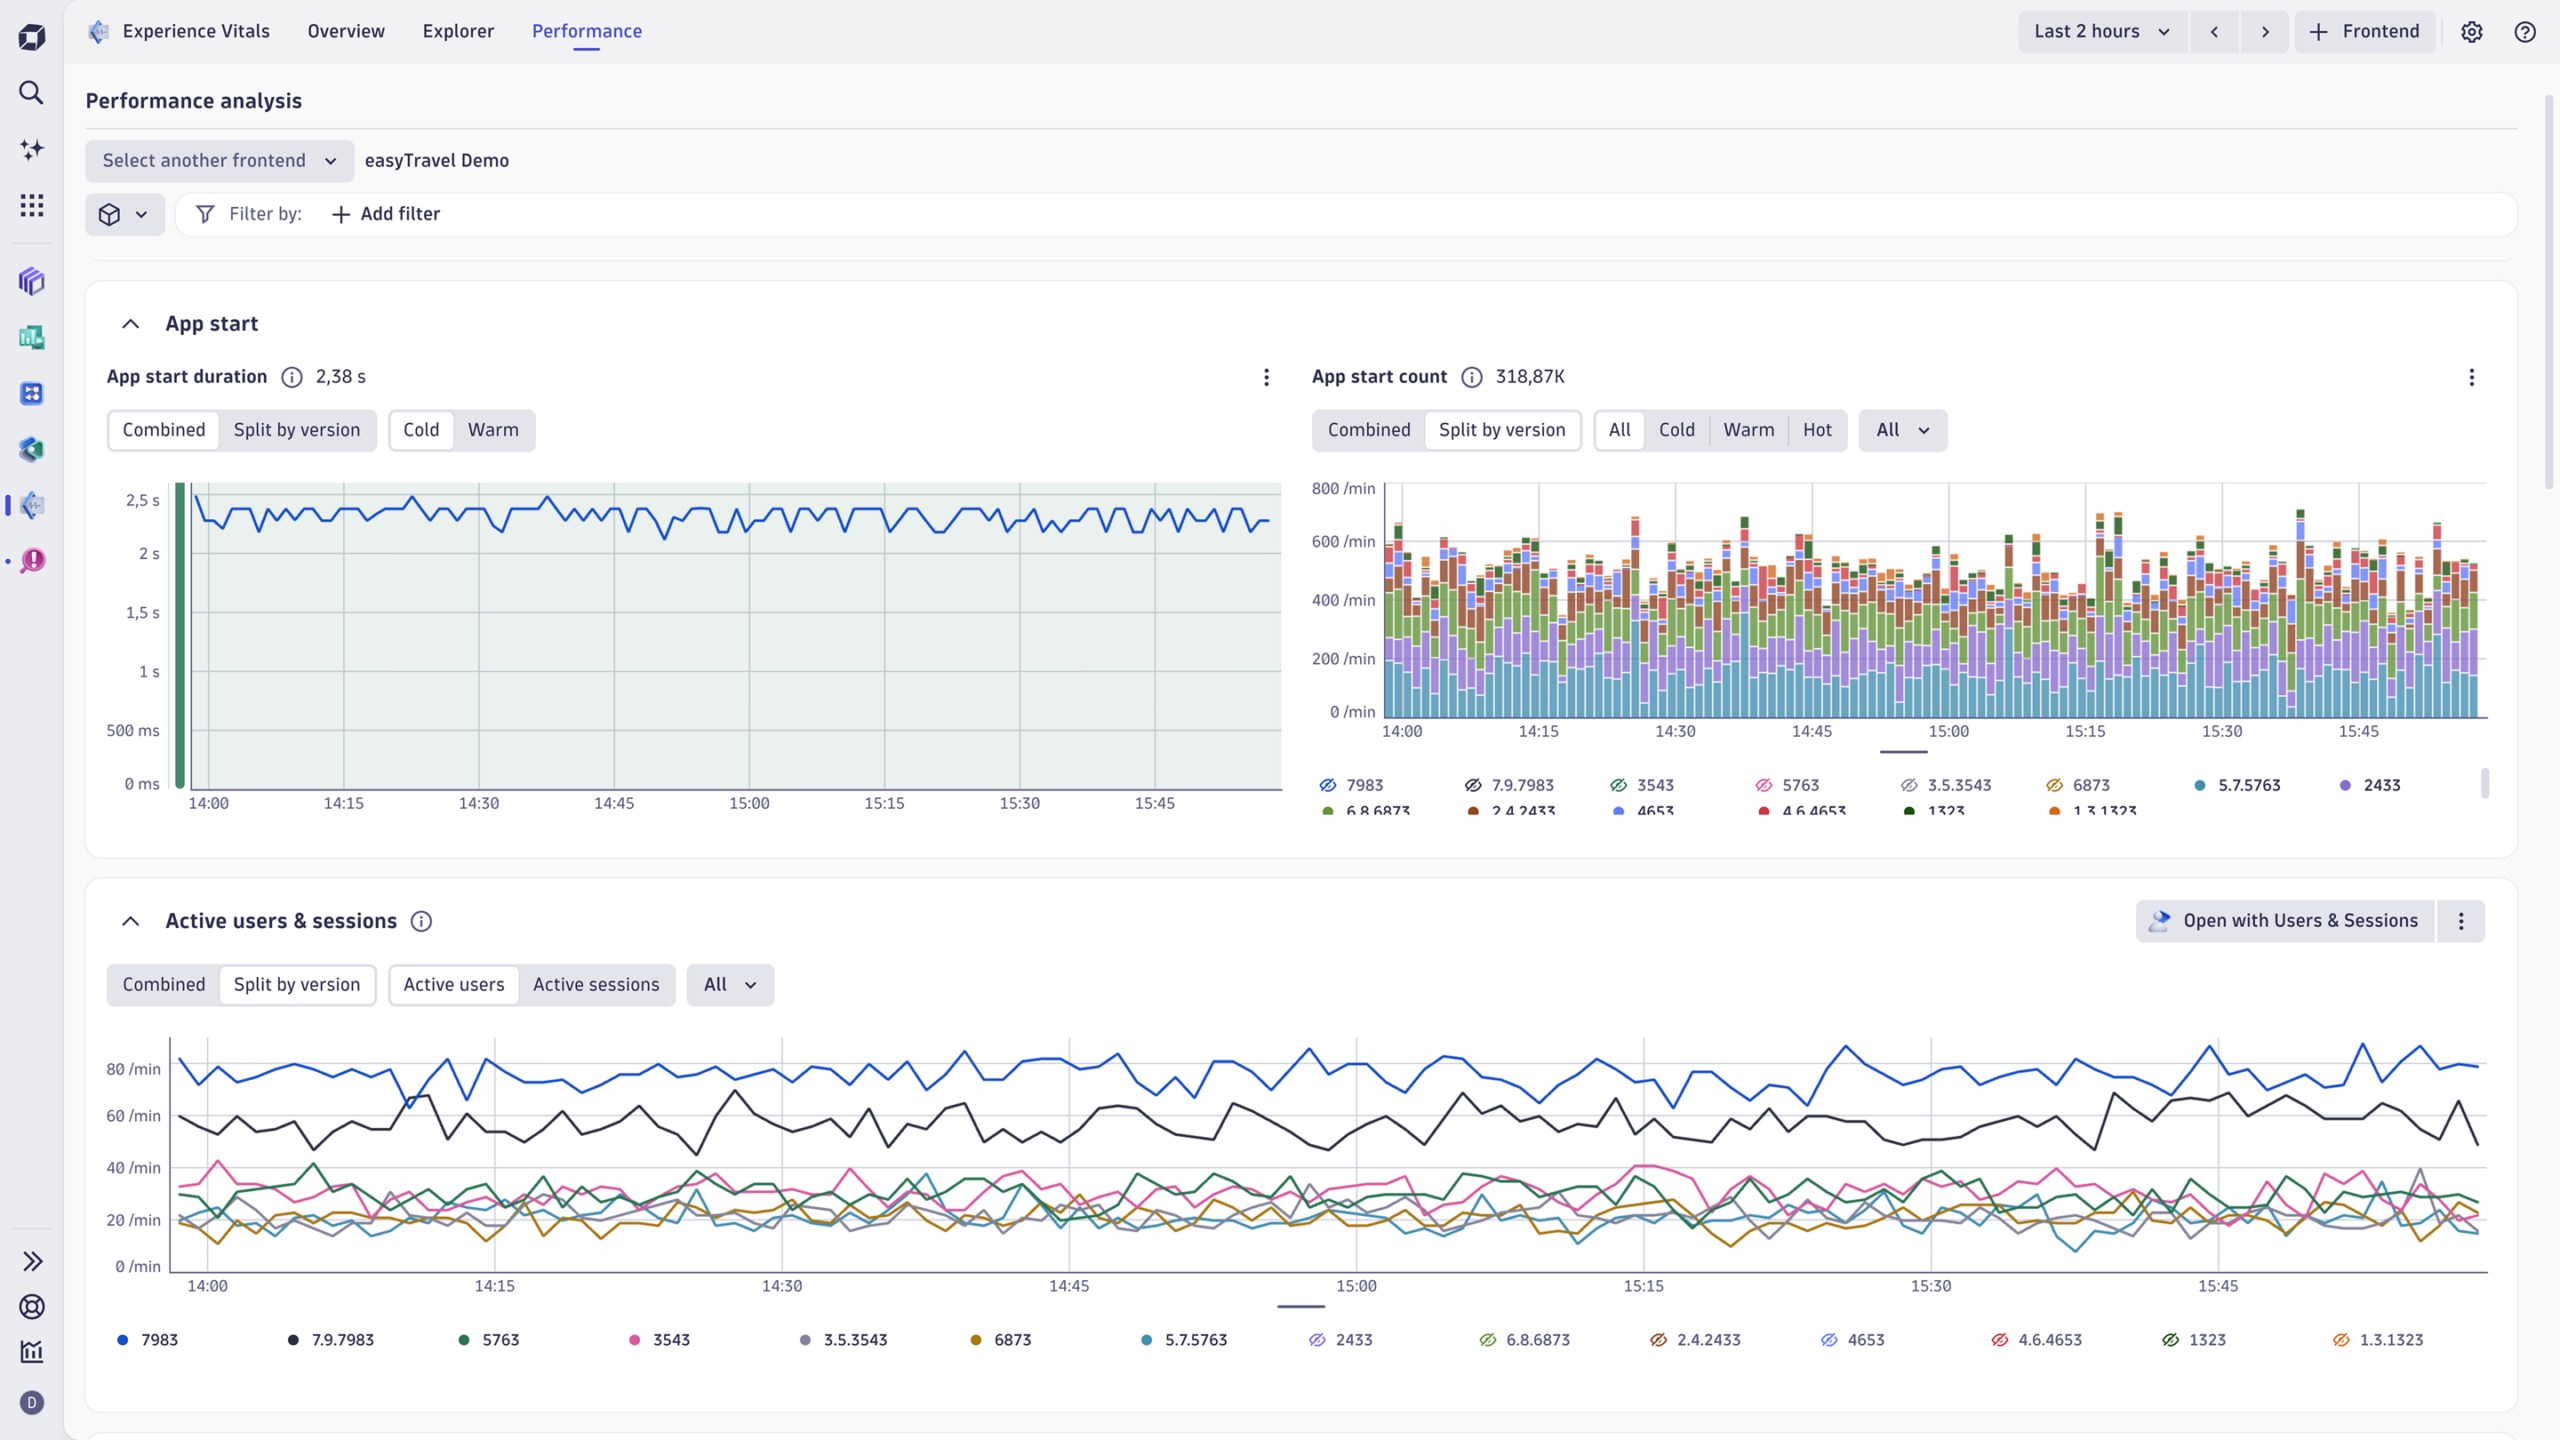
The new Dynatrace RUM experience solves this problem by bringing together performance and stability in a coherent picture rooted in real user journeys, not isolated events. This combined visibility is what sets Dynatrace apart. The foundation of the new RUM experience lies in a new performance analysis capability that reflects how mobile apps actually work. Apps are now represented through mobile “views”—the mobile app pages that users interact with as they move through the RUM experience. Dynatrace automatically detects views for native iOS and Android apps, with manual instrumentation available for frameworks like Flutter and React Native. Performance signals for each view tell a story, including, for developers, where the errors or exceptions occurred.
These metrics are stored as Dynatrace Grail®-native data with all relevant dimensions, enabling rich analysis across devices, OS versions, app versions, and frontends. These metrics are fed directly into Experience Vitals, where App Owners and PMs can drill down from a high-level performance view into detailed metrics for each view. Select any specific view to reveal its performance characteristics, error footprint, and context across the user journey.
App health intelligence on the basis of crashes, ANRs, and error context
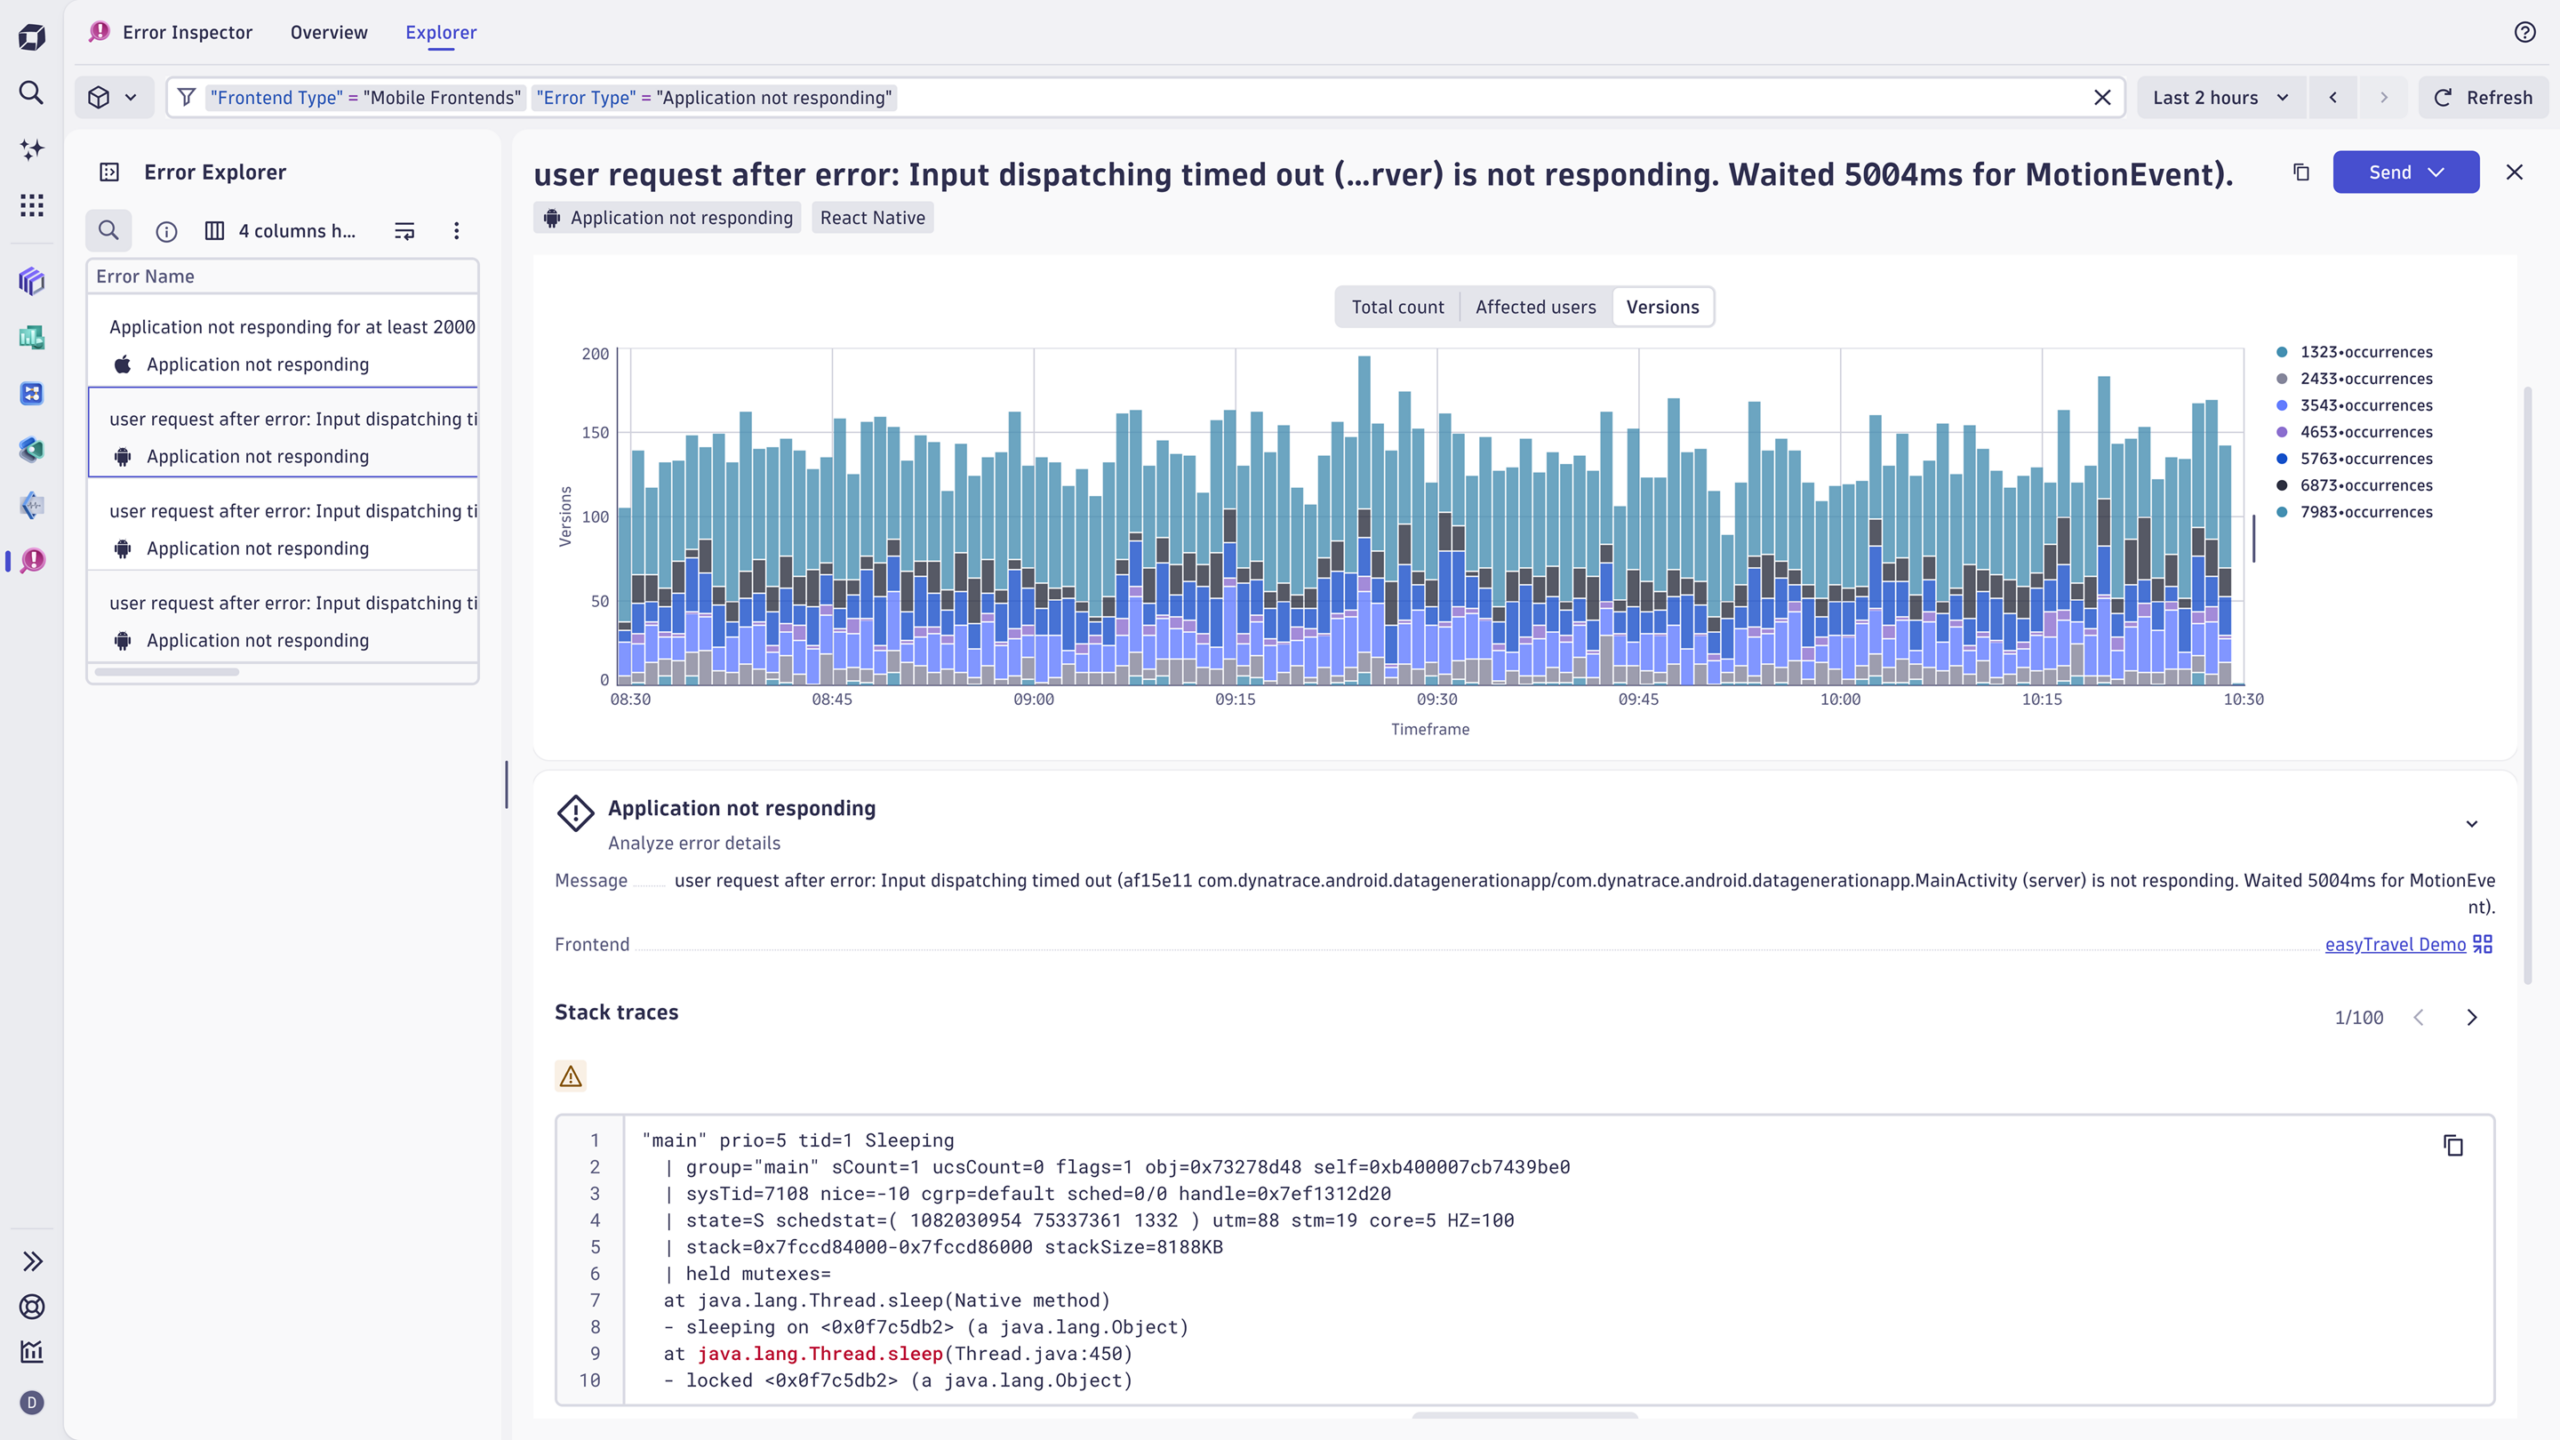
Crashes have always been a pain point for mobile developers, but ANRs are often worse. Many tools treat ANRs as an afterthought, offering incomplete or inconsistent visibility. Error Inspector, the dedicated app for frontend troubleshooting on the Dynatrace platform, now captures ANRs on both iOS and Android, as well as crash reporting for Android NDK. Error Inspector reports errors as structured user events with precisely defined semantics. Previously, Dynatrace practitioners could add properties to automatically monitored telemetry data, turning previously opaque frontend degradations into immediately diagnosable issues. Similarly, in the new RUM experience, user events triggered by mobile apps are automatically enriched with view context, device details, and session information to identify exactly which users, contexts, and conditions triggered a crash, thereby dramatically accelerating root‑cause identification and troubleshooting.
Server-side processing applies efficient grouping logic to provide a clear, deduplicated view of what’s happening, enabling meaningful dashboarding and reliable future alerting. With Dynatrace Experience Vitals, SREs gain insights into app performance and stability. Insights are elevated to the same first-class status as performance, ensuring teams see both sides of the experience.
Crashes and ANRs flow naturally to Error Inspector, where they’re prioritized by severity—crashes have higher severity than errors, and all ANRs are highlighted. For developers, this means less noise and faster diagnosis. For business leaders, it means clarity on what matters most, making prioritization a breeze.
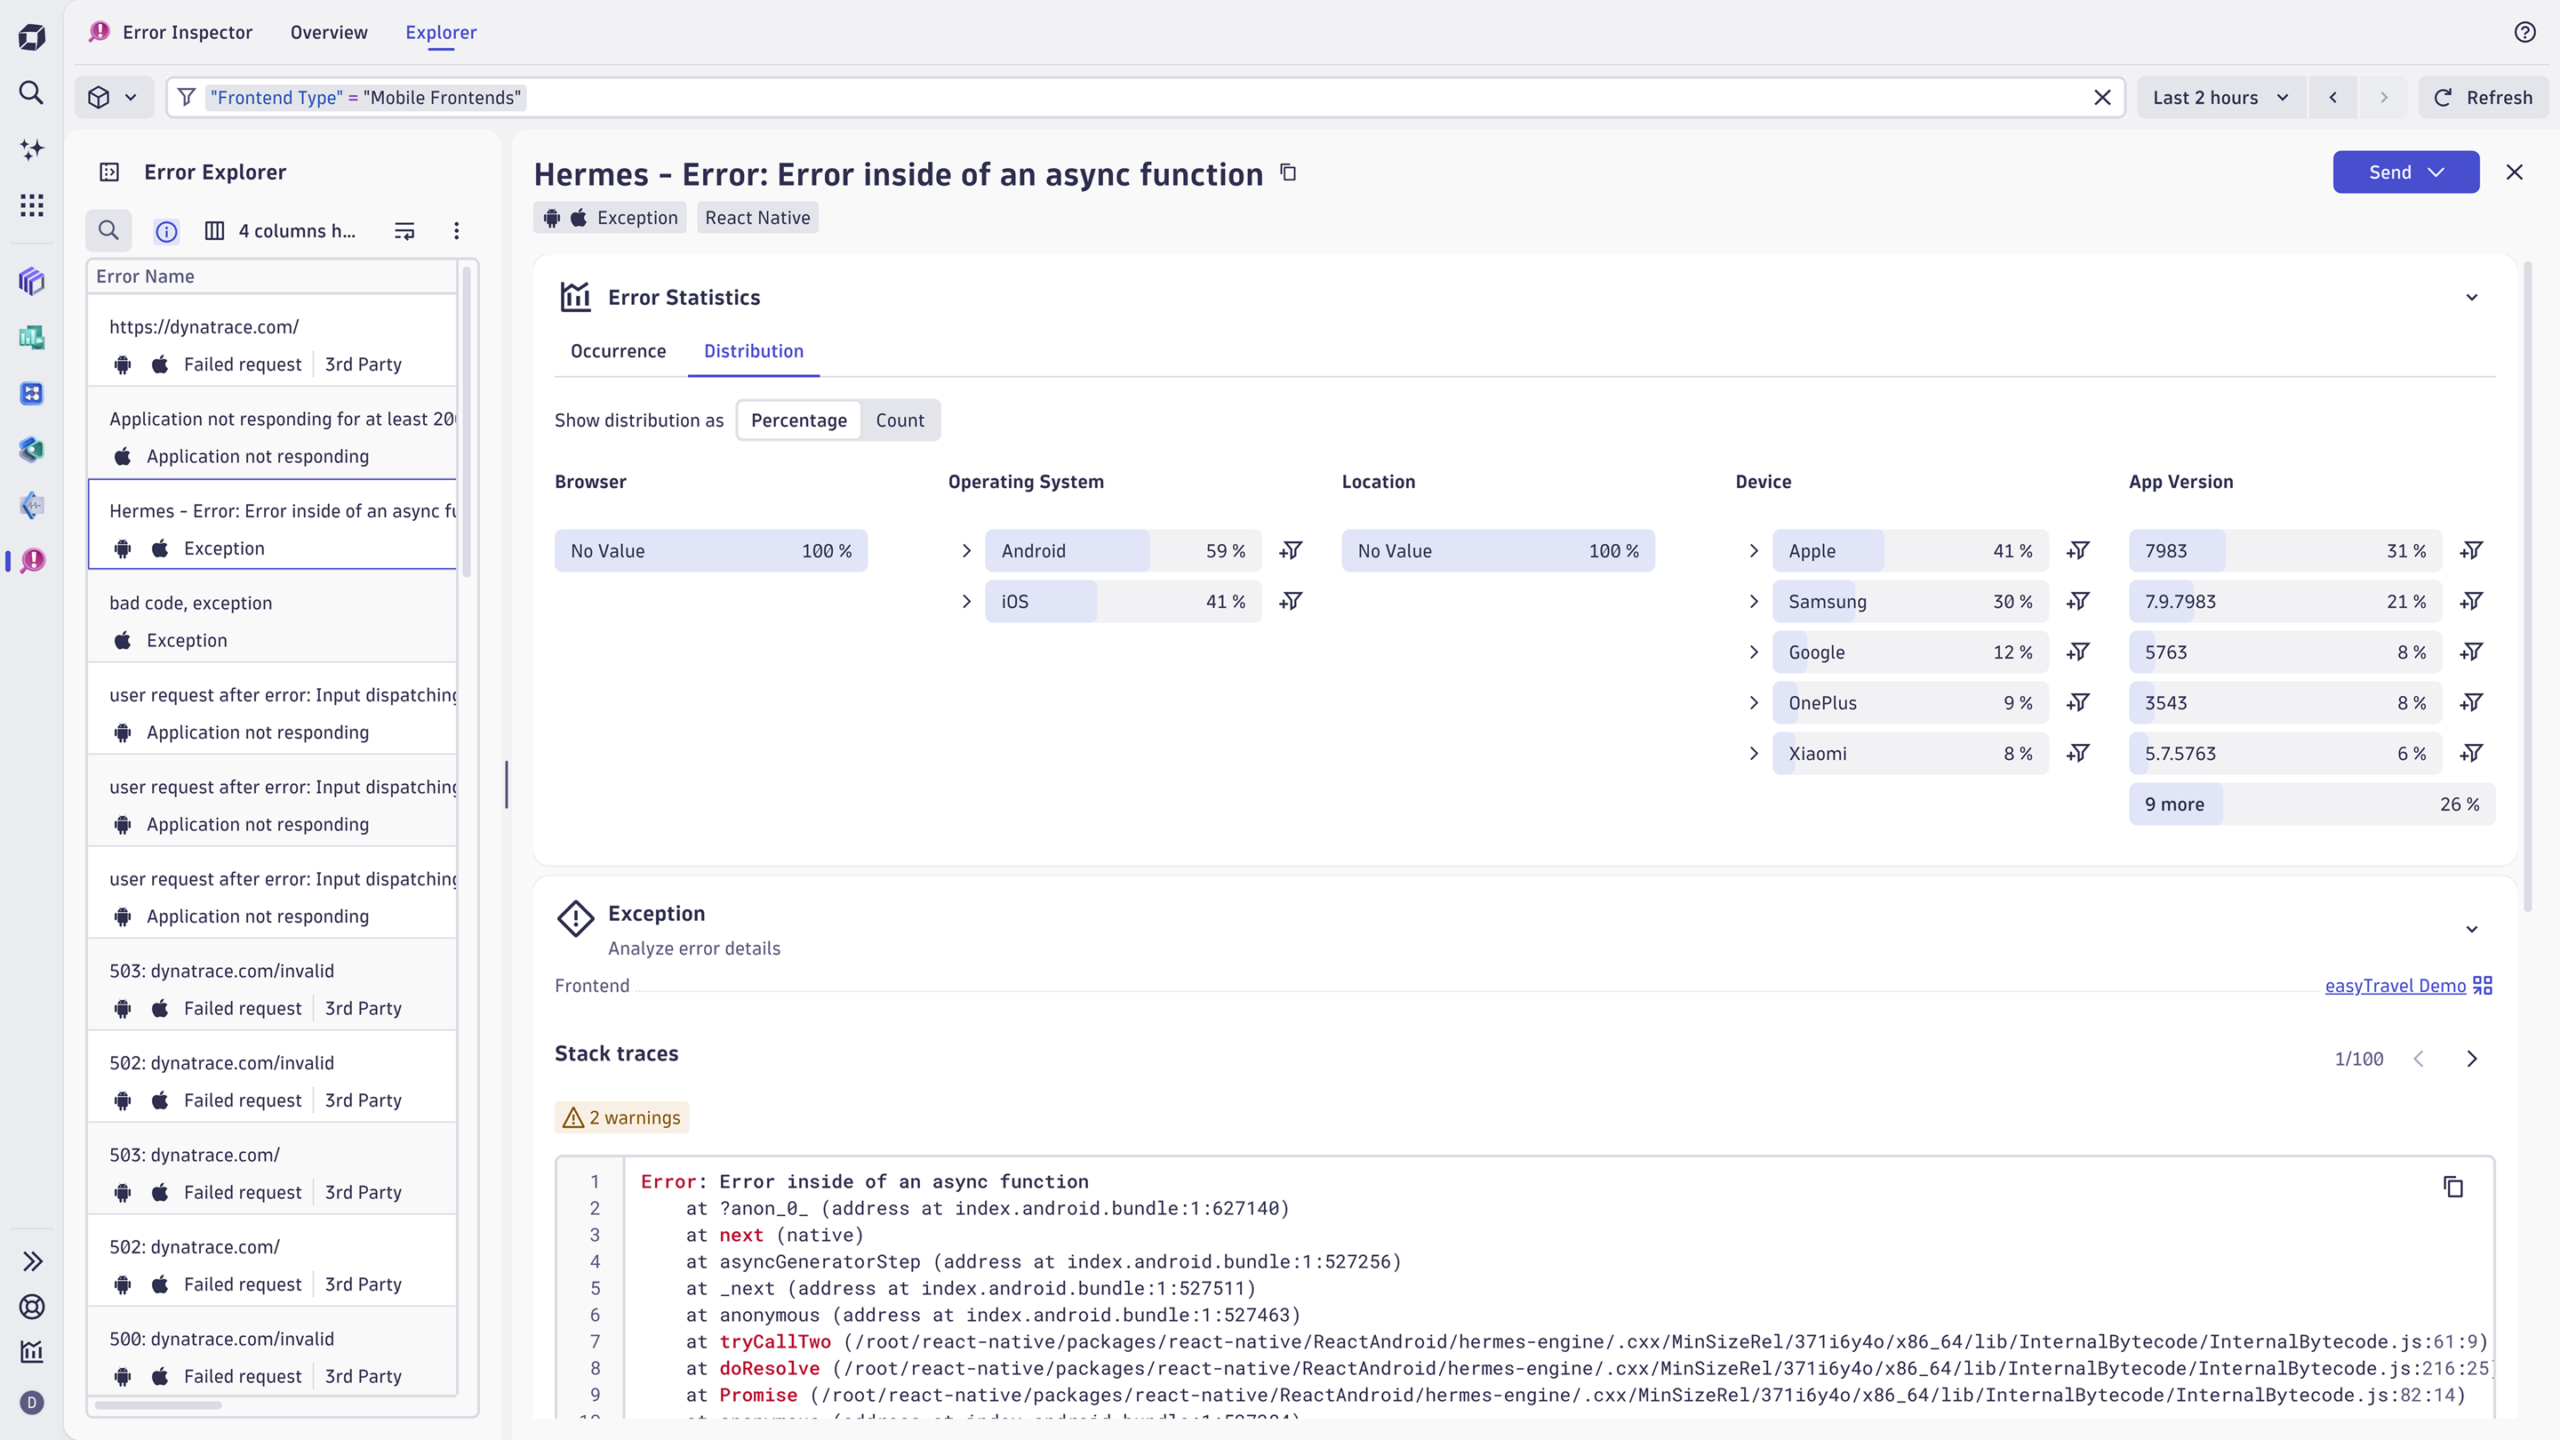
Introducing React Native symbolication
Cross-platform frameworks create powerful opportunities but introduce complexity when things go wrong. Stack traces often combine JavaScript and native code, leaving teams with unhelpful, obfuscated output like hashes. To solve this, Dynatrace now supports full React Native source map uploading and management, with automatic symbolication of React Native crashes directly in Error Inspector.
Teams can upload symbol files through standard methods and manage them via a new interface. Unlike competing tools, which only partially support hybrid stack symbolication/deobfuscation or require manual post-processing, symbolicated crashes appear automatically in Dynatrace, making debugging dramatically more efficient.
For developers working with React Native, this eliminates the friction of switching tools and patching together build artifacts.

A new mobile health overview
Mobile developers often collaborate with their SRE counterparts on observability teams, who frequently face a simple yet critical question from App Owners and PMs: “Is my mobile app healthy right now?”
The answer to this question is provided by Experience Vitals. The mobile health overview shows whether RUM is enabled on your monitored devices, highlights performance indicators such as app start thresholds, and surfaces stability concerns such as crash and ANR rates. Crashes and errors link directly to Error Inspector, creating a smooth transition from error awareness to analysis.
This focus on clarity allows decision makers to grasp app health at a glance while giving developers frictionless access to the underlying data.
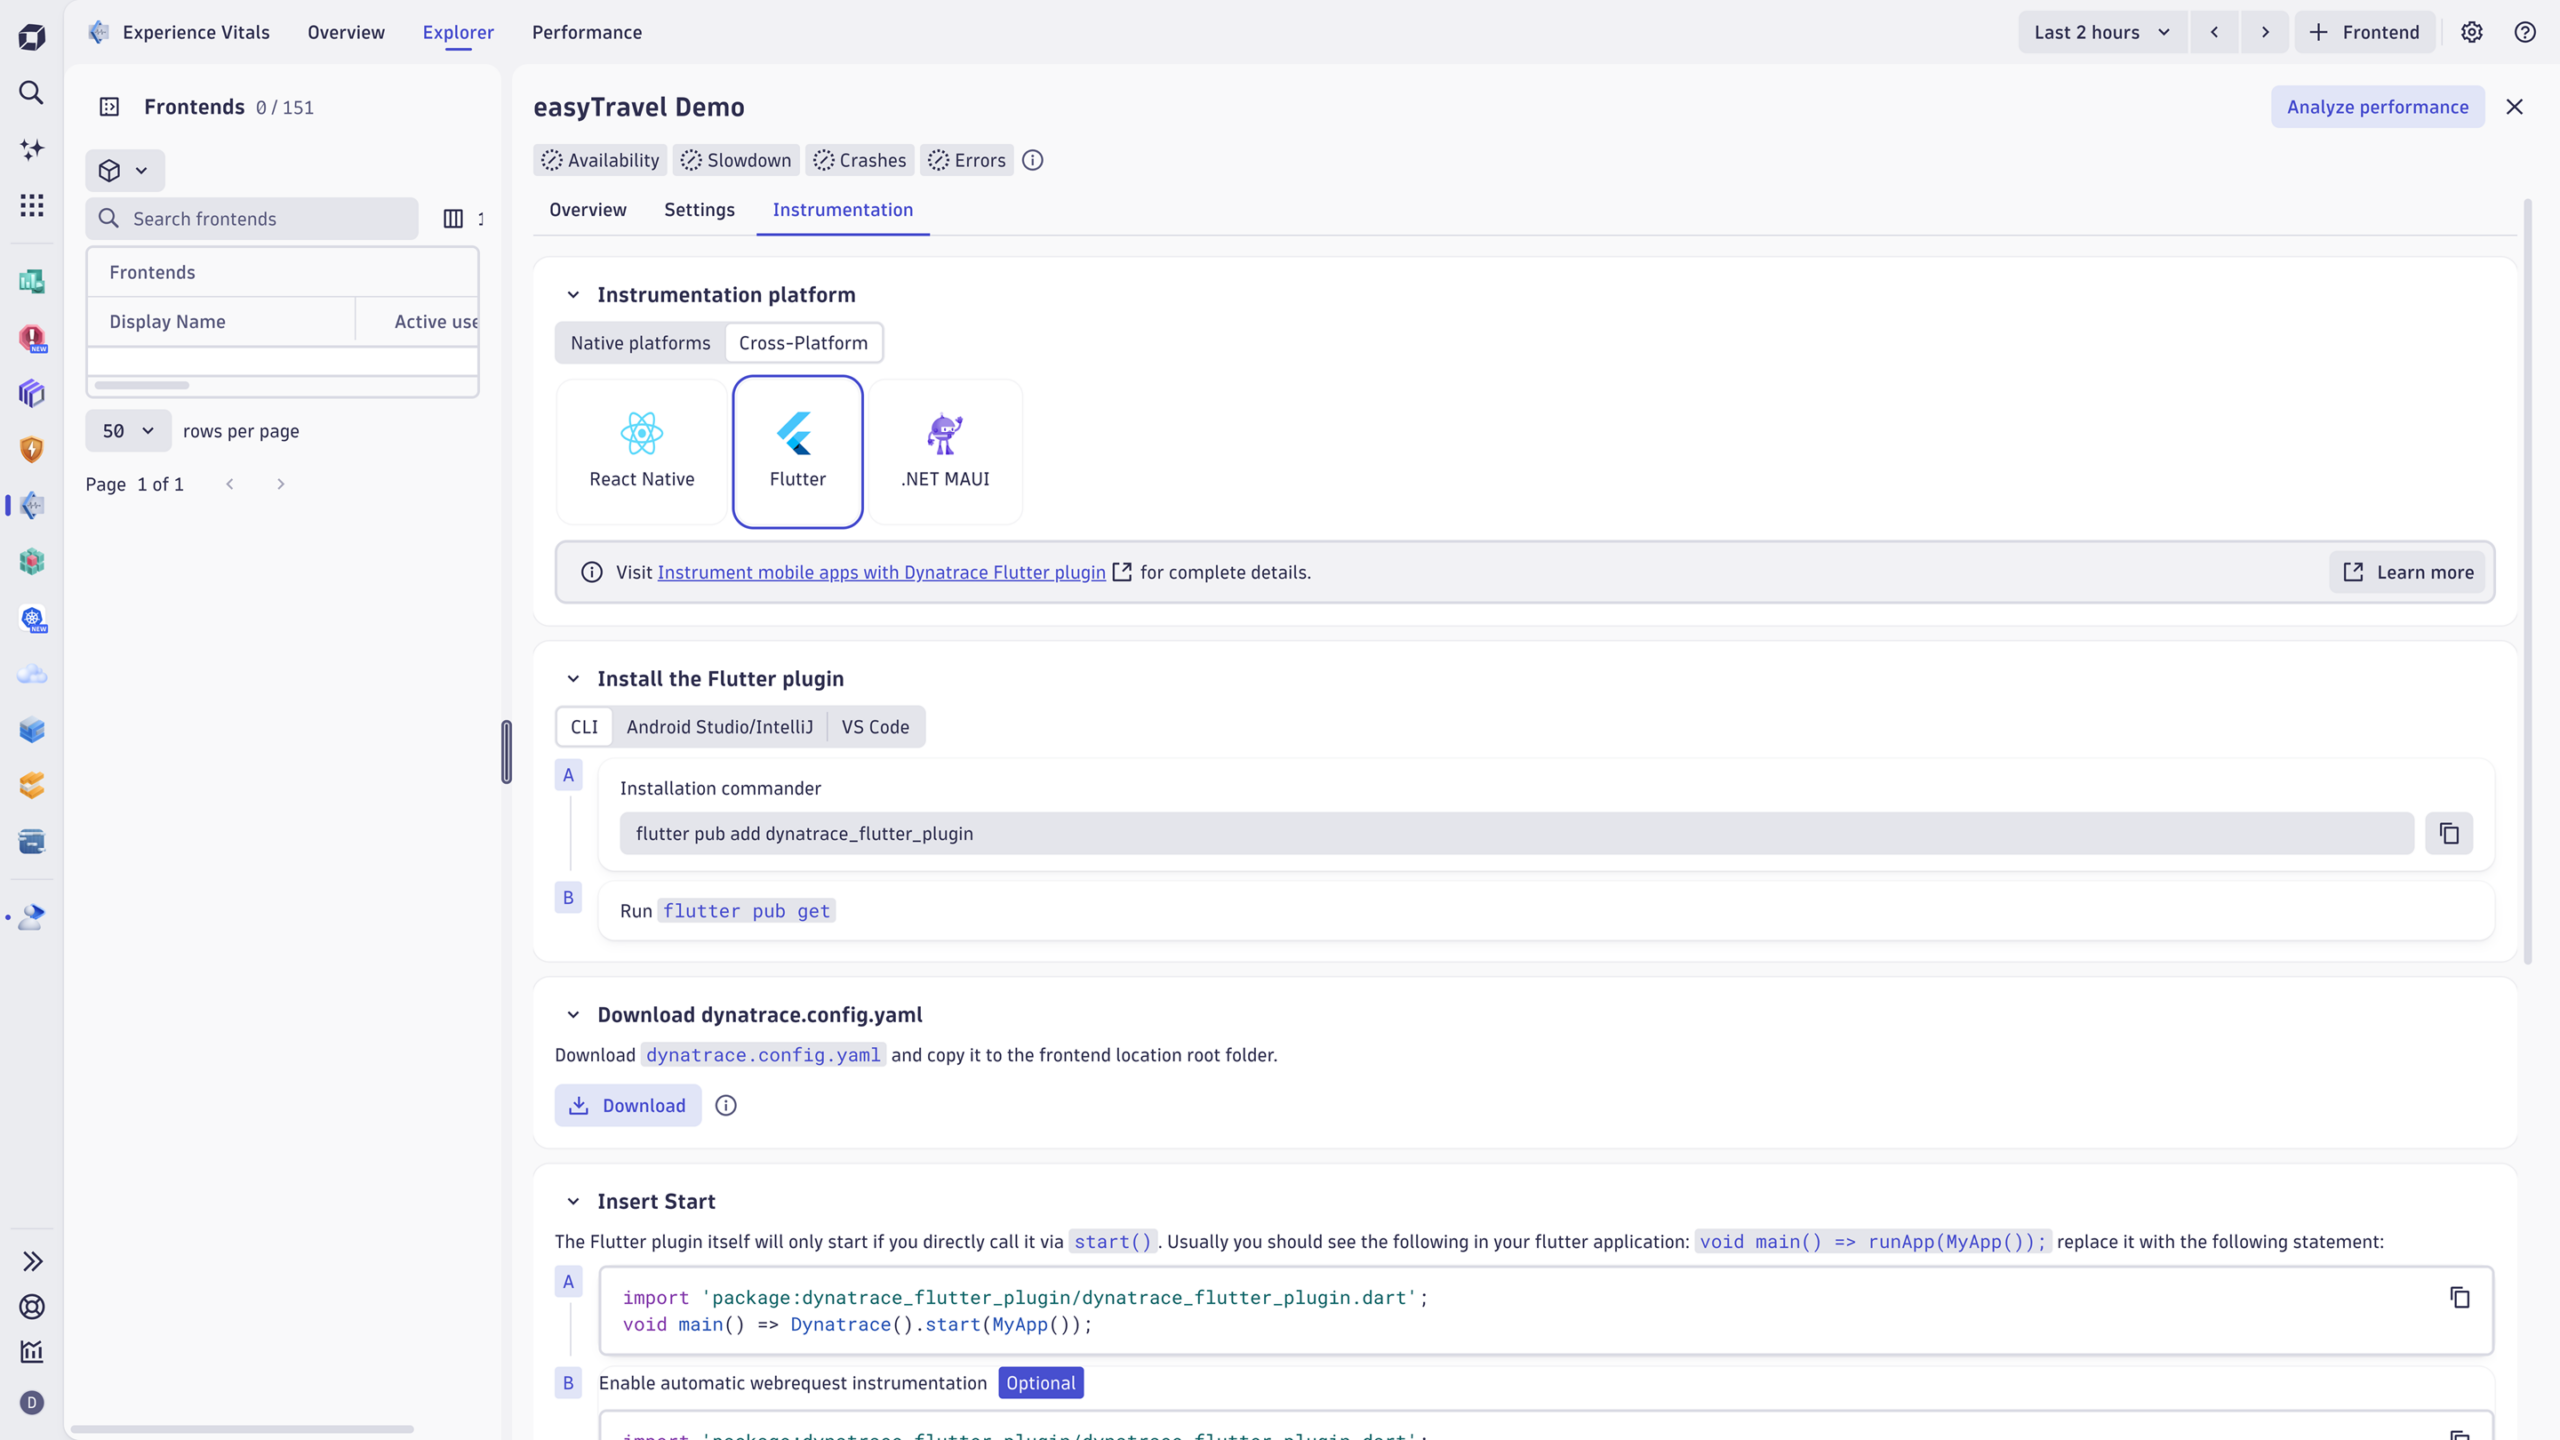
Good insights require the correct setup
To help teams get started faster and avoid misconfiguration, Dynatrace introduces improved instrumentation guides for iOS and Android. These guides add necessary context to ensure new customers receive the exact data they expect. The mobile settings experience has been redesigned to make it clear how UI selections correspond to code snippet changes, aligning it more closely with what teams experience in agentless web flows. This consistency matters, especially for practitioners managing multiple platforms on the enterprise level.
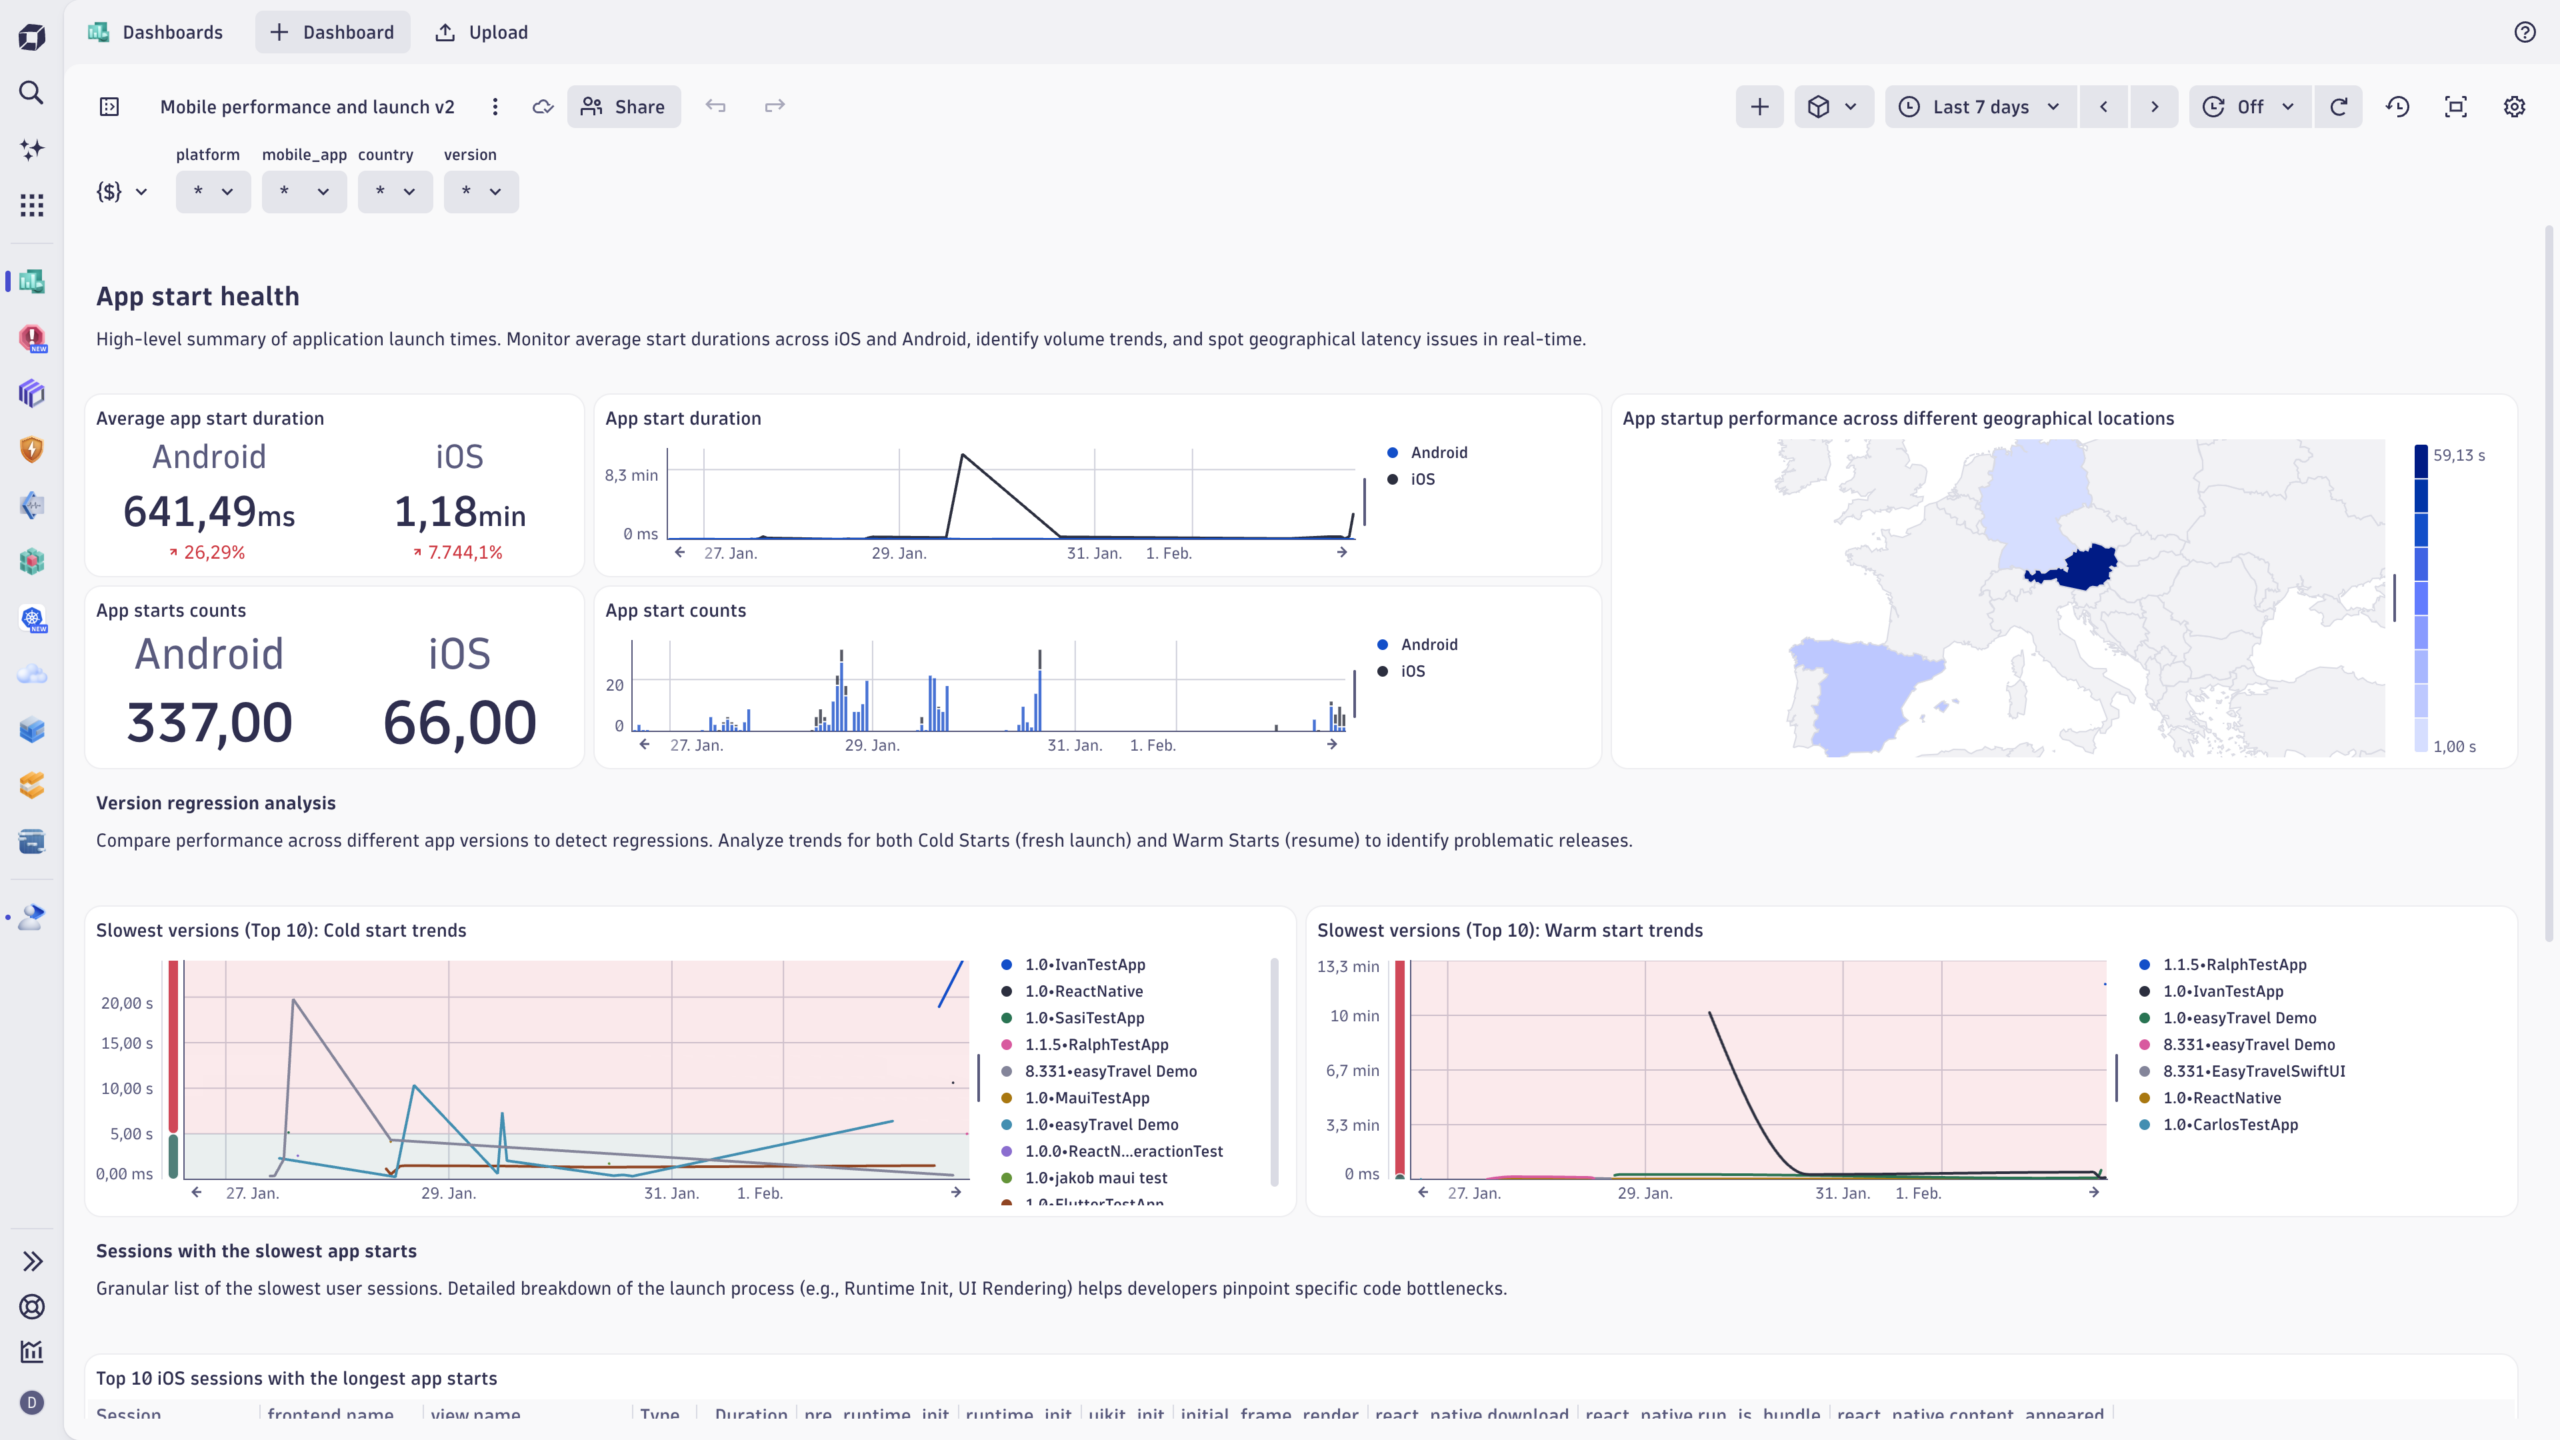
To accelerate adoption and make insights immediately usable, Dynatrace is introducing two ready-made dashboards:
- App start health dashboard, which includes app start analysis and high-level performance trends.
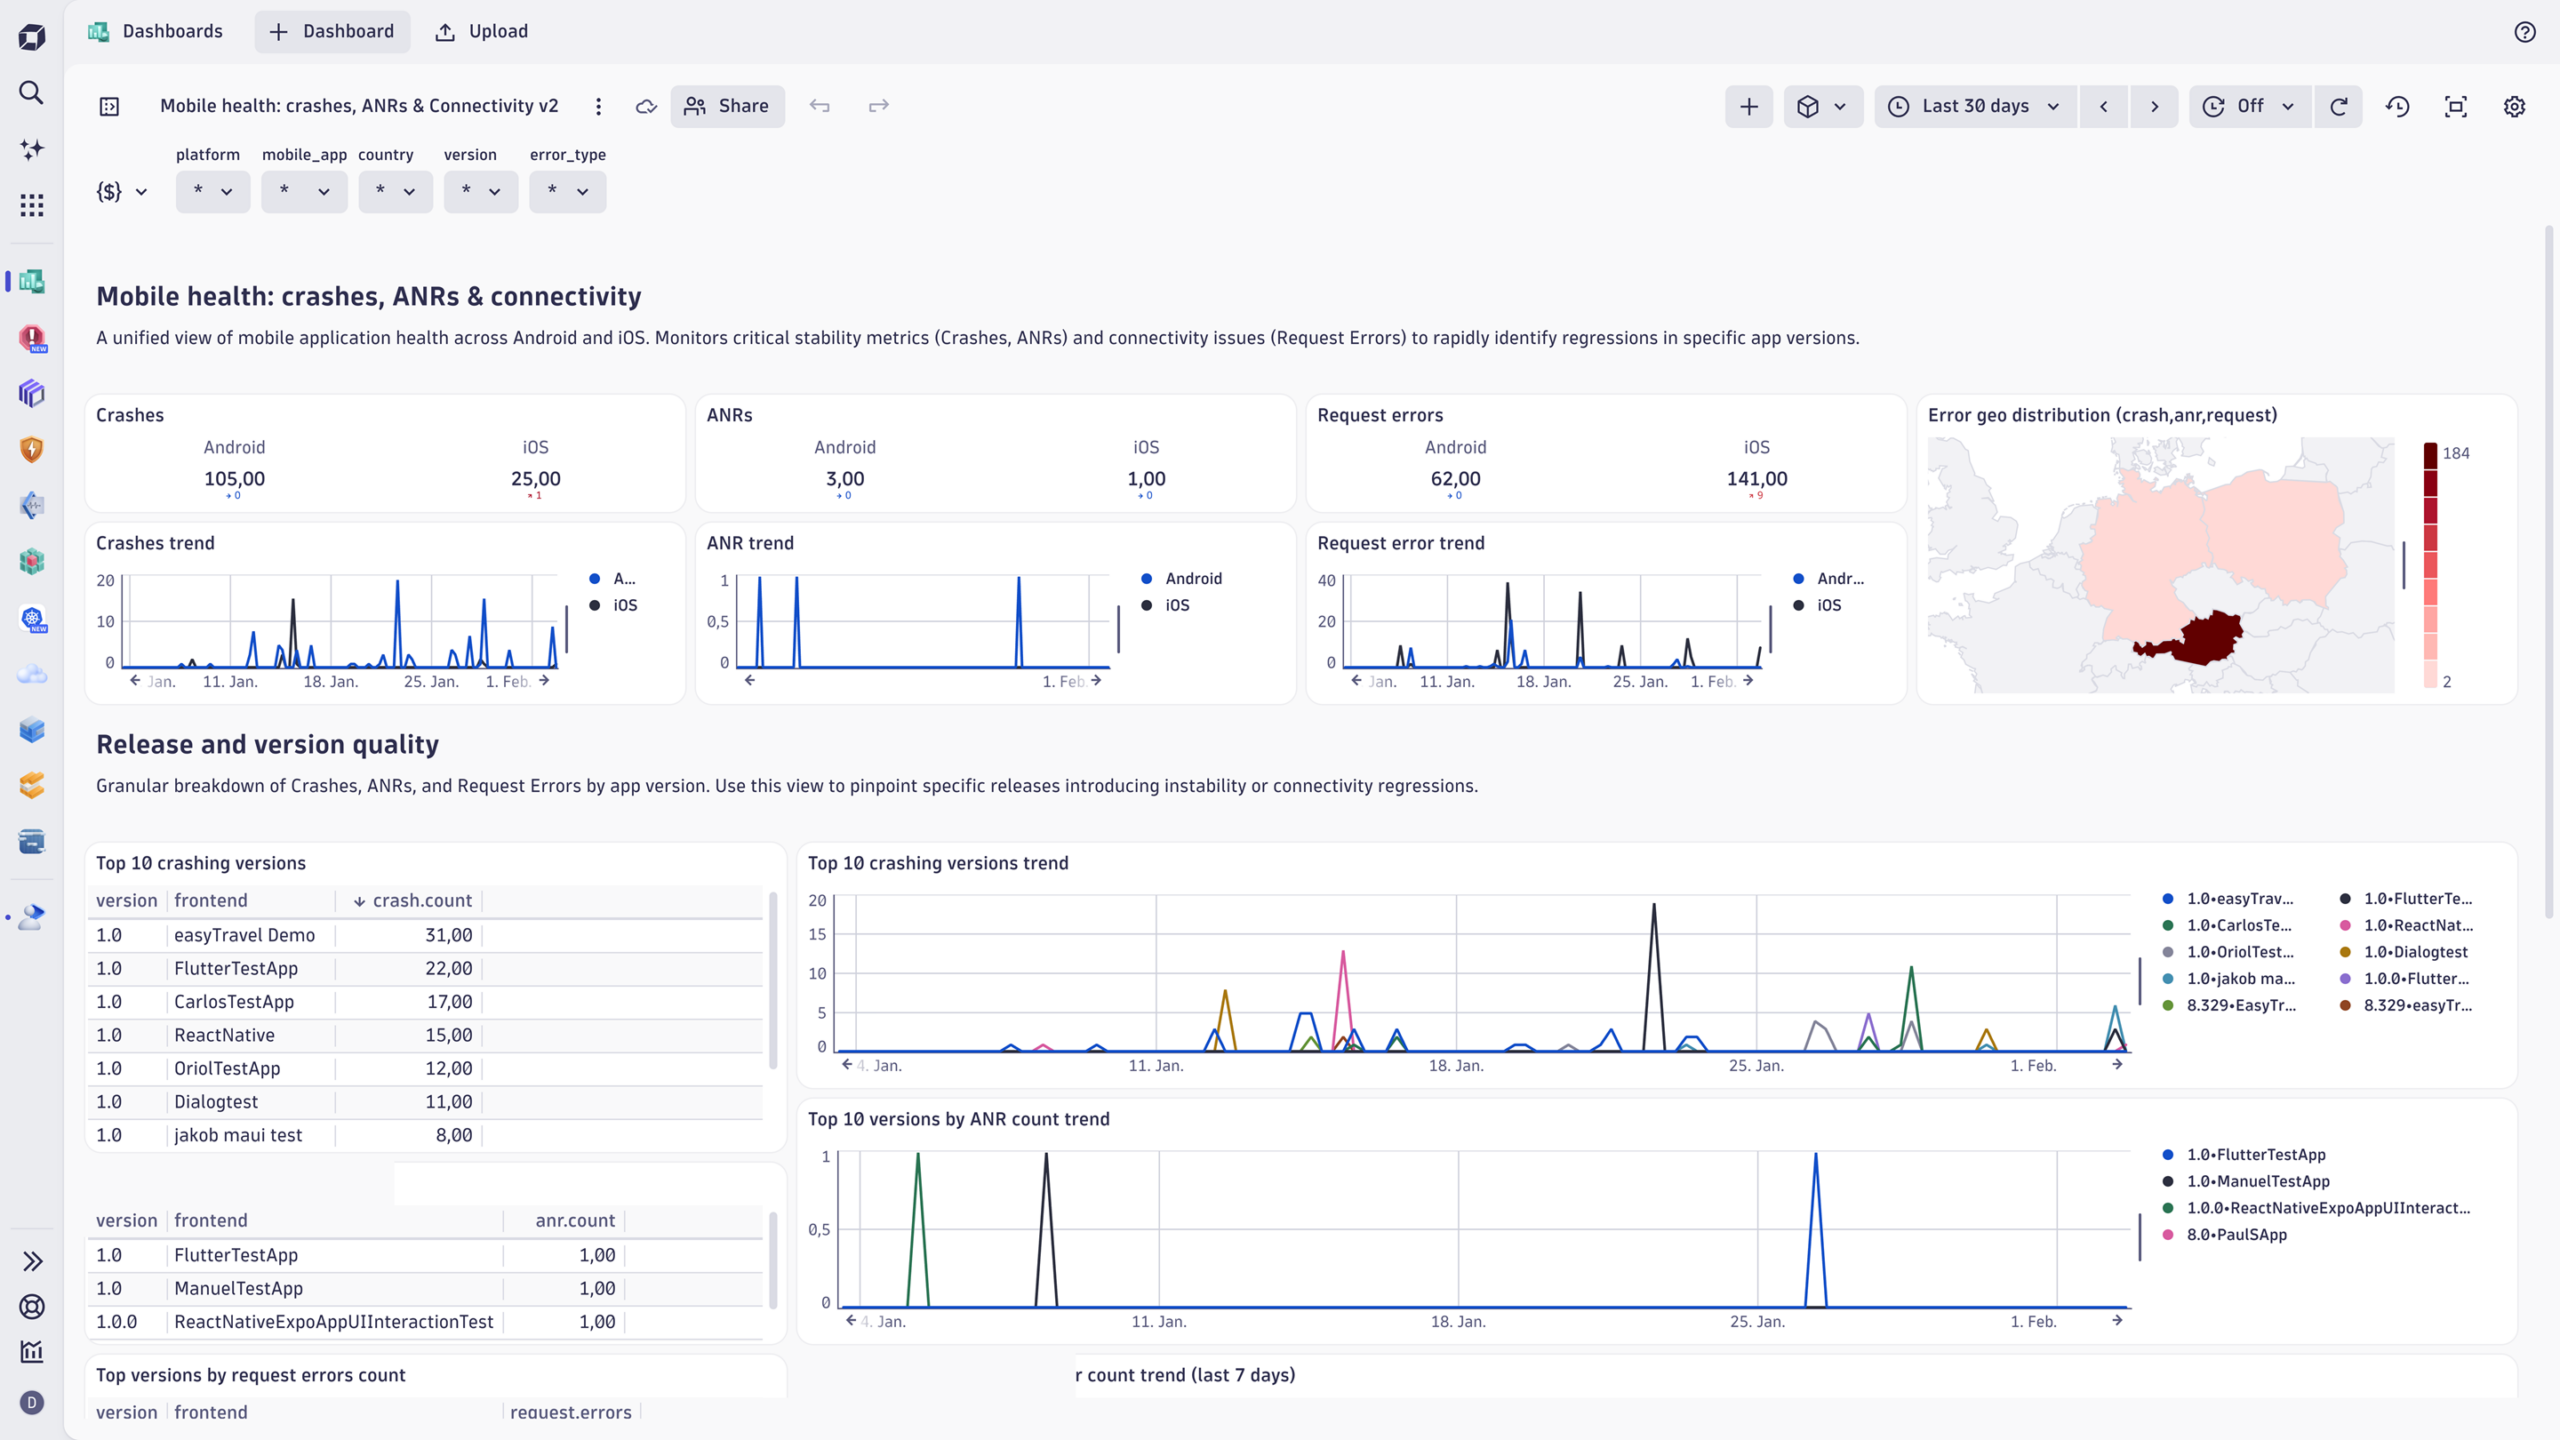
- Mobile health dashboard, designed for investigating crashes and errors, providing stability insights without requiring configuration.
These dashboards incorporate the new metrics, dimensions, and logic introduced across the release, giving teams instant, actionable visibility into their mobile apps. Decision-makers get the reports they need, developers get the views that help them move faster. And everyone benefits from data that’s consistent, contextual, and unified.
Raising the bar for mobile troubleshooting
Most mobile monitoring solutions emphasize either performance or stability, but rarely both in a unified, contextual way. Many tools require heavy manual instrumentation, fragmented SDKs, or separate troubleshooting workflows for native and cross-platform apps. Crash grouping is inconsistent, ANR support varies widely, symbolication often requires external tools, and virtually no other mobile monitoring solution combines all this with a platform that also ties into backend traces and business impact.

Dynatrace delivers something fundamentally and wonderfully different: a single, Grail-powered, full stack view of mobile performance and stability that blends performance metrics, view insights, app-start intelligence, ANR/crash analytics, and hybrid framework support—all in one place, all contextualized by real user journeys and backend traces. This is not just crash reporting. It’s not just performance monitoring. It’s a complete solution for understanding the mobile experience, from the first view to the last tap.
With these enhancements, Dynatrace sets a new standard for mobile observability. Mobile developers gain a more intuitive debugging experience. Product Managers get clear KPIs. App owners receive actionable health insights. And organizations as a whole gain the ability to deliver reliable, performant, and engaging mobile experiences. In a digital world increasingly shaped by mobile interactions, Dynatrace provides the visibility teams need—and the intelligence mobile troubleshooting has been waiting for.
Get started
To instrument your mobile apps and start collecting the full breadth of performance and stability data, please visit our mobile instrumentation documentation. And, if you want to explore how Dynatrace helps you debug crashes, ANRs, and React Native issues with full context, open Error Inspector to see these new capabilities in action.


Looking for answers?
Start a new discussion or ask for help in our Q&A forum.
Go to forum