
Discover a new era of enterprise-grade observability with OpenTelemetry and Dynatrace. Our latest enhancements unlock powerful possibilities for modern cloud native teams with mass data analysis (MDA) at scale.
The real OpenTelemetry challenge: When OTel meets scale
Standardizing on OpenTelemetry gives teams flexibility and control in modern cloud native architectures. The instrumentation works. The data flows. The collection is solved. However, as organizations scale out OTel, they encounter the analytics gap- and the cost continues to climb without clear returns. Can your observability platform turn millions of spans and log lines into clear, contextual answers without manual correlation or vendor lock‑in?
While having OTel data is exciting, many teams find themselves asking, ‘What’s the actual payoff?’ Engineers may occasionally explore telemetry data, but without intelligent analytics to connect the dots, the data often remains underutilized. Meanwhile, managers struggle to quantify the value of their investment, especially as costs climb with scale. This is the natural challenge of DIY setups, where teams focus on data collection but rarely think critically about turning that data into actionable insights.
Anyone can analyze a single trace; that’s easy. Deriving answers from millions? That’s the hard part. The promise remains unfulfilled. Until now.
Why OpenTelemetry + Dynatrace changes everything for teams
Dynatrace closes this gap. With Dynatrace, all telemetry signals are combined to give you the insights you need:
- Comprehensive failure analysis across large trace sets
- Response-time insights revealing performance patterns at scale, with logs and exceptions in context
- Deep visibility into database and queuing systems
- AI-powered intelligence delivering contextualized insights
- Enterprise operational controls providing cost allocation, secure data handling, and scalable telemetry management
Your OpenTelemetry data transforms into actionable contextualized answers that help you move faster, ship confidently, and get back to building.
Complete enterprise coverage for OpenTelemetry
Dynatrace brings OpenTelemetry for Enterprise to life through specialized analysis designed for practitioners troubleshooting issues in Kubernetes environments, available in our extended Services app. AI-powered intelligence, including anomaly detection, ensures you get answers faster, without losing context.
Failure analysis: from single traces to mass insights
When your booking service fails, you can see the complete story: failed traces, related log entries, specific database statements, exceptions- all automatically correlated in one view. The Failure Analysis also provides a visual investigation of your OTel data.
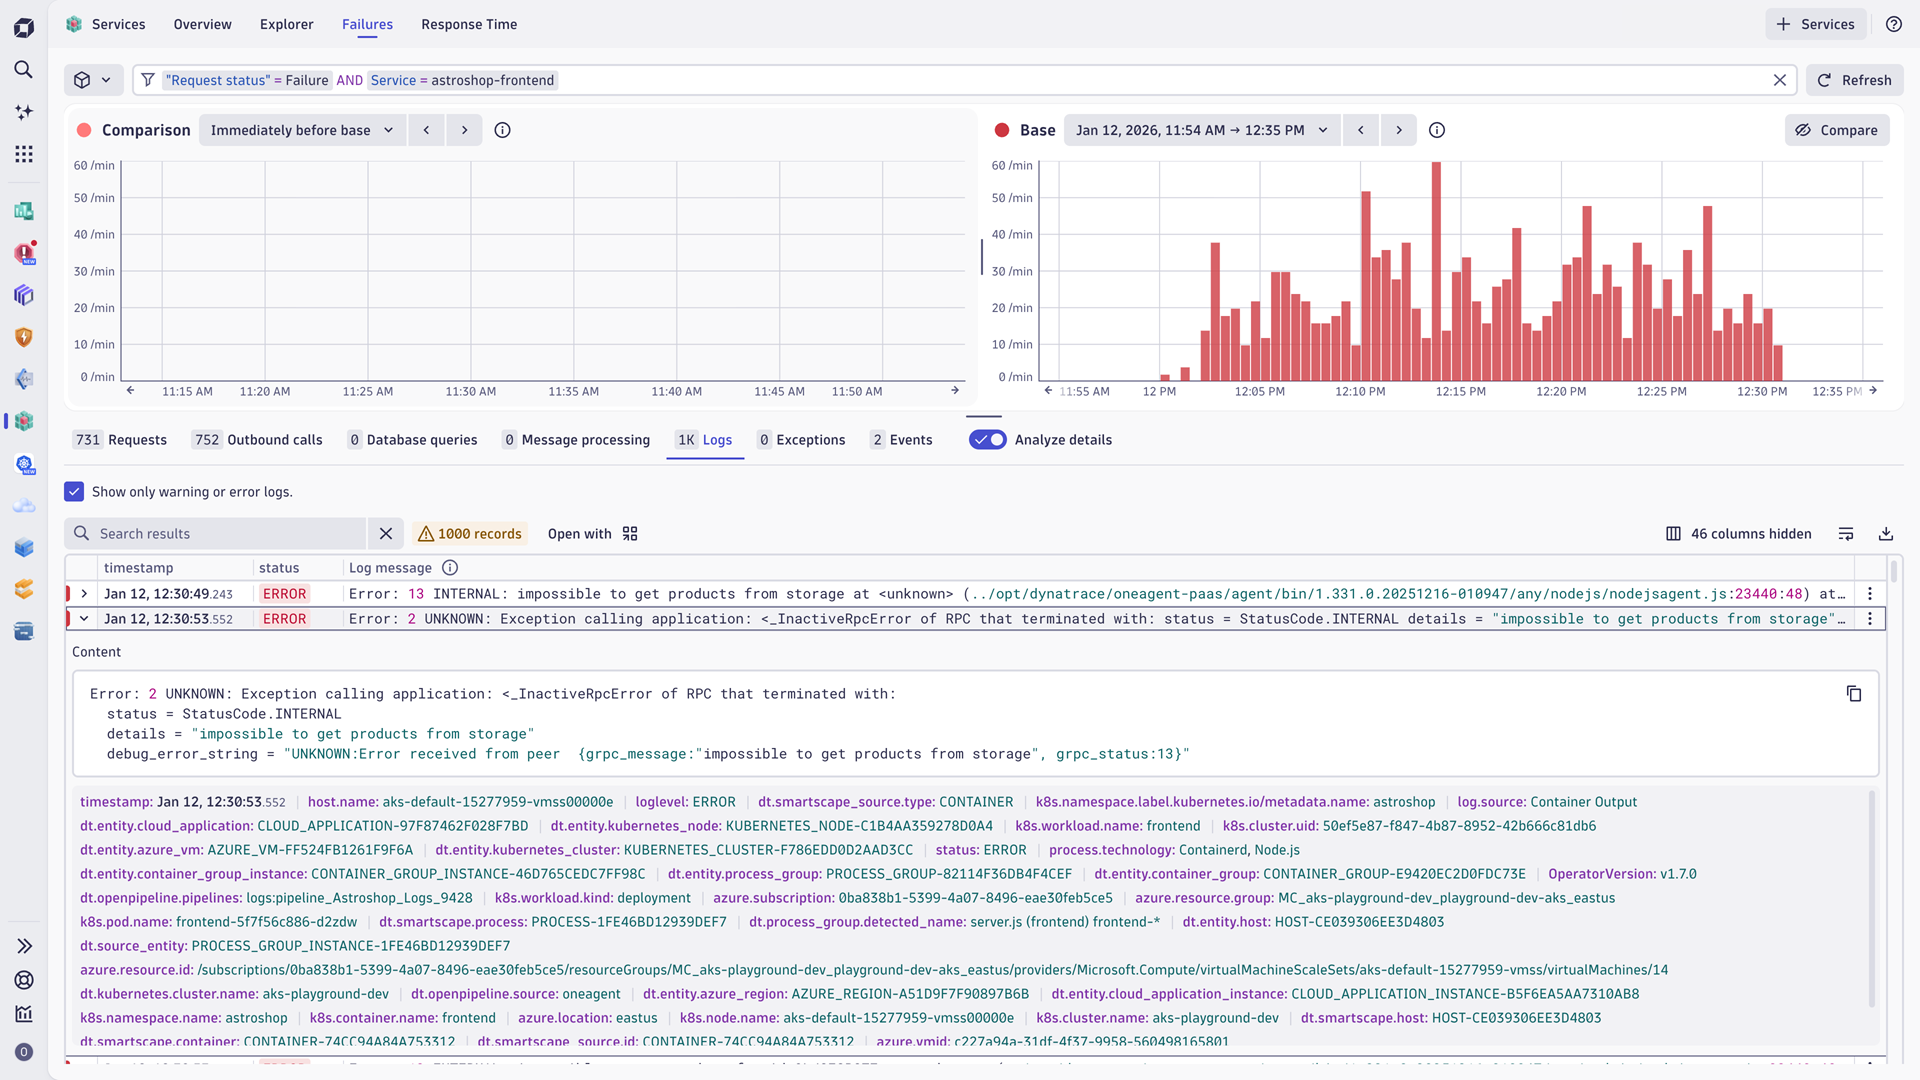
Time-based comparisons allow you to overlay current failures against previous windows, instantly identifying regressions- what was stable yesterday and failing today becomes obvious. And there’s more: advanced visualization distinguishes between different failure types and severities, automatically categorizing them so you can prioritize based on actual user impact.
It’s a new, intuitive way to explore data visually with full context- analyzing failure patterns across your entire architecture and understanding how problems flow through distributed systems. Derive answers from millions of spans that individual trace inspection would never reveal.
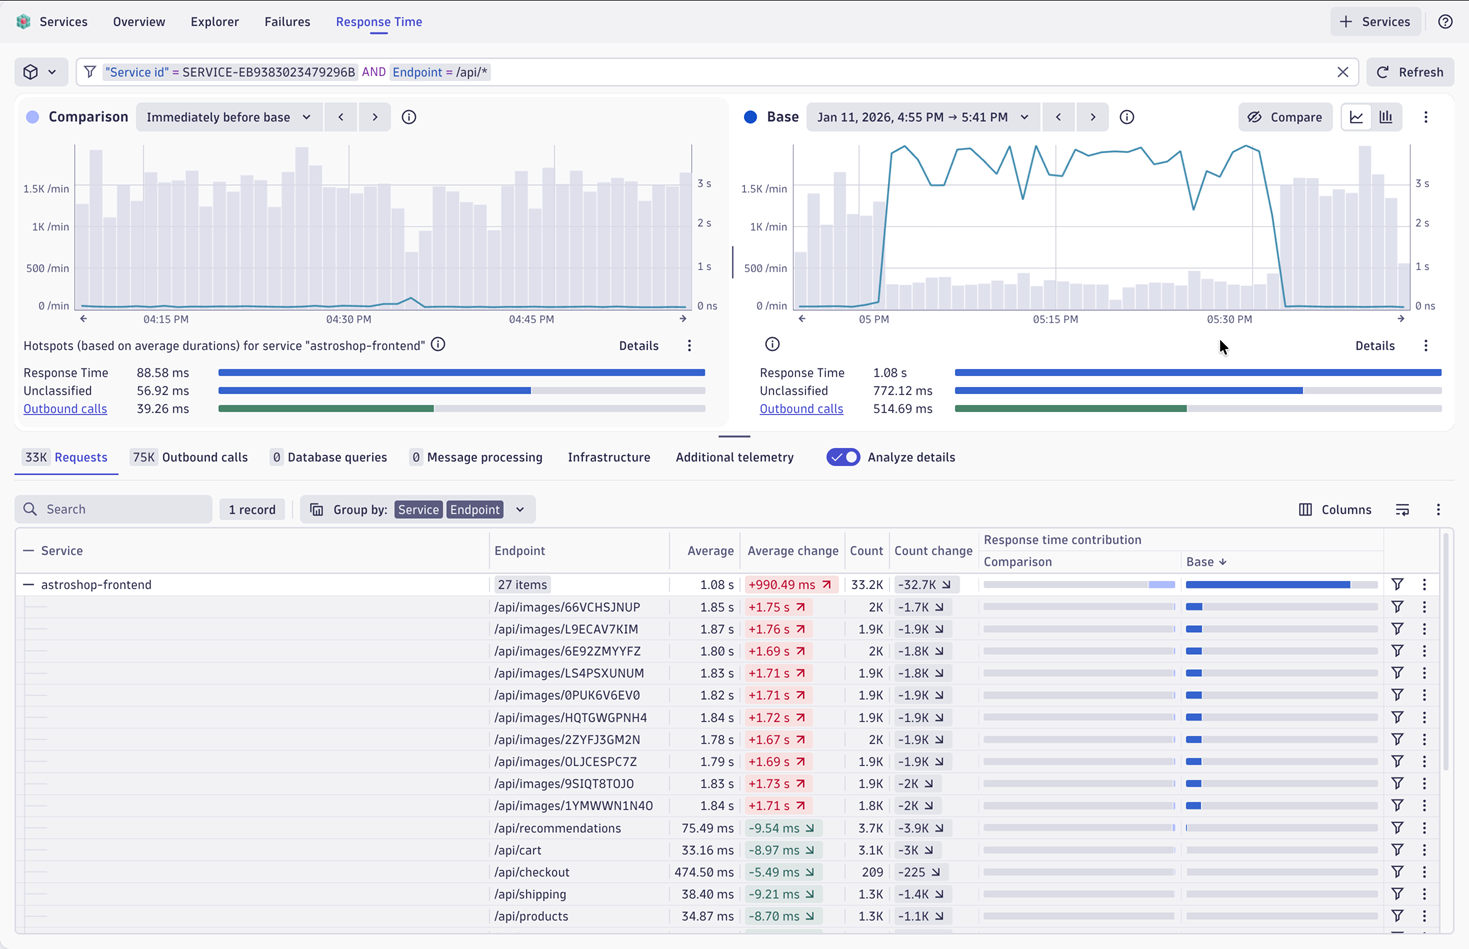
Response time analysis with full telemetry context
Mass data analysis extends to performance insights. Dynatrace delivers response time analysis and comparisons built for practitioners. The platform allows you to easily compare failures between two time windows to spot exactly when things degraded.
See how response times correlate with database performance, downstream dependencies, like calls or queue interactions, and infrastructure resource utilization.
Dive in visually, explore the correlated context, and understand what’s happening- all in one place.
Database queries: understand service-to-database interactions
Modern services thrive or fail based on their interactions with their databases. Dynatrace provides comprehensive database analysis for OpenTelemetry-instrumented services, showing exactly what your services are doing against your databases.

Get immediate visibility into your most expensive queries across your entire environment- whether it’s Cassandra, SQL, or other databases. Queries are automatically ranked by cumulative duration (query count times query duration), surfacing what’s actually costing you performance.
When troubleshooting an individual service, you immediately see which database calls are problematic. You can also examine patterns across many services: identifying query problems, detecting spikes, or discovering when services start overwhelming databases with inefficient calls. The view aligns with how your architecture actually functions.
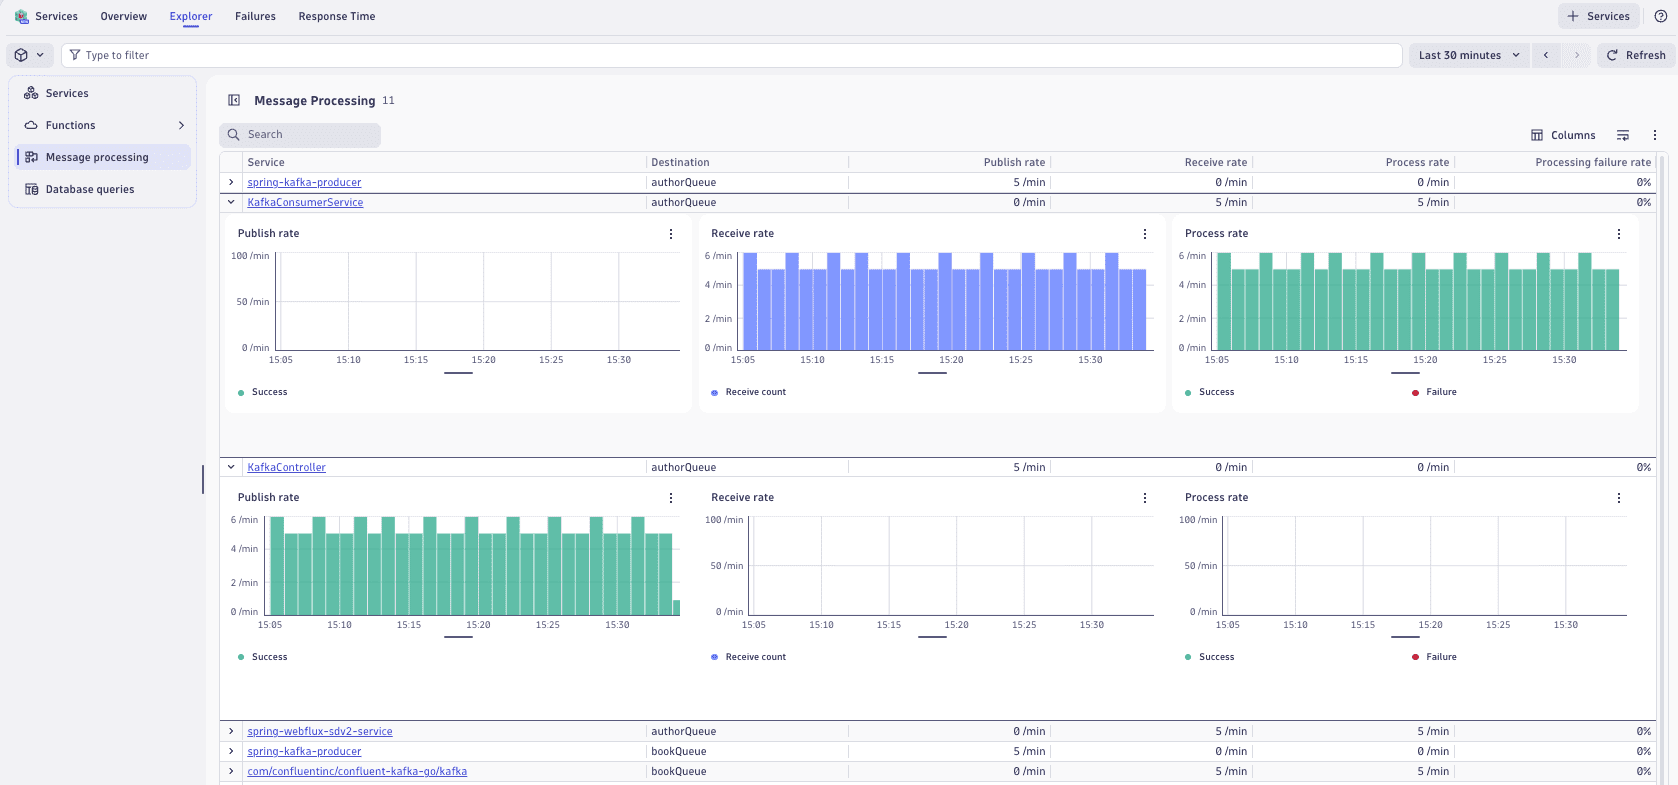
Cloud native queuing systems support
Modern applications stream data through Kafka, RabbitMQ, MQTT, and SQS, sending thousands of messages per second through distributed architectures. Dynatrace delivers comprehensive visibility into these message processing interactions with dedicated metrics, dashboarding, and alerting designed specifically for how modern streaming systems actually operate.
See which services are publishing or receiving messages from which queues, with full performance metrics. Advanced filtering lets you explore your entire environment or drill into a specific service’s queue interactions.
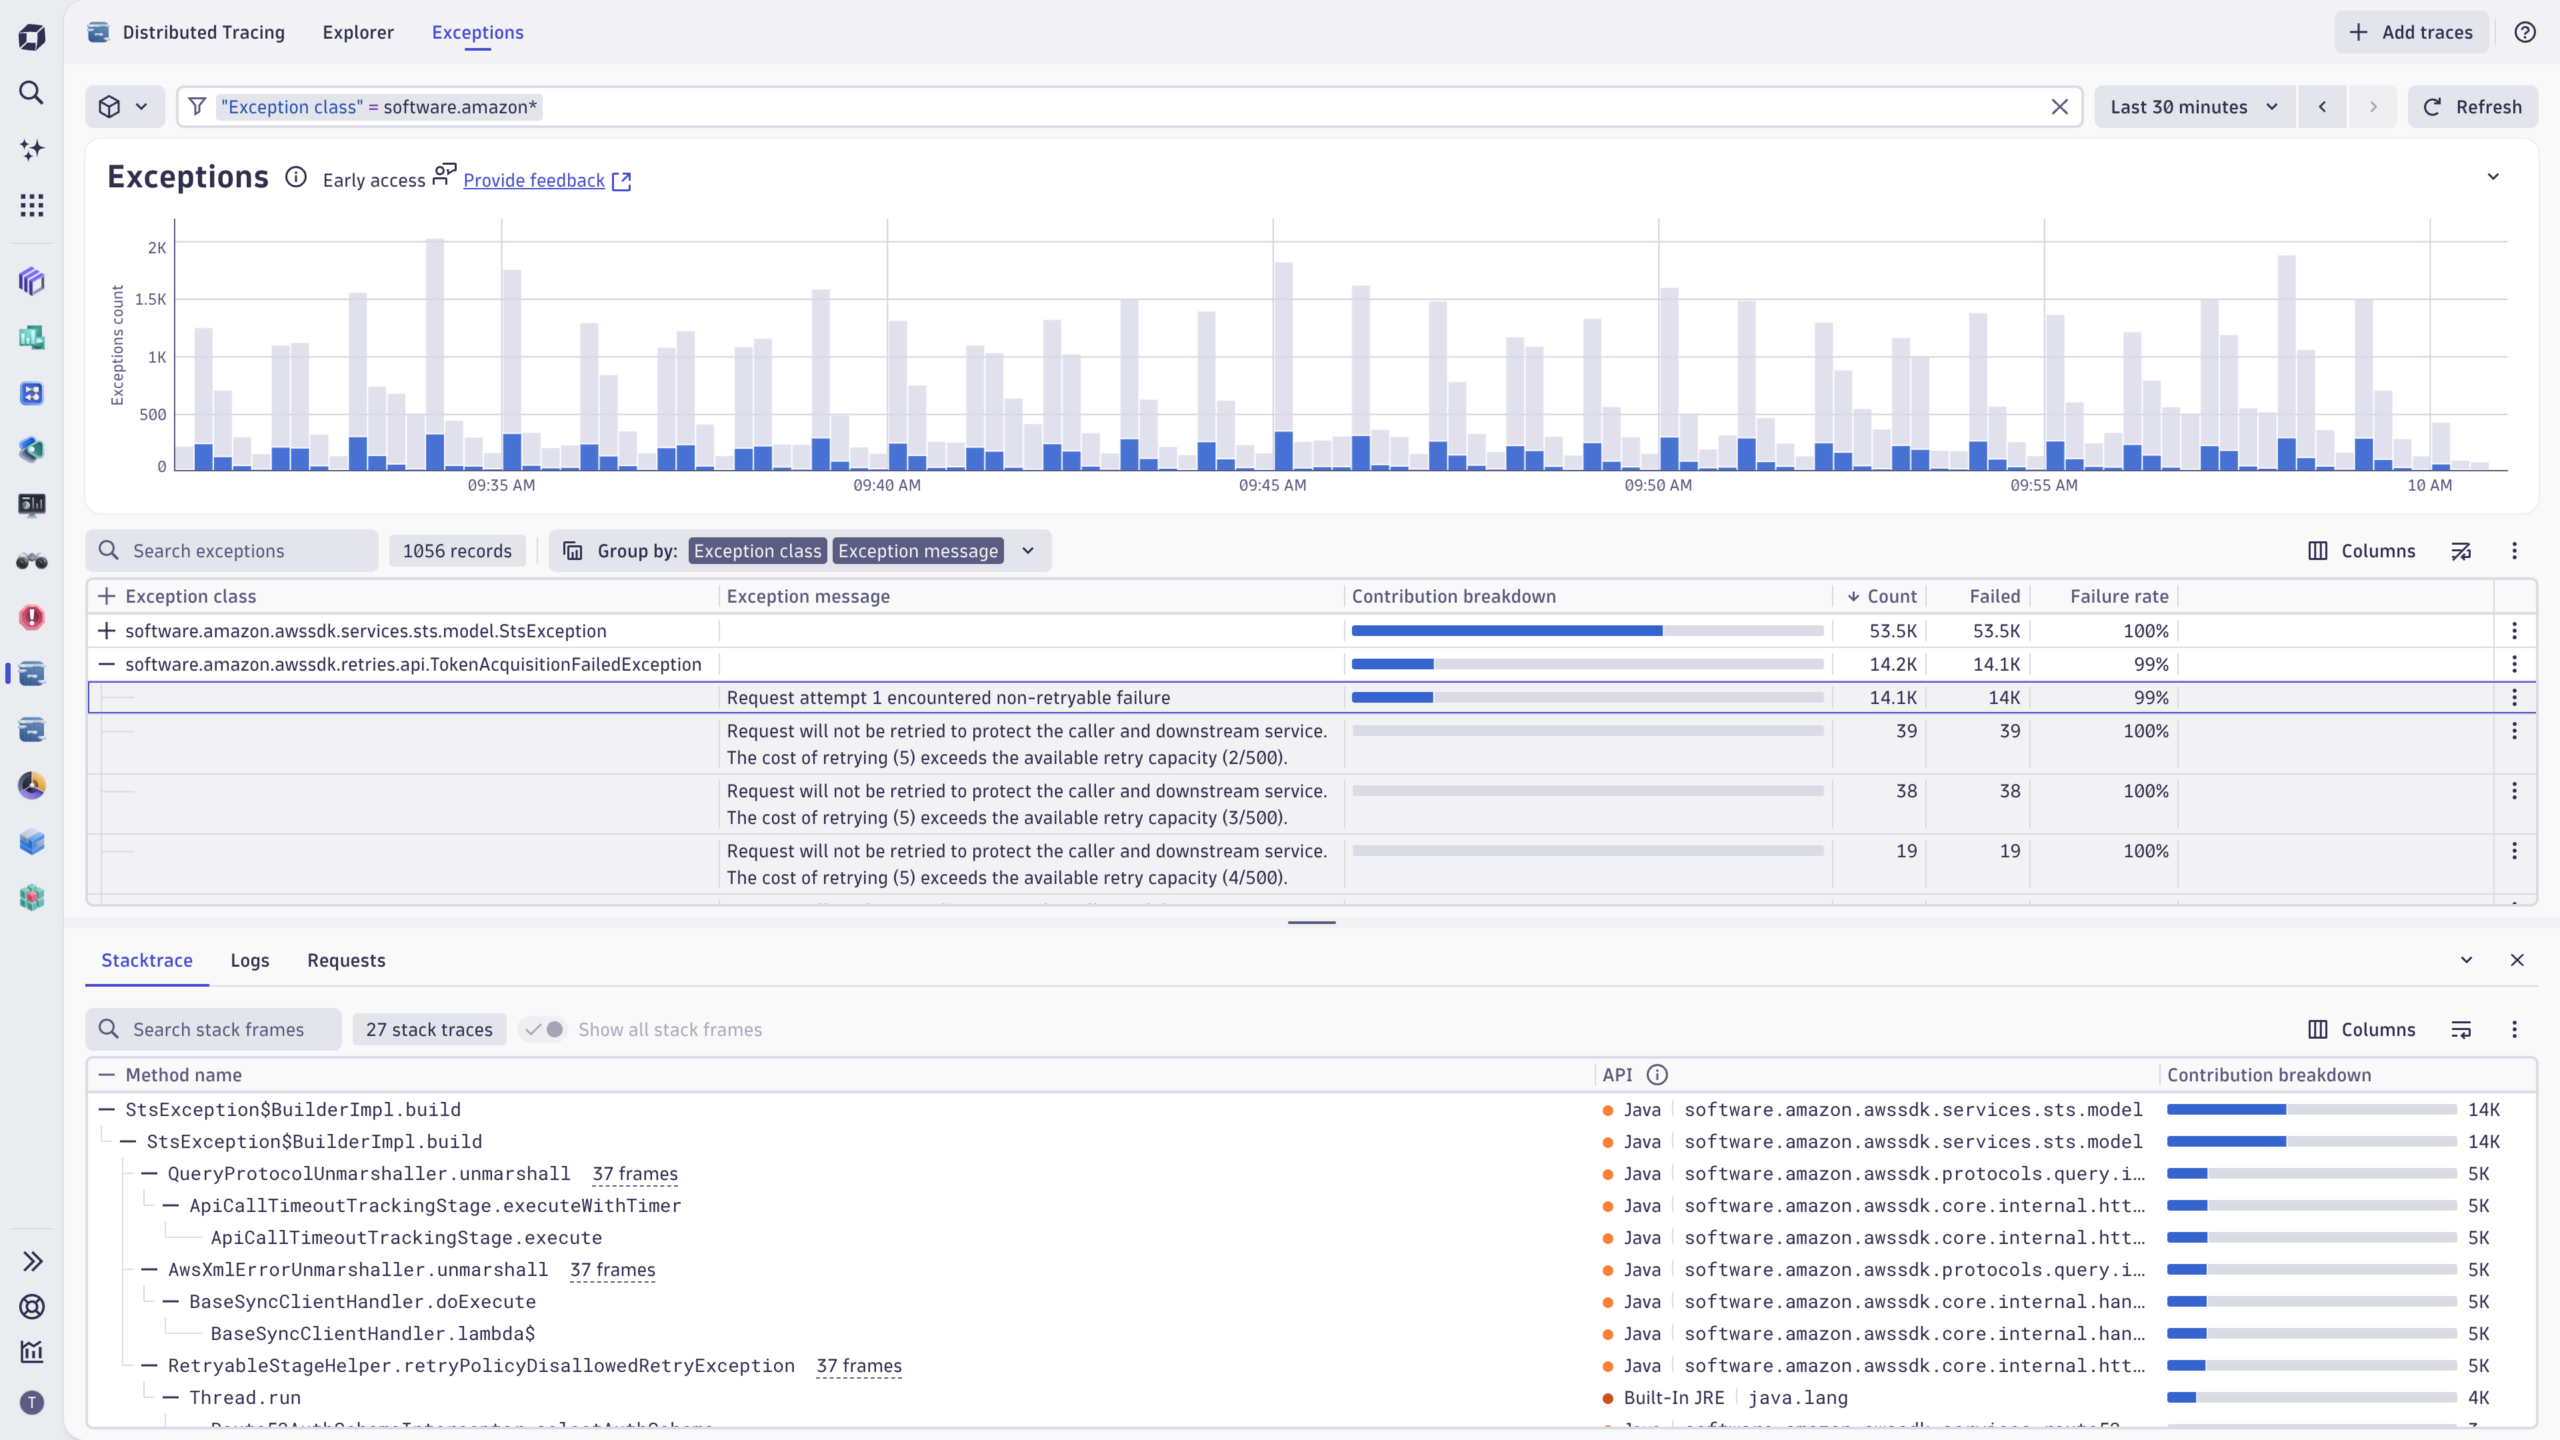
Exception analysis: uncover patterns and failures
We’ve only scratched the surface of how service analysis capabilities can make an impact. From the Services app, you can seamlessly navigate to related traces in the Distributed Tracing app, which now includes extended Exception Analysis. This enhancement surfaces exceptions across traces with readable stack traces, aggregated insights, and visual markers to highlight problematic spans.
By analyzing exceptions in context, teams can quickly identify patterns, prioritize fixes, and reduce MTTR. Whether leveraging OneAgent or OpenTelemetry, no critical issue goes unnoticed, providing complete visibility and reliability across modern environments.
AI-powered intelligence: pinpoint the needle in the haystack
Dynatrace AI delivers actionable insights through baselining, anomaly detection, and precise alerting, continuously learning your environment’s behavior. From day one, these capabilities surface meaningful deviations with full context, enabling teams to act quickly and confidently.
By analyzing OpenTelemetry data, you can detect trends, predict potential issues, and get intelligent, context-rich alerts. This ensures teams can focus on what matters most- resolving problems faster and optimizing performance- without manual effort or guesswork.
Enterprise operational controls that scale
Beyond analytics, enterprise teams need operational capabilities that work with OpenTelemetry data:
- Primary fields and tags: Use your existing Kubernetes labels and cloud tags (AWS, Azure) to filter and organize telemetry data. Filter by namespace, cluster, deployment, or custom business dimensions to focus on what matters most.
- Cost allocation: Track and understand costs by subscription, project, or resource group to optimize spending and ensure efficient resource usage.
- Pipeline routing and processing: Route telemetry data to specific pipelines based on cloud provider, region, or cluster. Control how data flows through your observability stack to improve efficiency and ensure compliance.
- Bucket assignment: Assign data storage by environment, account, or custom dimensions. Optimize retention and costs while adapting to operational requirements.
- Security context: Tag data with permissions and access controls, so teams see only the namespaces and services they’re authorized to access.
These aren’t add-ons; they’re core platform capabilities that work identically whether you use OpenTelemetry or OneAgent instrumentation.
The bottom line
Success comes from choosing the analytics platform designed for practitioners in modern environments- one that delivers insights across millions of signals with AI-powered intelligence. Dynatrace meets you where you are with the “Data in Context” advantage: every signal works together with the enterprise capabilities that cloud native environments demand.
The enhanced Services app and the Distributed Tracing app are now available for Dynatrace Platform Subscription (DPS) customers.
Check out the Dynatrace Playground to experience OpenTelemetry for Enterprise firsthand.
Join us at Perform in Las Vegas, January 26-29!


Looking for answers?
Start a new discussion or ask for help in our Q&A forum.
Go to forum