While Dynatrace has long enabled you to define threshold settings that specify at what levels performance anomalies are severe enough to justify raising problems, with the latest release you can now also define performance-anomaly thresholds for infrastructure components that are monitored with plugins for third-party technologies.
Dynatrace automatically learns your application’s baseline performance and detects response-time degradation and error rate increases within your application environment. Infrastructure performance issues that don’t affect your application’s key business workflows or customer experience are monitored, but problem alerts aren’t raised until specific threshold criteria are met. Now you can set performance-anomaly thresholds for technologies monitored with Dynatrace plugins.
Adjust threshold settings for custom plugin events
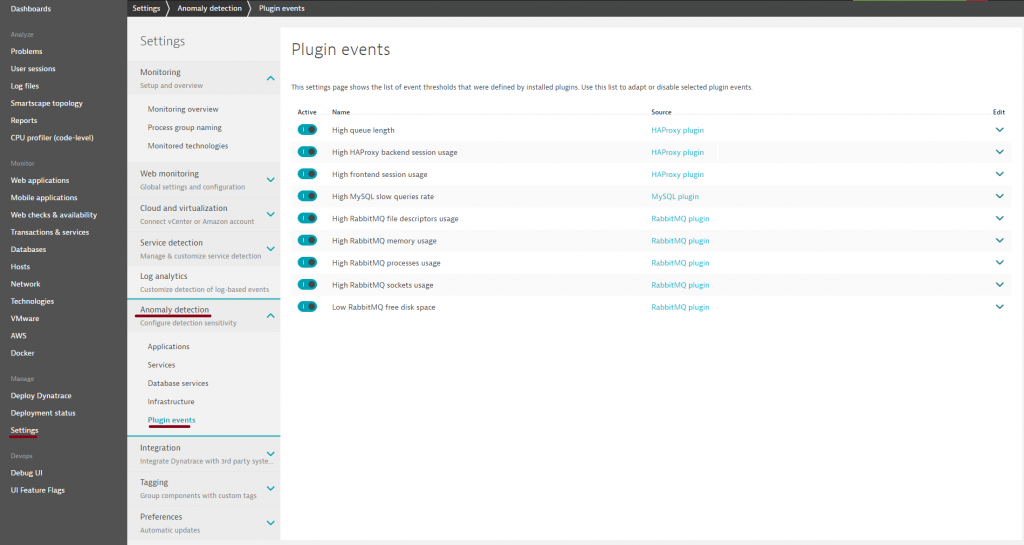
- Go to Settings > Anomaly detection > Plugin events.
Here you’ll find a list of all the event types that your installed monitoring plugins provide.

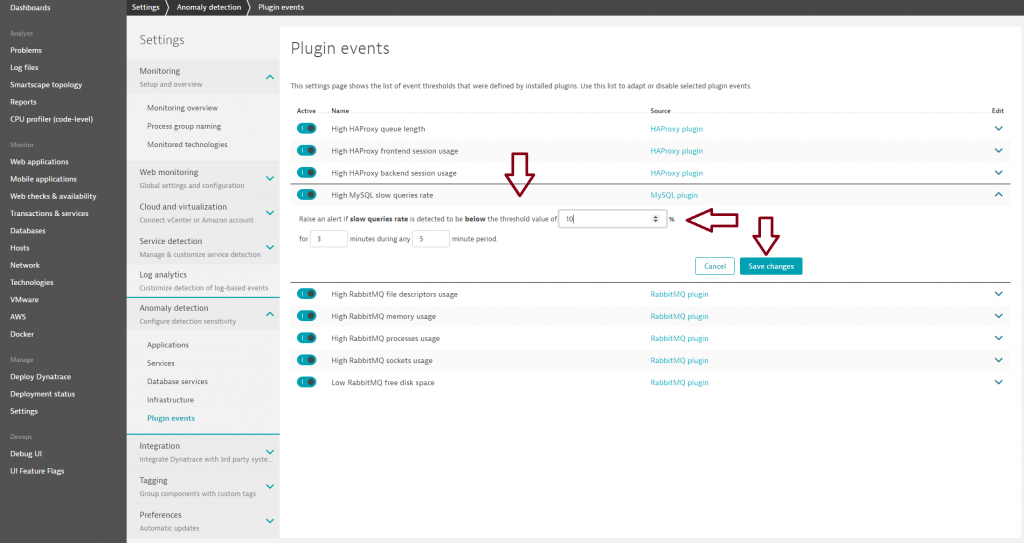
- Click Edit to view the provided threshold settings for each event type.

- Click Save changes.
View all infrastructure problems
By default, infrastructure-only issues (i.e., issues that don’t affect your application or customer experience) aren’t tracked or listed in your Problems feed. To include all infrastructure-related problems in your Problems feed, even those problems that don’t impact your application or customers, follow the steps below.
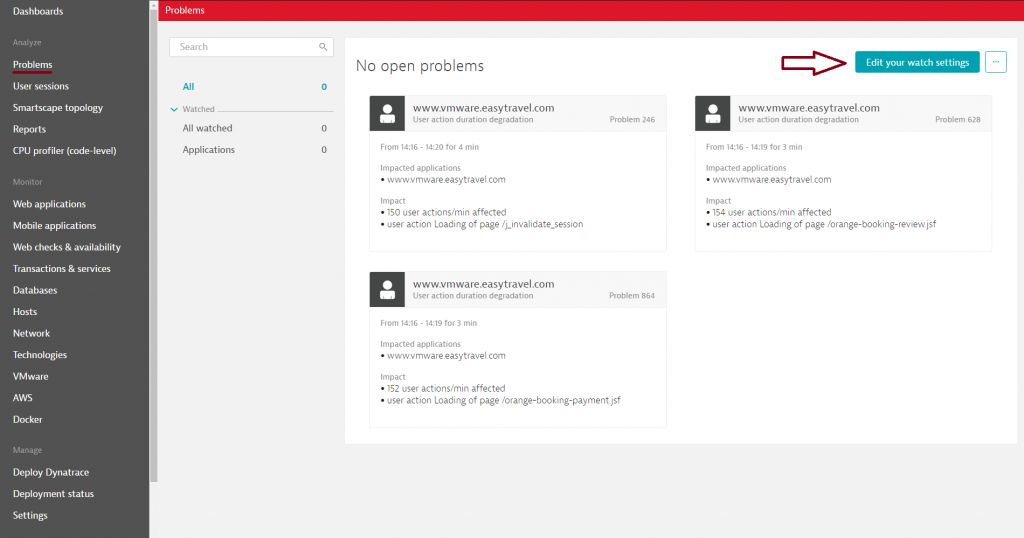
- Select Problems from the navigation menu.
- Click Edit your watch settings.

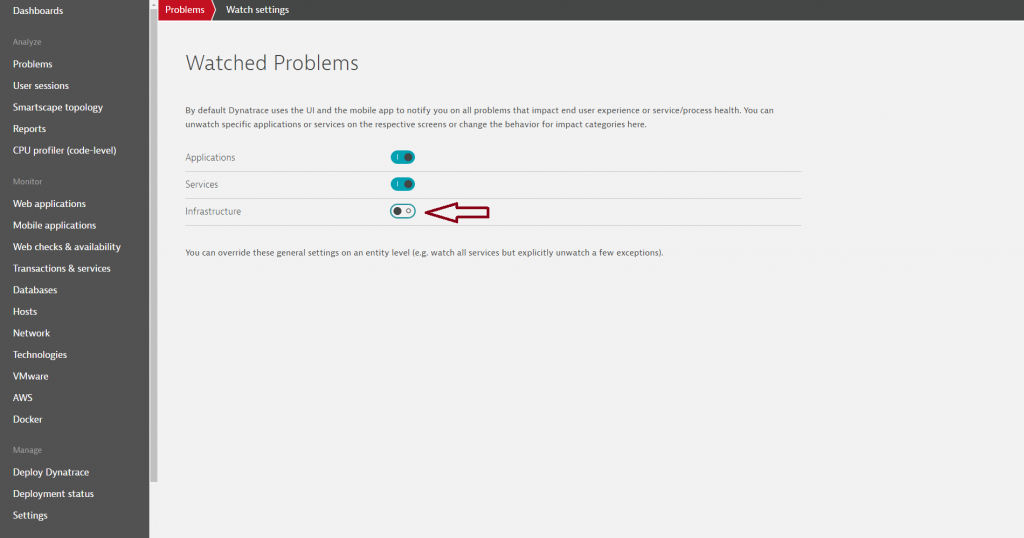
- Enable the Infrastructure switch.


Looking for answers?
Start a new discussion or ask for help in our Q&A forum.
Go to forum