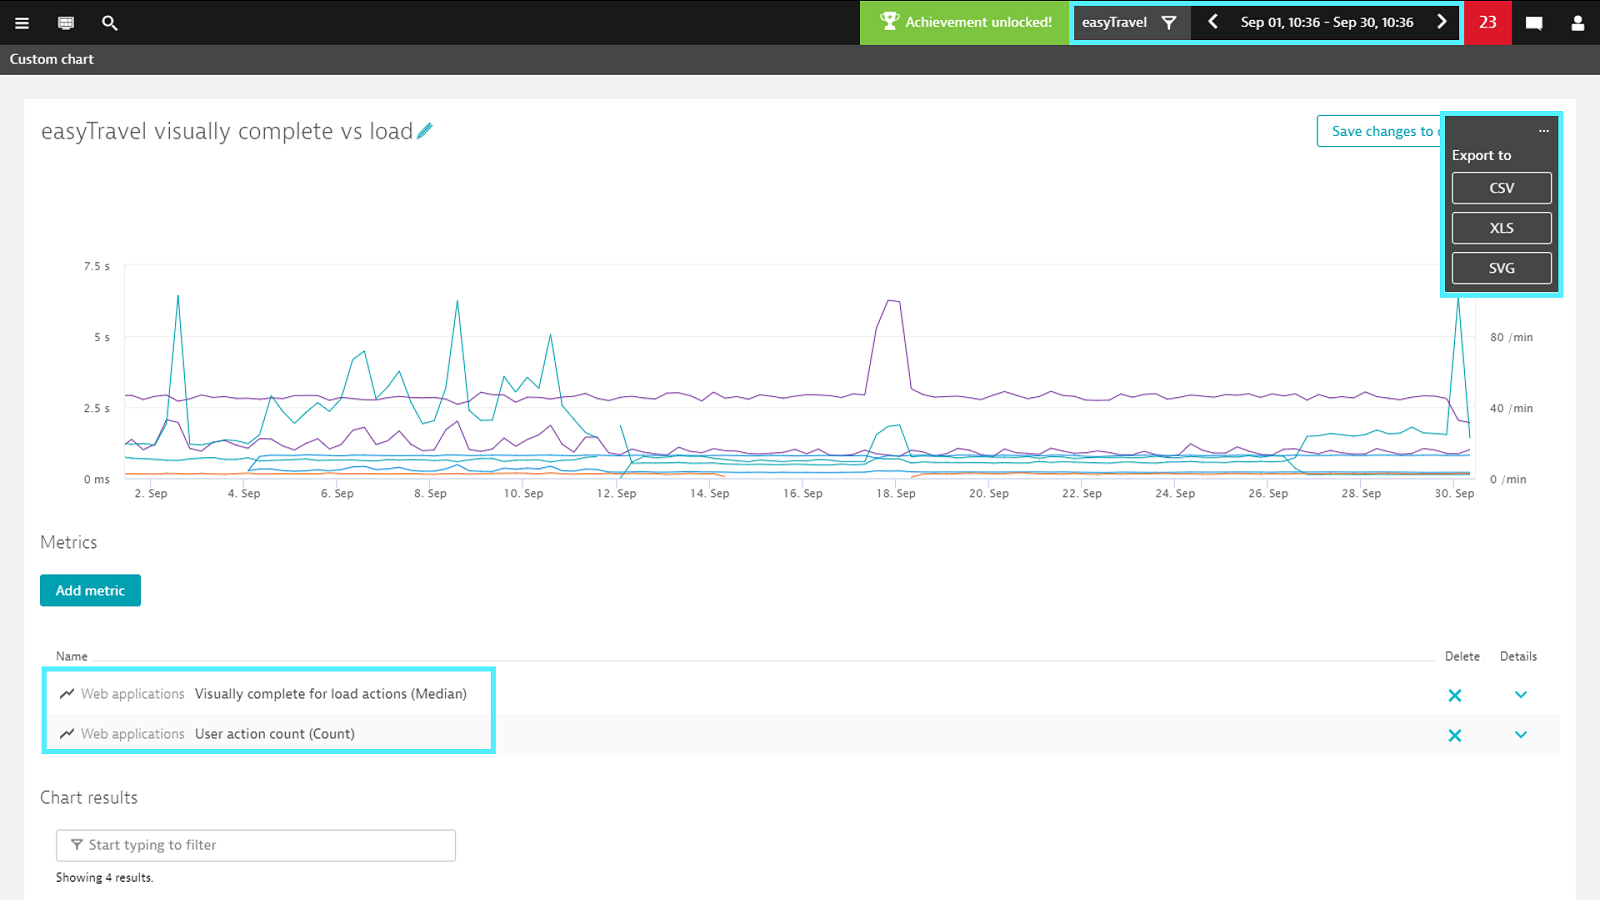
We’re continuously working to give you more ways of presenting and sharing Dynatrace data on your dashboards. Our goal is to enable more members of your organization to benefit from Dynatrace to uplevel their decision making. While it’s possible to provide read-only access to a Dynatrace environment, an account and a connection are still needed. For use cases where data needs to be available offline, such as for providing a quick performance report to management, or where access to a Dynatrace environment is simply not an option, Dynatrace version 1.155 introduces the ability to download the monitoring data that’s collected for and presented within Dynatrace custom charts. Data can be downloaded in XLS, CSV, and SVG formats.
What you get with this update
- Downloadable XLS, CSV, and SVG data snapshots of configured custom charts
How it works
The exported data depends on the custom chart configuration at the time the export is triggered. In general, a custom chart can show:
- A maximum of five metrics
- A specific analysis time frame
- Data filtered by means of management zones and/or metric-specific dimensional filters. See our custom chart documentation for more details.
To export the data of a custom chart, click the browse […] button in the upper-right corner of any custom chart. Then select the desired export format (CSV, XLS or SVG). This option is available as long as at least one metric is configured for the chart.

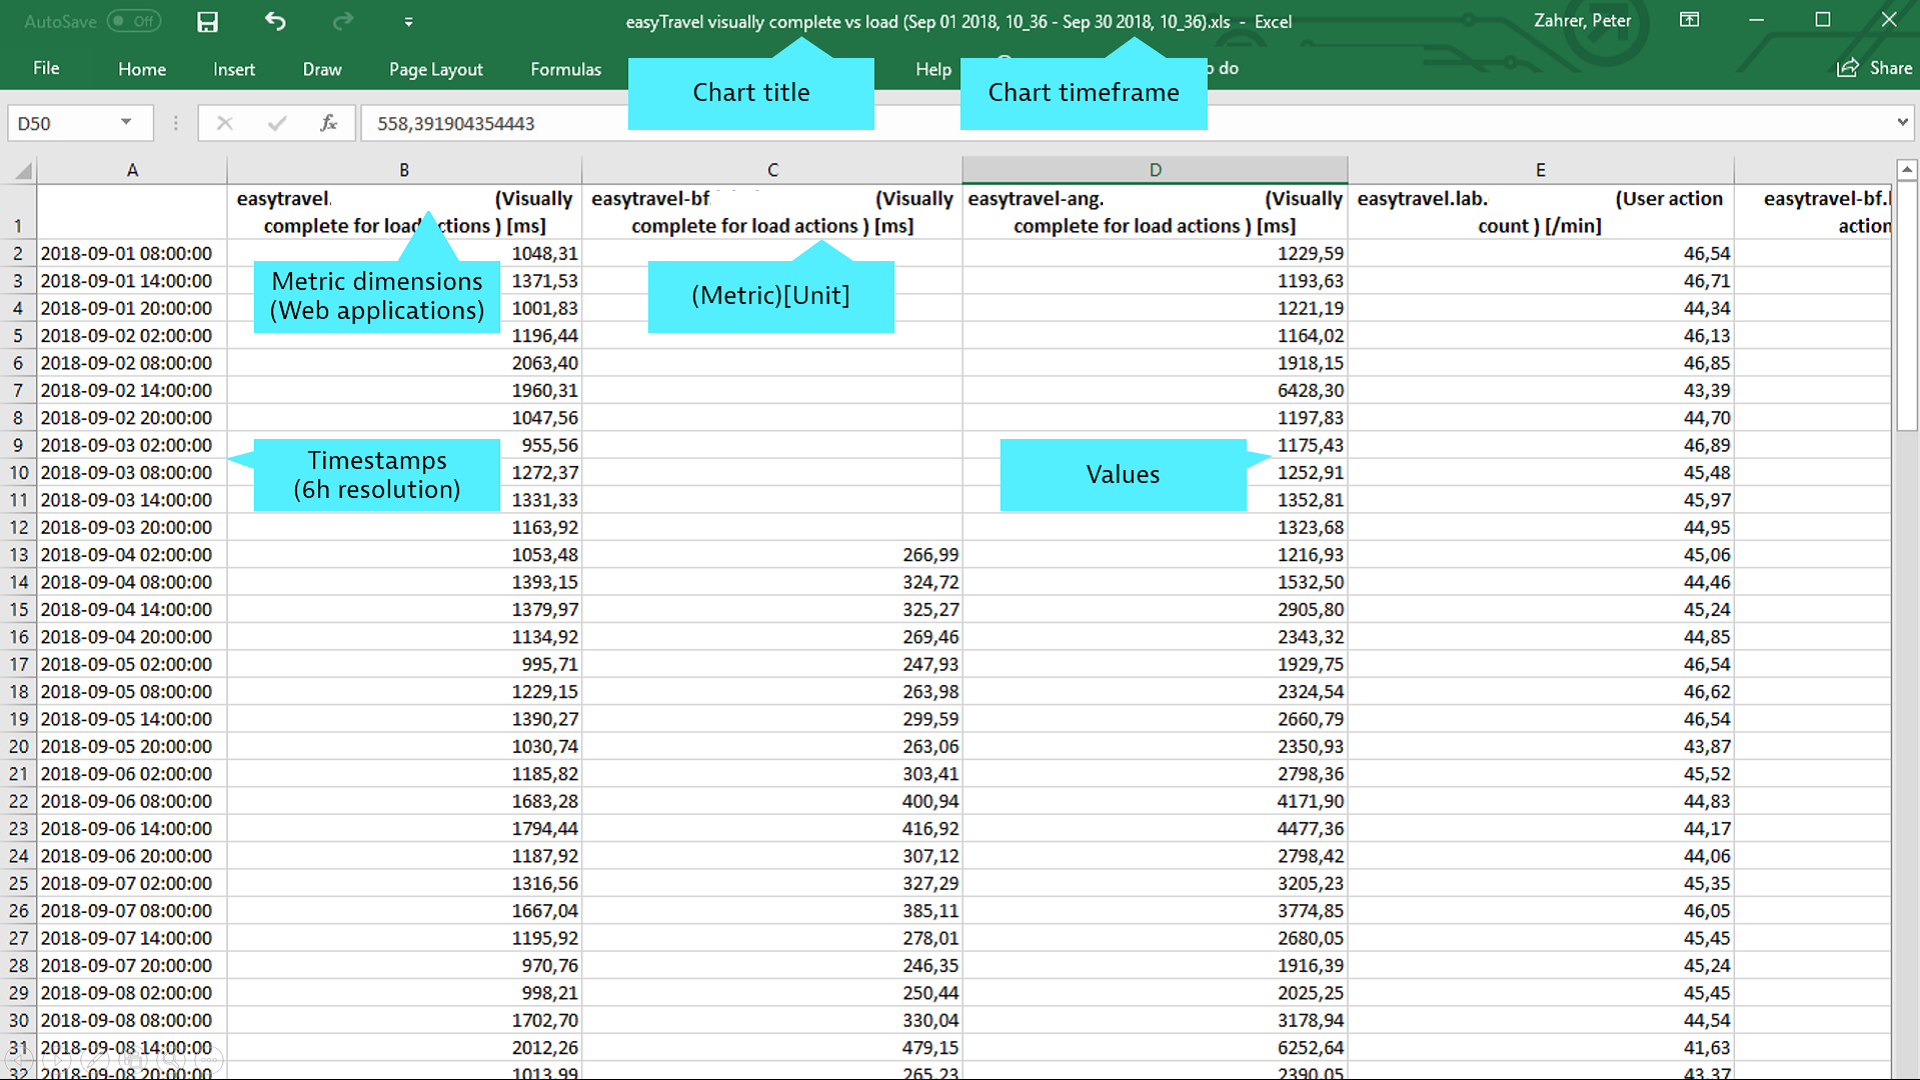
The filename, regardless of the selected format, contains the title for the custom chart plus the selected analysis time frame. From the example above, the exported XLS filename is:
easyTravel visually complete vs load (Sep 01 2018, 10_36 - Sep 30 2018, 10_36).xls
XLS and CSV
In the sample data export file below, you can see the Speed index and the user action count of four monitored web applications. Each combination of metric and web application occupies a separate column. Since the chart is configured for an analysis time frame of one month, Dynatrace defaults to a resolution of six hours, resulting in about 120 data points of captured data for each web application.

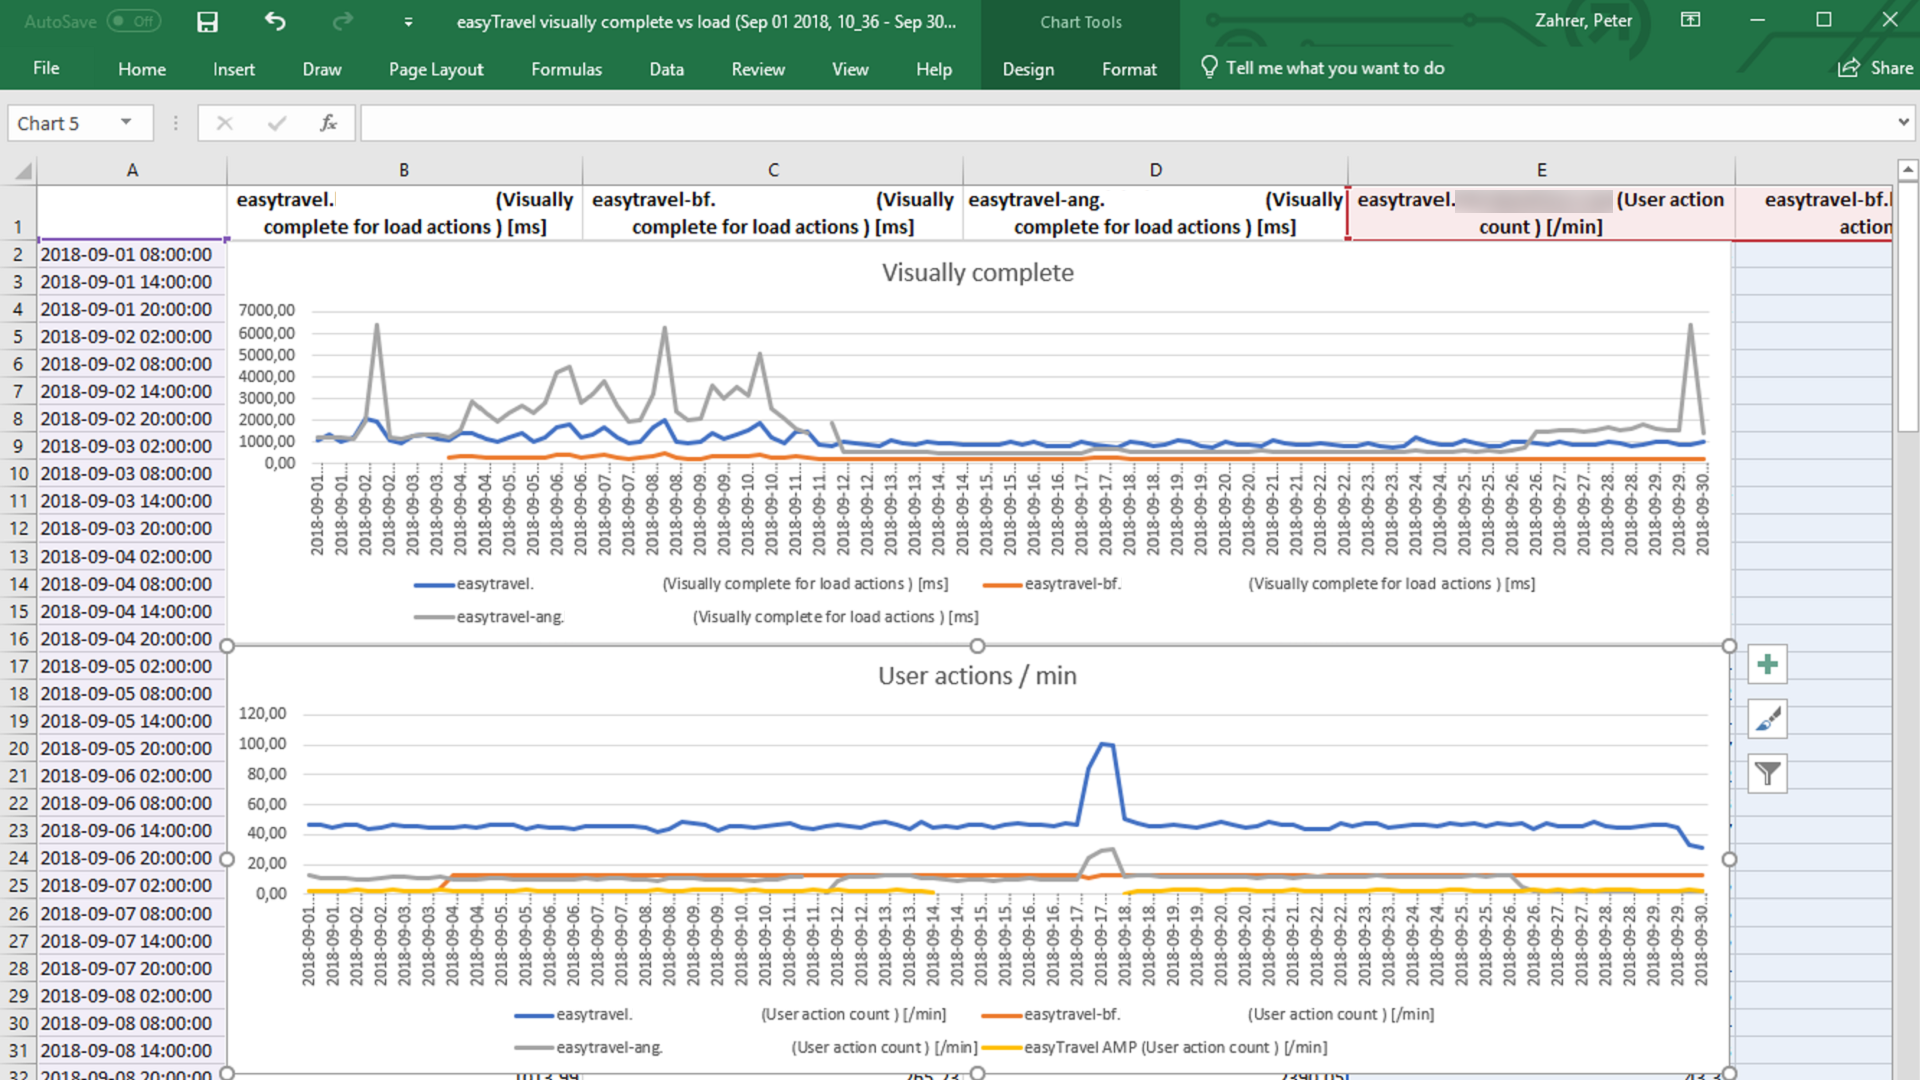
It’s then easy to use the built-in charting capabilities of Excel to visualize exported metrics and their dimensional values to recreate your original custom chart configuration (see example below).

The same data is also available via CSV export, to be used or post-processed using tools of your choice.
SVG
The SVG export represents a simple snapshot of the custom chart that can be used within presentations or added to reports.

What’s next?
Data export for custom charts in XLS, CSV, or SVG format represents a first step. Next, we’ll make it easier to integrate Dynatrace into your existing BI tooling landscape. Since Dynatrace follows an “API first” mindset, this existing export functionality will be extended with the capability to retrieve the preconfigured REST call to the Dynatrace time series API.
Start a free trial!
Dynatrace is free to use for 15 days! The trial stops automatically, no credit card is required. Just enter your email address, choose your cloud location and install our agent.


Looking for answers?
Start a new discussion or ask for help in our Q&A forum.
Go to forum