
From working with Dynatrace Notebooks, you know that exploratory analytics are crucial for uncovering the narratives within your organization’s data. By leveraging visual data analytics and collaboration input from development, security, and business teams, such insights become transparent, enabling immediate understanding and action on the implications for your business. Further, it’s essential to take automated actions to proactively use anomaly detection to determine if your business is at risk. Such anomaly detection should be implemented in straightforward steps, as described in this blog post.
Dynatrace Intelligence builds on Davis AI®, advancing how teams detect, analyze, and respond to anomalies in their data.
Dynatrace Grail™ data lakehouse provides contextual analytics across unified observability, security, and business data. It allows you to query and combine data anytime using the Dynatrace Query Language (DQL). This enables exploratory data analysis and the ability to collaborate visually on the results with your colleagues.
Anomaly detection in Notebooks
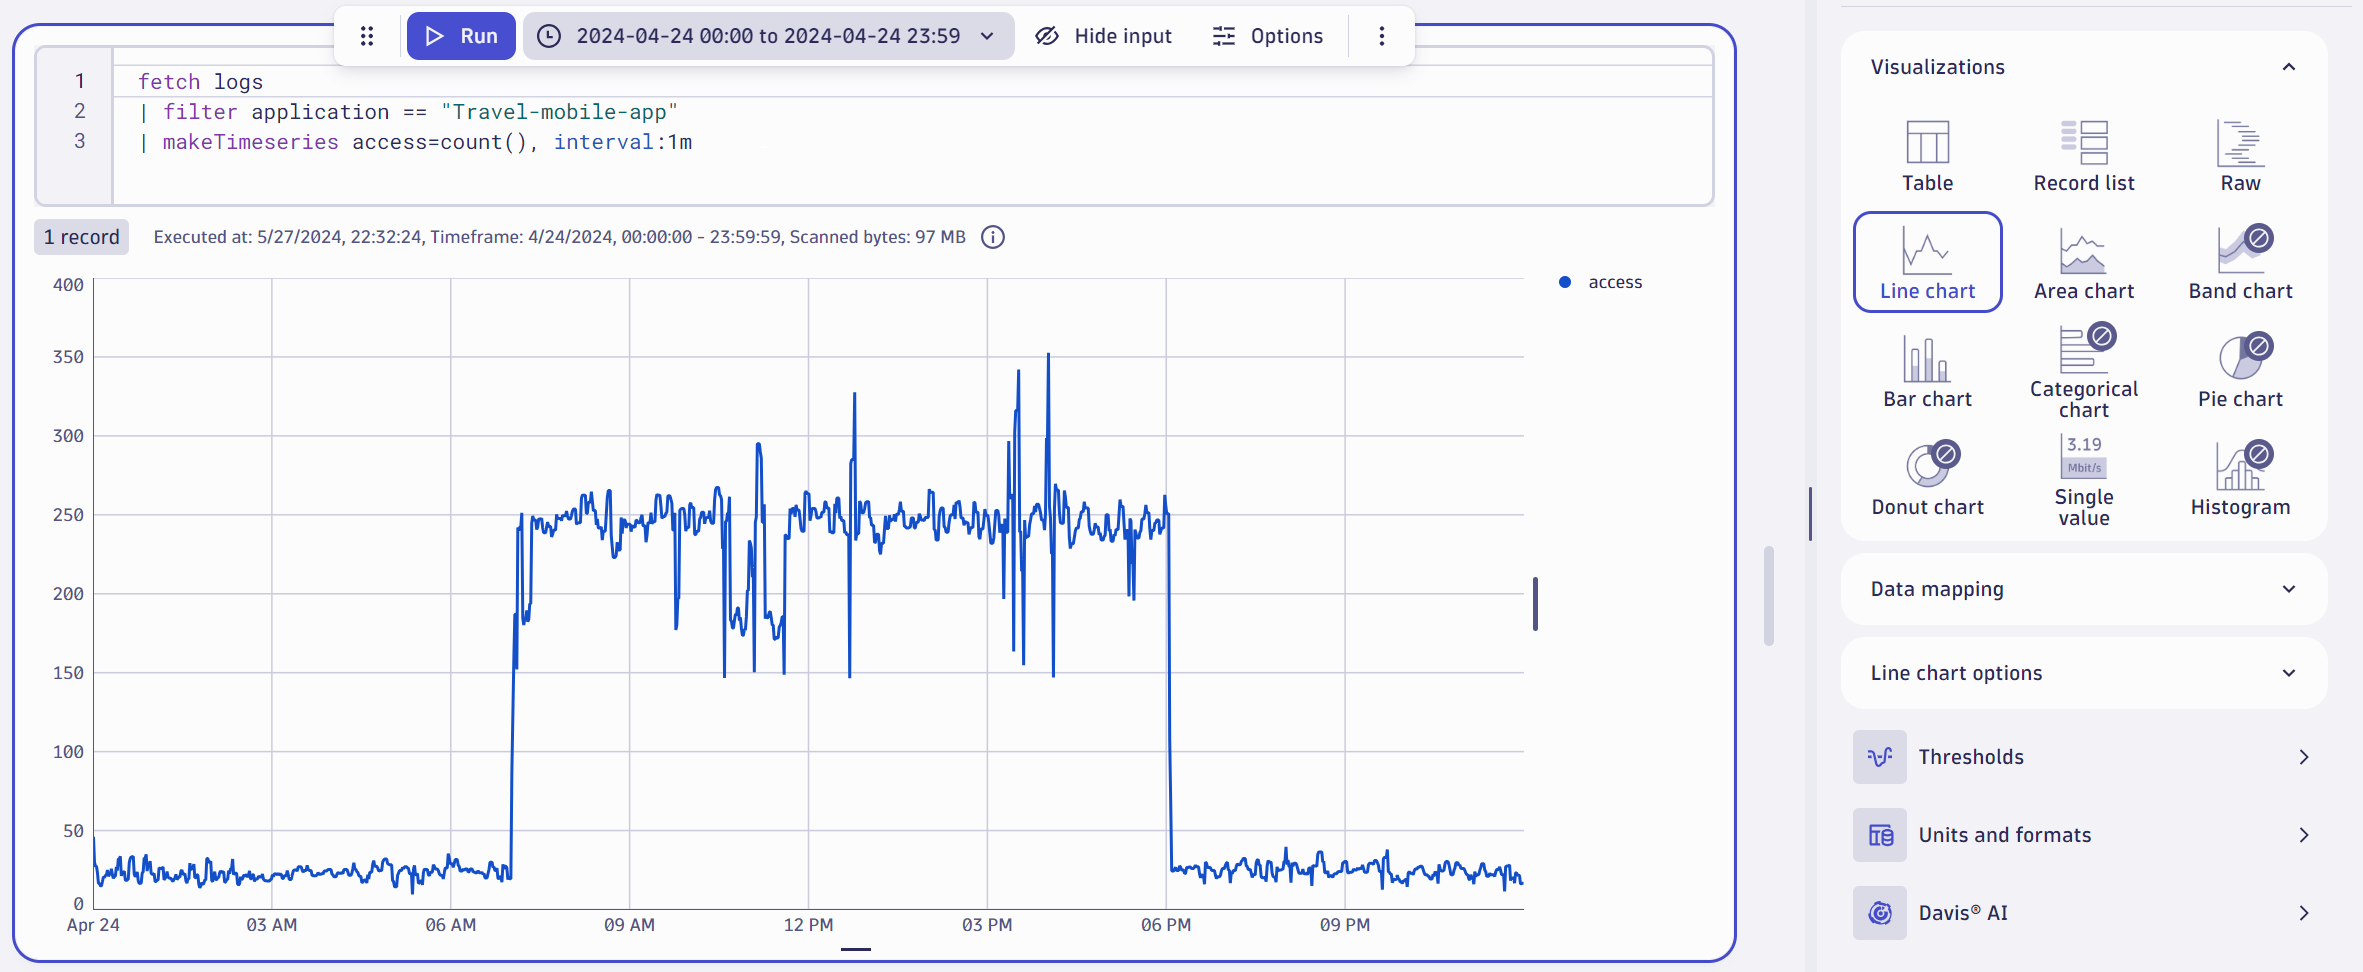
You likely encounter “why” questions in your daily work. Why did we have an outage? Why did the system behave differently? Why did I receive an alert? These questions can be effectively investigated in Dynatrace Notebooks, where you can easily compile the necessary data and break it down into a time series. However, in the time series example below, we must determine whether the number of access attempts to our example Travel Mobile app is normal or abnormal.
In many cases, it’s evident, based on your past experiences looking at time series data, whether or not something is an anomaly. But how can you automate your expertise? Such automation could ensure that you and your colleagues don’t have to manually monitor time series to identify whether or not they include anomalies.
Davis® AI provides such automated anomaly detection out of the box. Still, your business requires the flexibility of Davis AI to detect anomalies based on your specific requirements, for example, to automatically generate a Davis problem based on a detected anomaly. For this purpose, we provide the Davis AI Analyzer, which allows you to select a specific analyzer. Three anomaly detection analyzers are available, each equipped with unique mechanisms to detect anomalies in your data that significantly deviate from the norm.
- Static threshold anomaly detection
- Auto-adaptive threshold anomaly detection
- Seasonal baseline anomaly detection
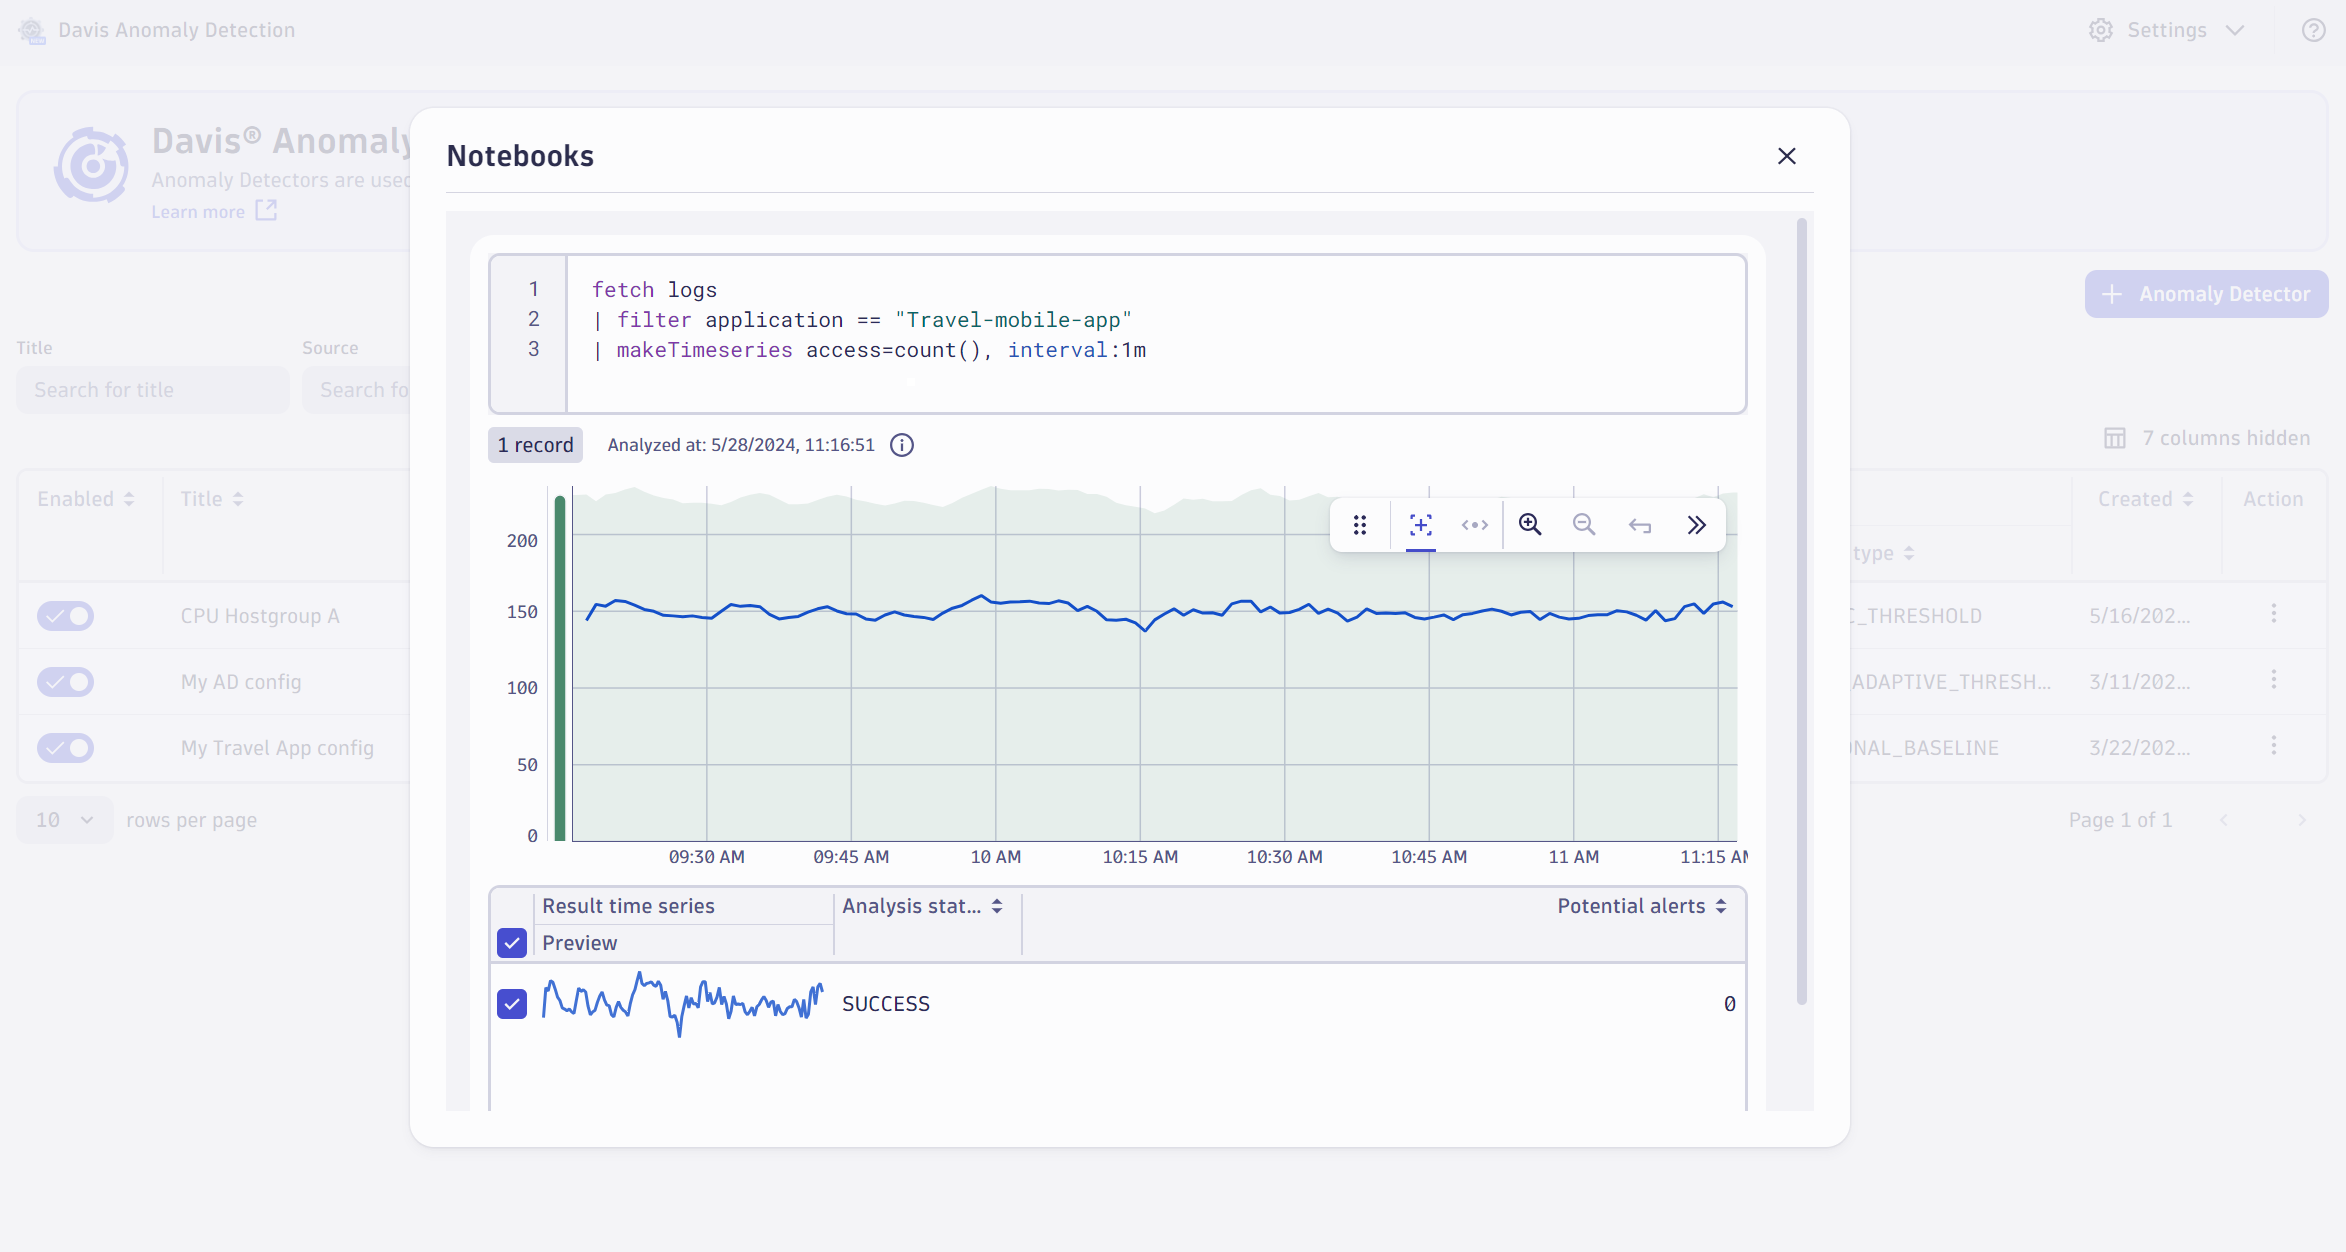
One unique feature of the Davis AI Analyzer is that it works on any time series, regardless of its origin—whether generated with makeTimeseries from events, business events, logs, or other sources or the joining of different time series. As you can see in the screenshot below, Davis AI Analyzer gains the full power of DQL, making Davis anomaly detection even more flexible and stronger than ever. This power can be easily experienced by selecting the desired Davis anomaly detection analyzer in Notebooks or Dashboards.
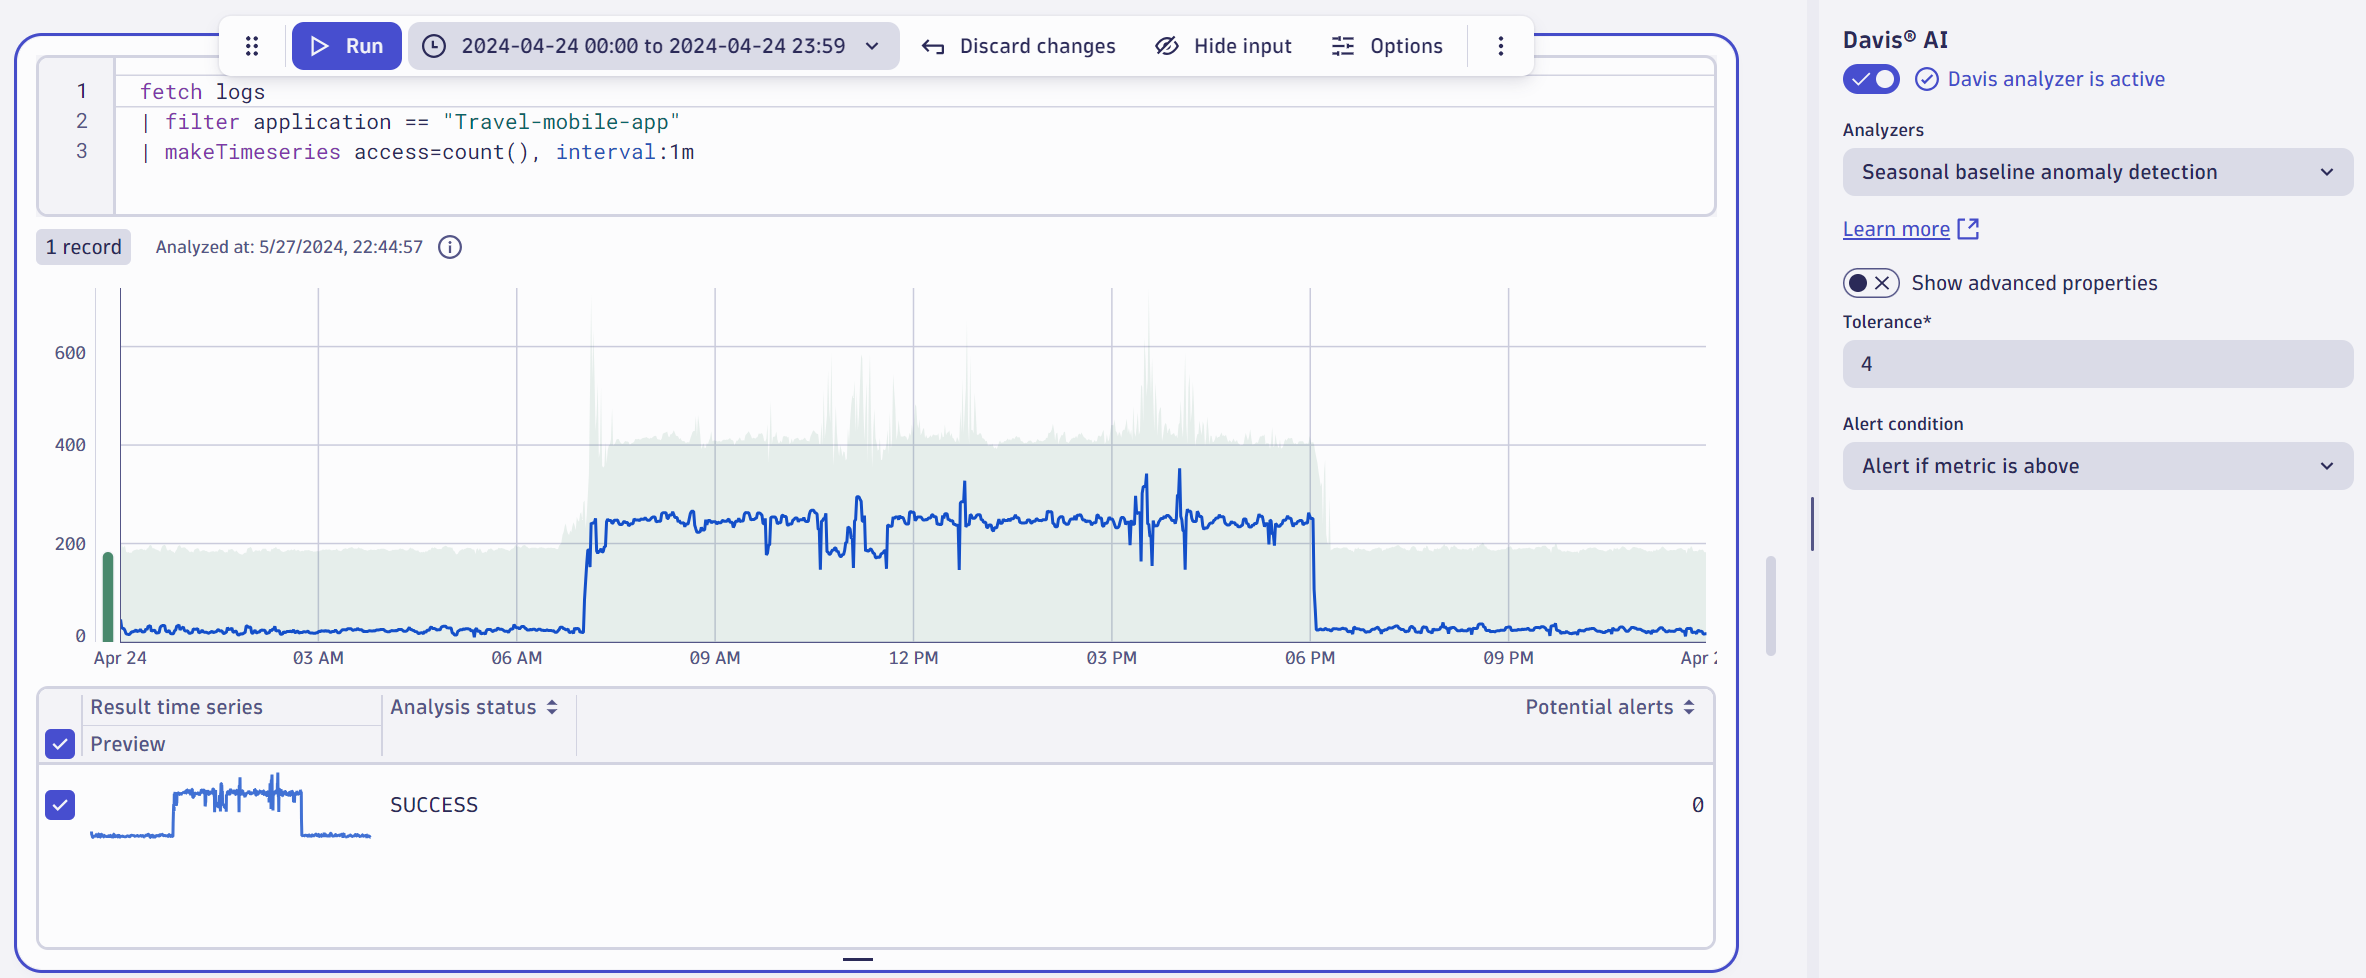
By selecting the seasonal baseline analyzer, Davis AI recognizes that the number of attempted accesses to the app in this example doesn’t deviate from the norm based on the past data during the same period. The time series falls within the seasonal green confidence band. A potential alert would be visually simulated if the time series fell outside this band.
This anomaly detector observes the number of attempted accesses per minute and triggers an event when anomalies are detected. You can create a similar Davis anomaly detector in a few simple steps.
Automate your experience with Davis Anomaly Detection
In Notebooks, select open with and choose Davis Anomaly Detection; all settings required for creating an anomaly detector will be carried over.
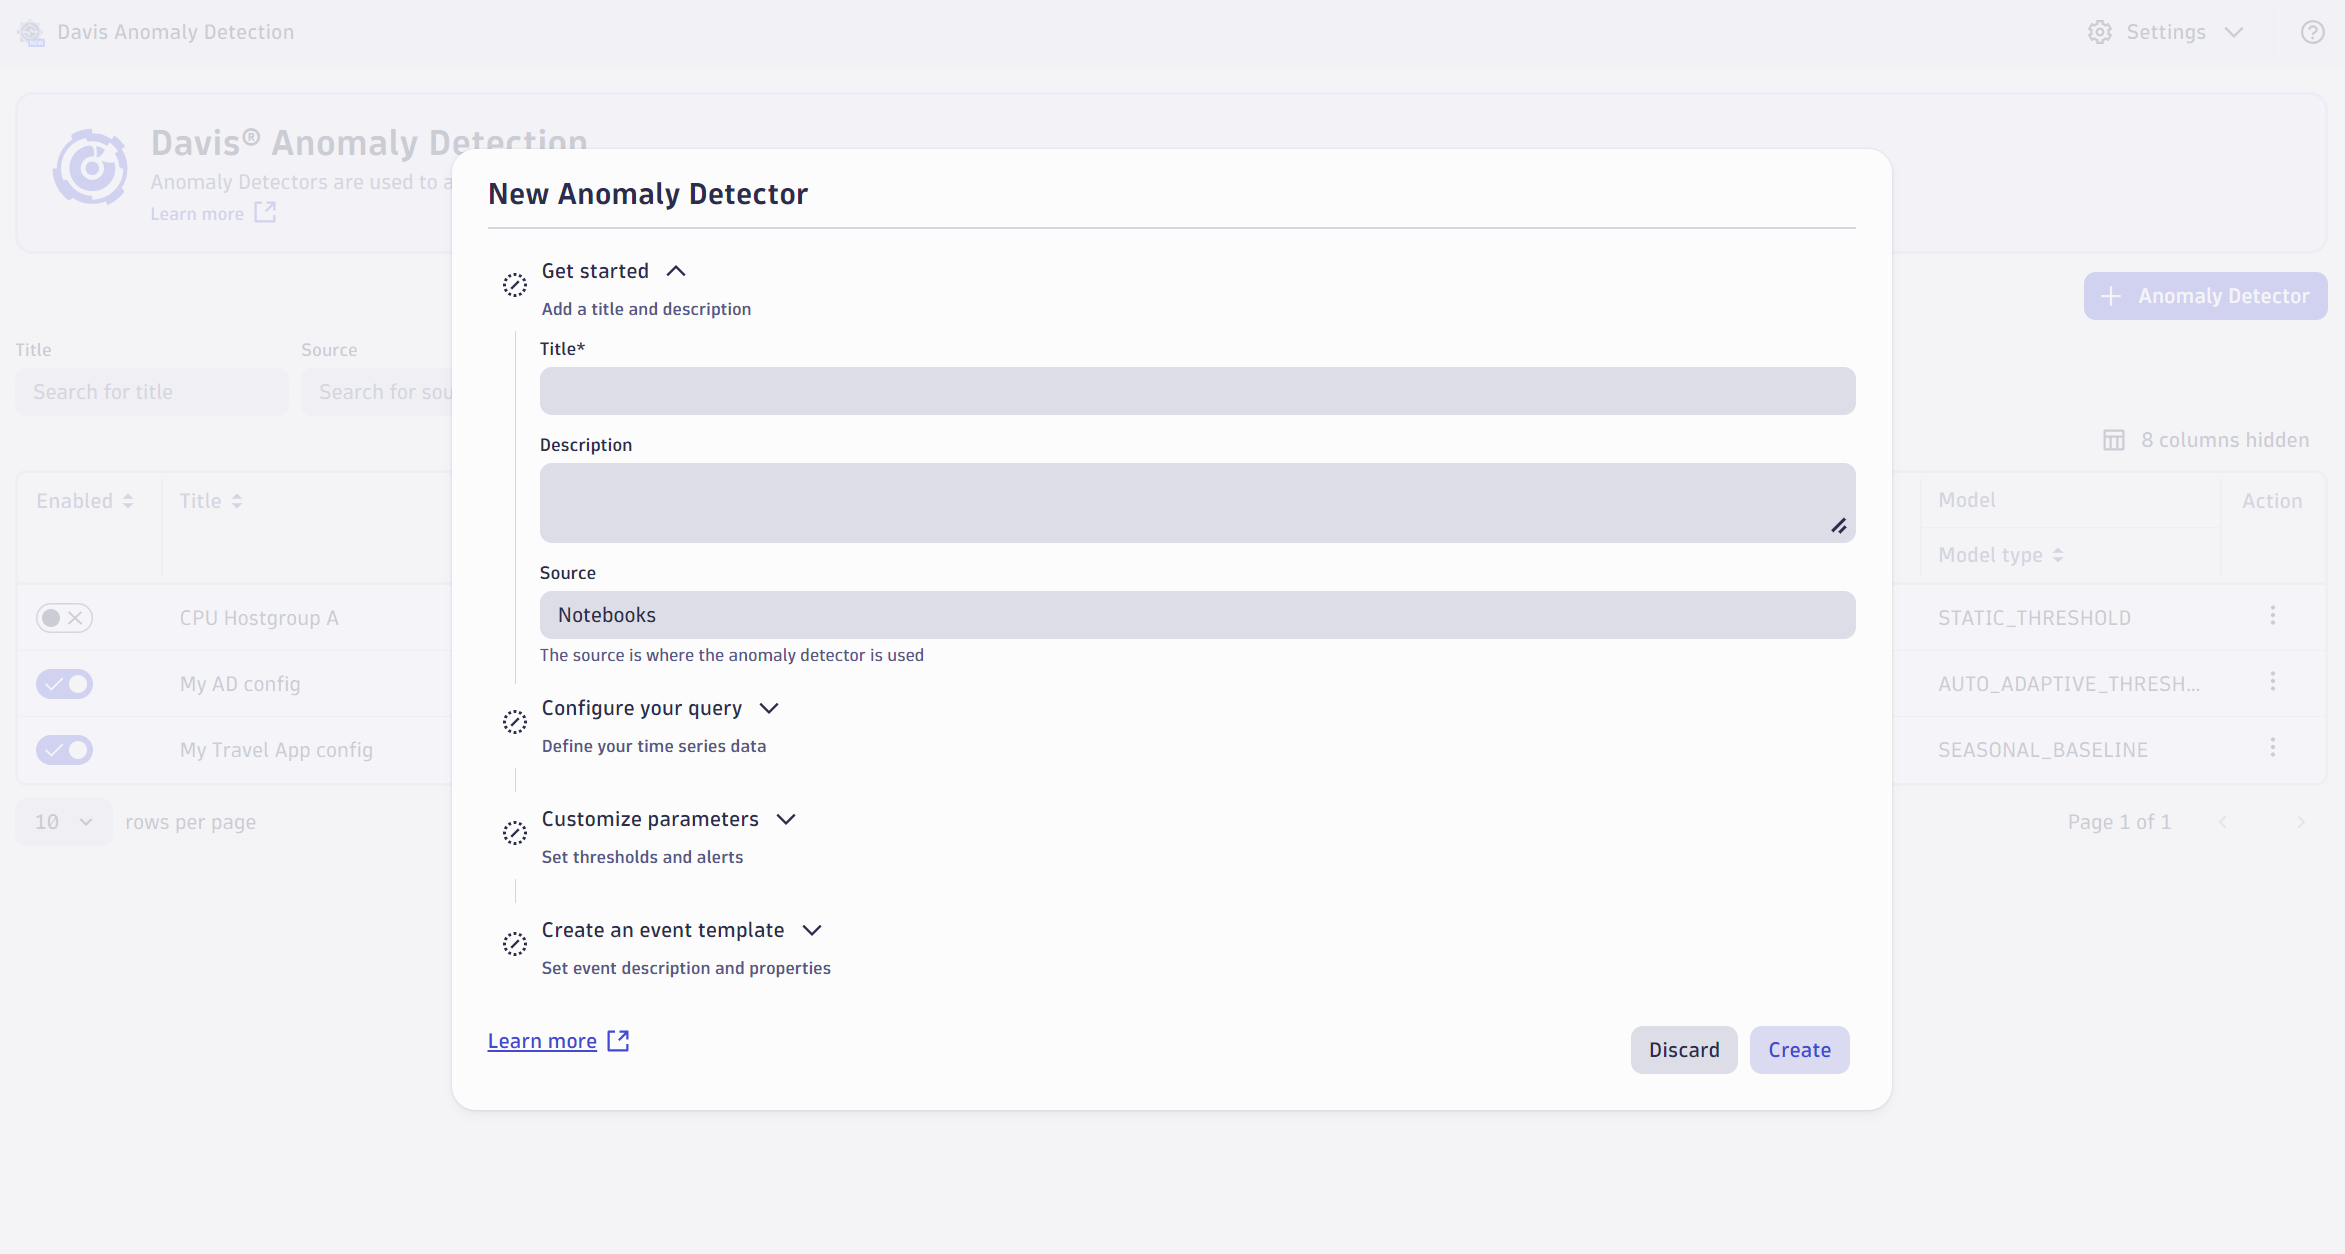
The new anomaly detector is created in four steps; the first two steps are carried over automatically from Notebooks. Let’s start with the most straightforward step, Get started, where you define a title for your anomaly detector and a description for the configuration.
The next two steps, as mentioned, have already been prefilled from Notebooks. In the Configure your query step, you’ll find the DQL query you predefined, and in the Customize parameters step, you’ll find your selected anomaly detection analyzer. The last significant step, the Create an event template step, remains. Here, you can define the template for your event and describe all essential information for the subsequent process.
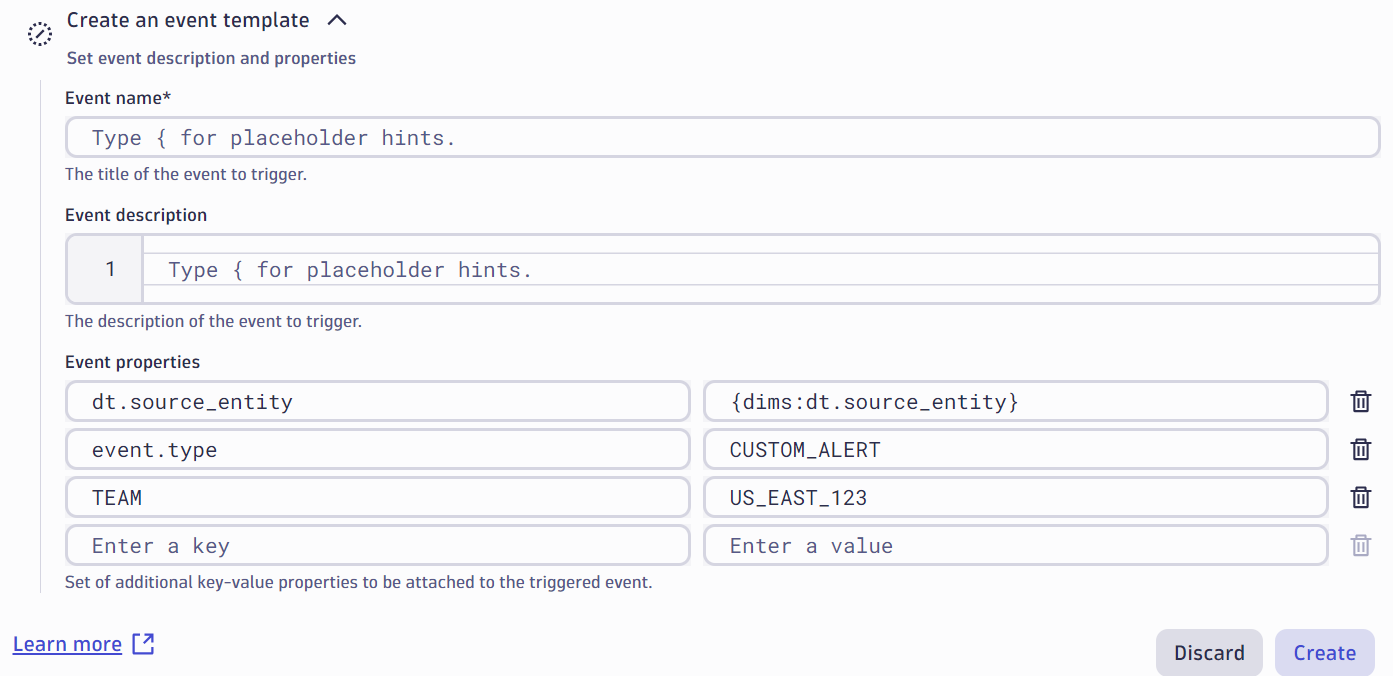
What makes this template exceptional is that you can use {placeholder} hints to add additional context to the text about the event. For example, the value of the violation or the source entity where the anomaly was detected. This ensures that all essential information about the event is immediately visible to the Site Reliability Engineer (SRE). After completing all four steps, we can create the Davis anomaly detector by selecting Create. The anomaly detector will automatically monitor your defined time series every minute and trigger your specified event upon detection of an anomaly.
The new anomaly detector is now listed in Davis Anomaly Detection. Here, you’ll find all anomaly detector configurations, and you can filter them according to your specific criteria. Additionally, you can expand this table with extra information about the configurations, such as when the anomaly detectors were last modified.
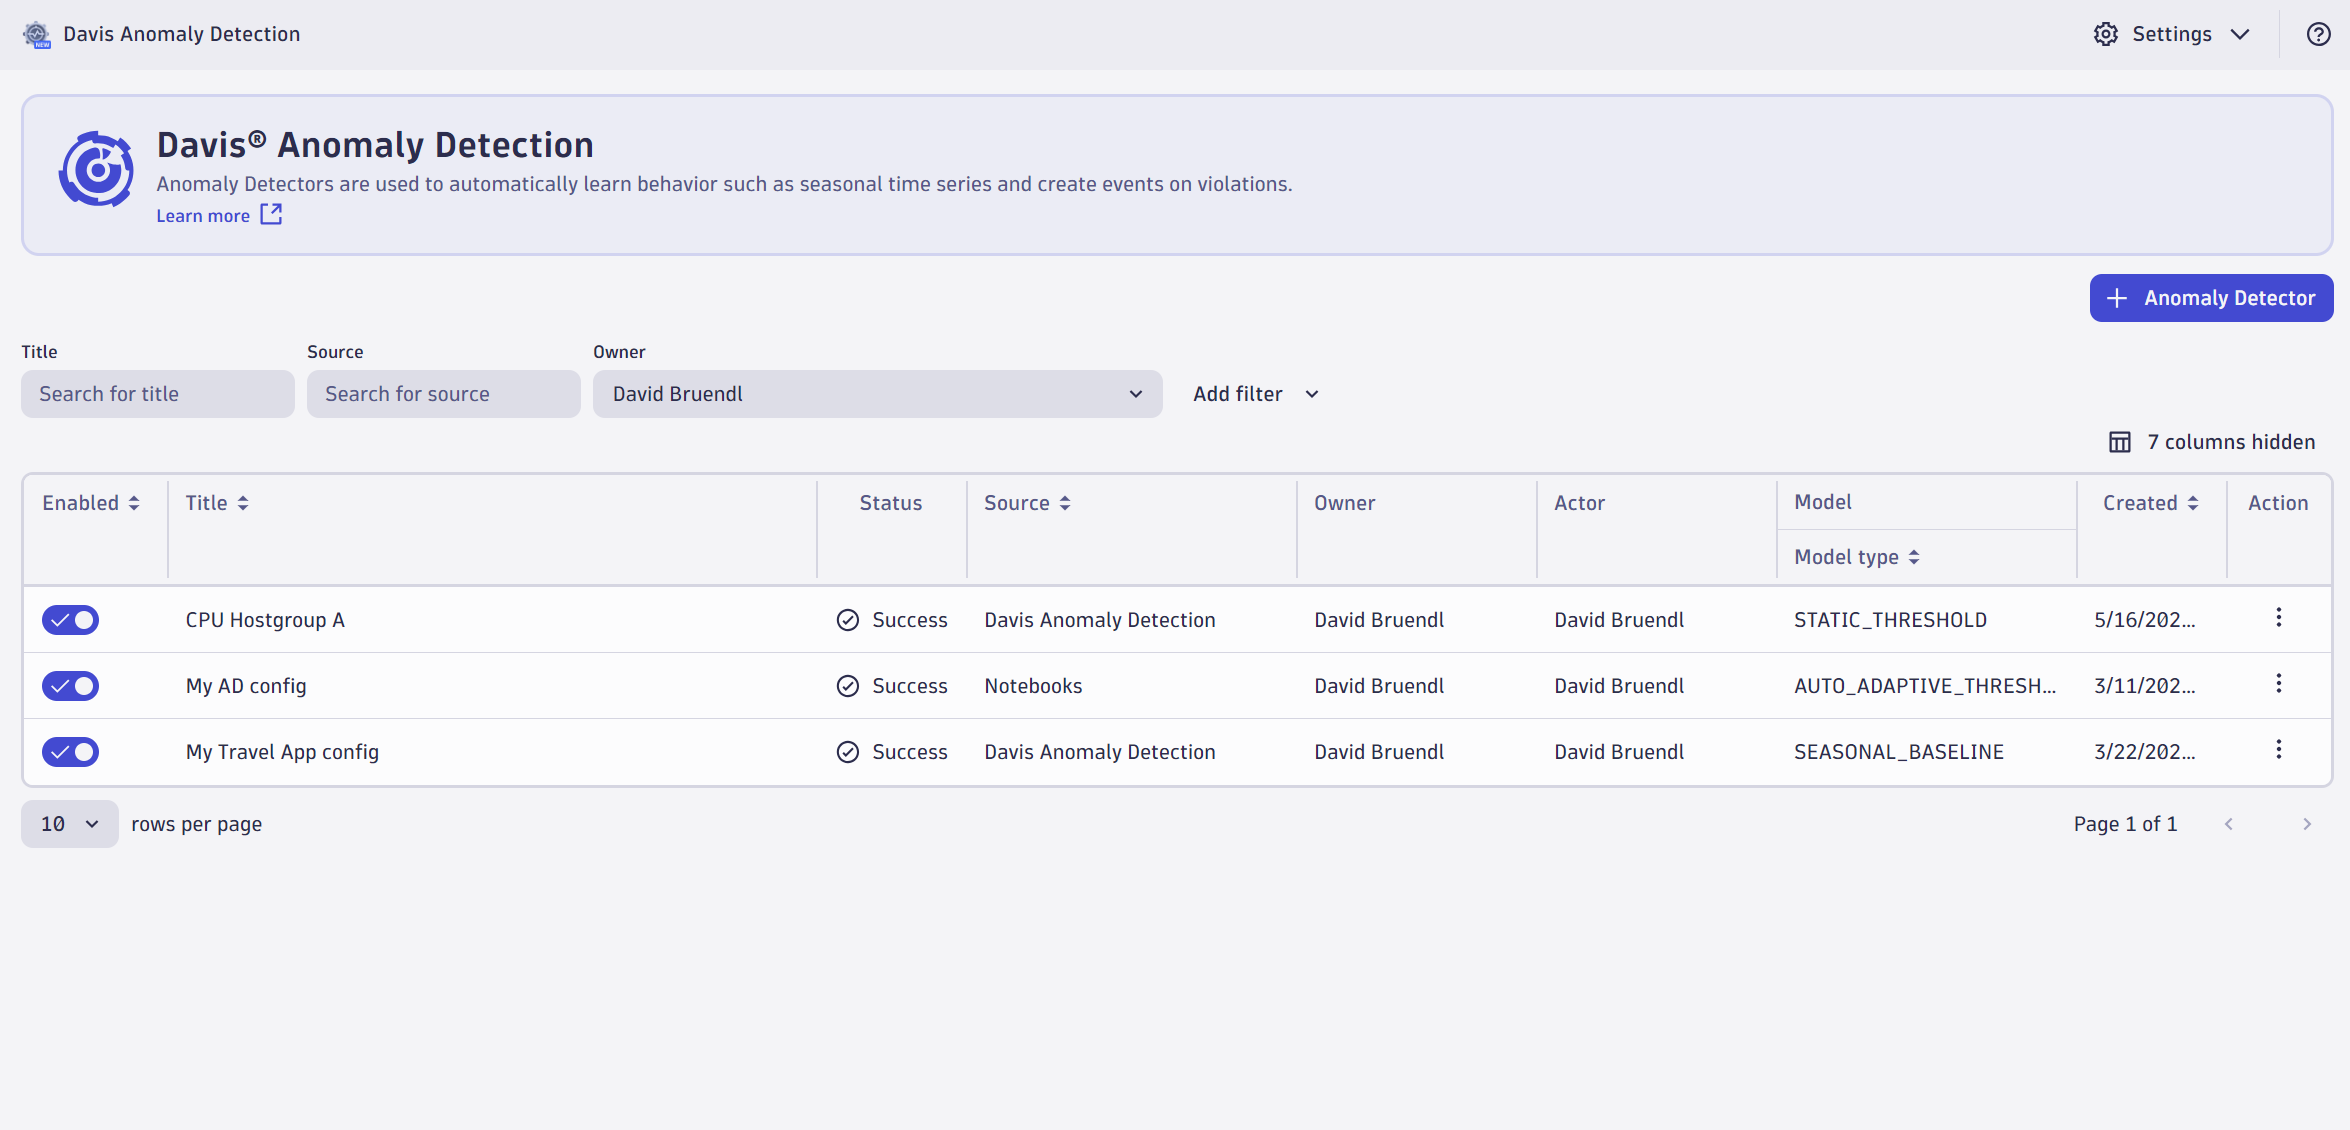
Of course, you always have the option to reopen an anomaly detector directly in Notebooks, where all configuration settings are carried over. You also have the option to display a preview of your anomaly detector directly in Davis Anomaly Detection.
The exciting challenge is finding answers to your everyday “why” questions using Grail and DQL analytics capabilities. If the answer is successfully identified in a time series and you want to automate the result with anomaly detection, this can be done in just a few steps. We recommend you explore the new Davis Anomaly Detection analyzer in Notebooks; we’re confident you’ll quickly discover its many uses.
Try out Davis Anomaly Detection
Want to know more? Check out the following video, in which Andreas Grabner and I collaborated on a new episode of the Dynatrace Observability Clinic. Here, we share a live introduction to Anomaly Detection based on DQL.
We also recommend watching the exciting use case for Anomaly Detection and the 5 Pillars of Data Observability.
What’s next
Davis Anomaly Detection is automatically enabled for all Dynatrace SaaS environments with the release of Dynatrace version 1.291. No effort is needed from your side. We’re, of course, highly interested in your feedback. So, please head to the Dynatrace Community and share your suggestions and product ideas to help us continuously improve Dynatrace Anomaly Detection.
Are you interested in learning more? In Dynatrace Documentation, you can learn more about Davis Anomaly Detection and how to use anomaly detection within Notebooks, or look at our Playground, where you can explore practical examples of how to utilize Davis AI Analyzer in your anomaly detection.


Looking for answers?
Start a new discussion or ask for help in our Q&A forum.
Go to forum