
Dynatrace has long provided code-level visibility for Java, .NET, and PHP. Code-level visibility is now also available for Node.js services! You can use Dynatrace to access Node.js code-level insights in several different ways.
Global CPU profiler
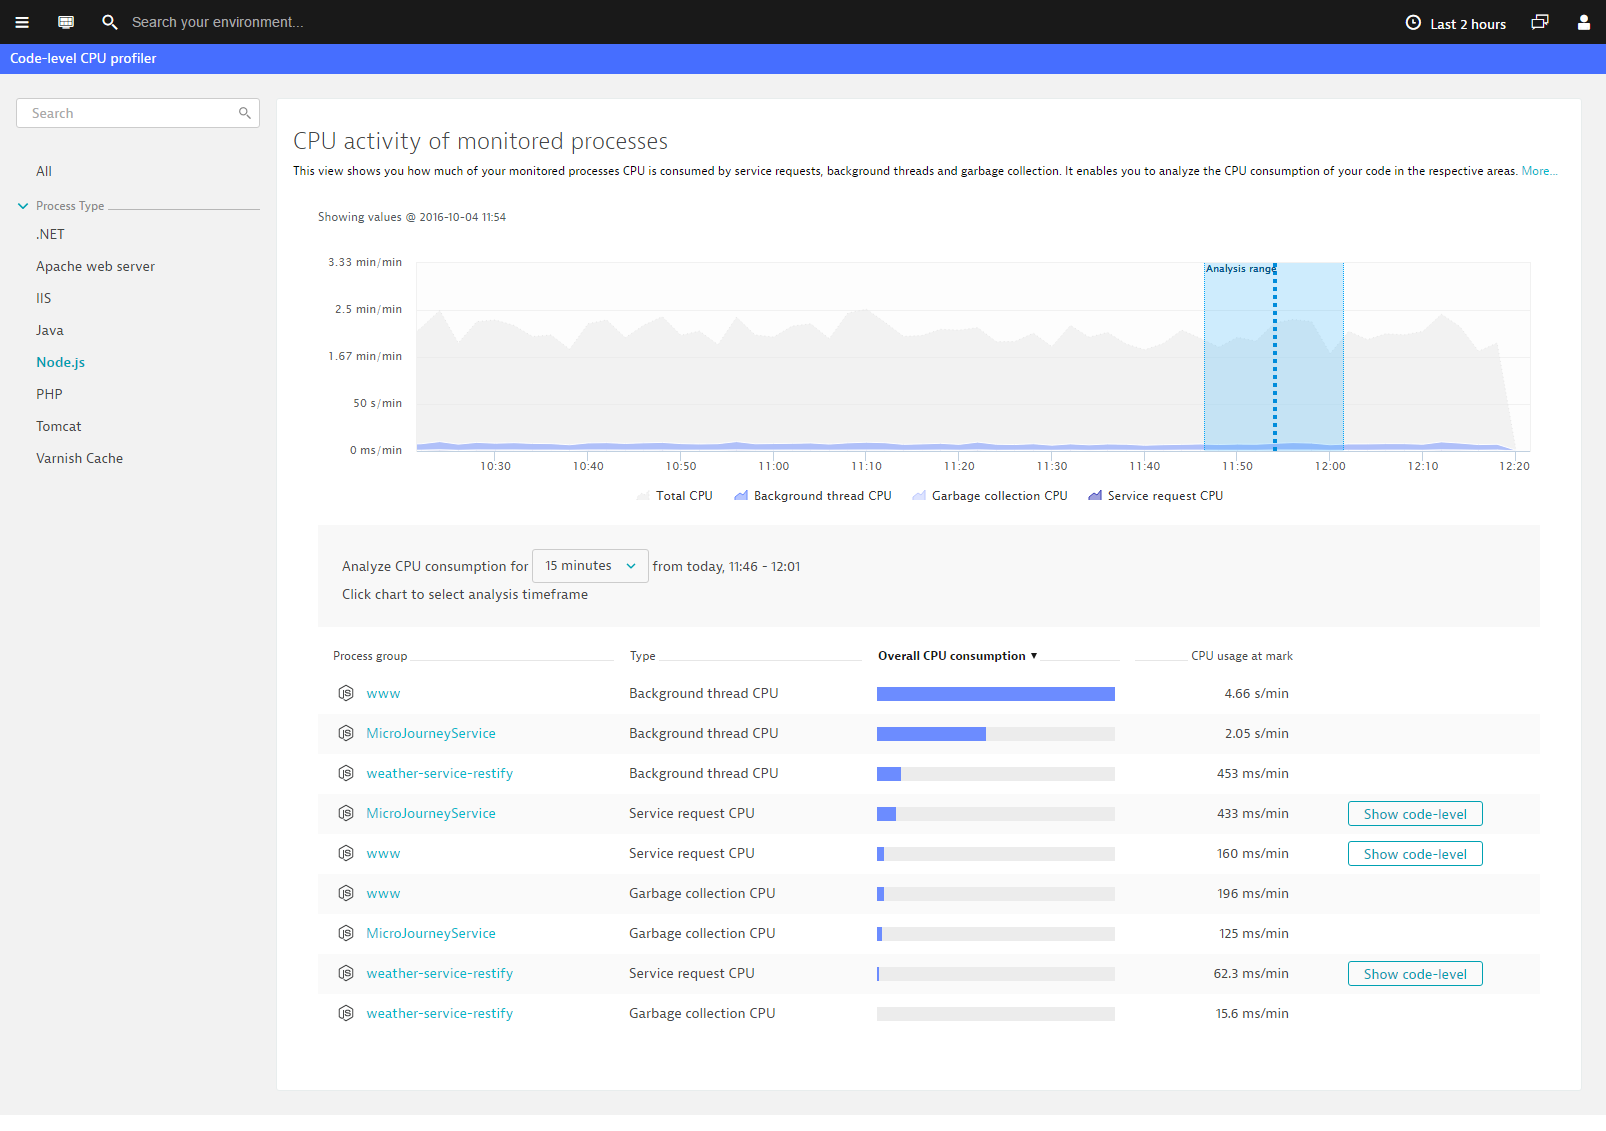
The environment-wide CPU profiler view shows the CPU activity of all monitored processes down to the code level, enabling you to profile the CPU consumption of each individual process, process group, service.
- Click CPU profiler (code-level) in the navigation menu.
- In the Process group list, click the Show code-level button of the process group you want to analyze.
The Hotspots page provides a profile view of all the processes within the analyzed process group.
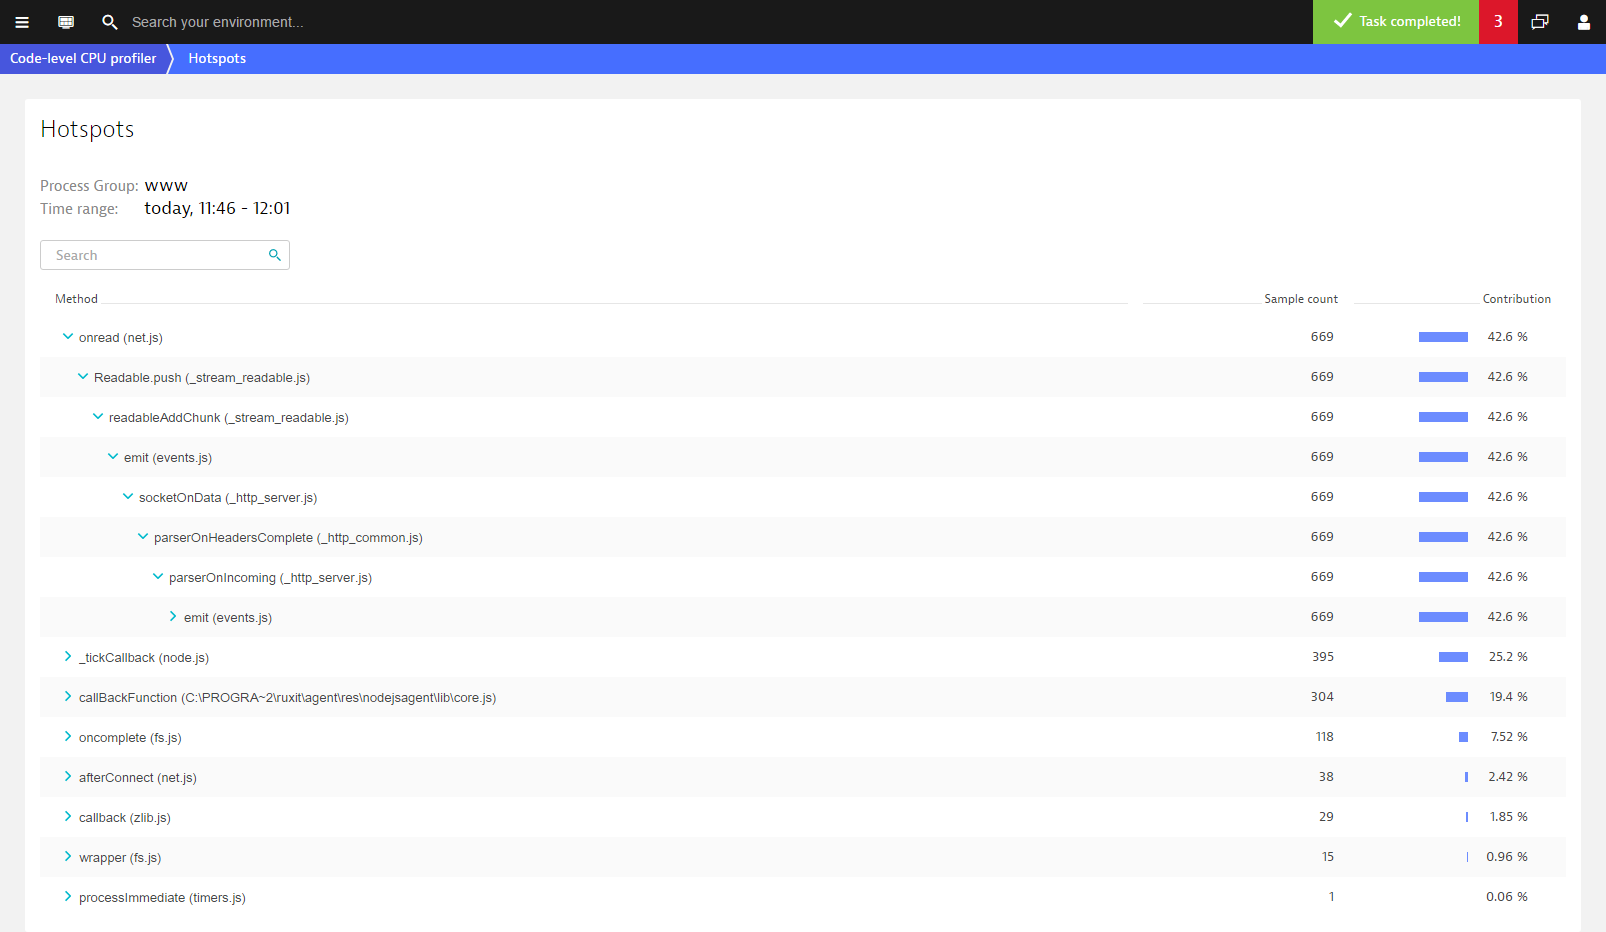
To view a single process, click a process group name in the list. You’ll then see a list of the processes that are part of the group, along with their individual contributions.
Currently, you can profile the CPU consumption of all monitored Node.js services within a process group. For other process types (for example, Java and .NET), Dynatrace additionally enables you to profile the CPU consumption of background threads as well. Background thread profiling will be extended to Node.js monitoring in an upcoming release.
Analyze CPU consumption of a single service or request type
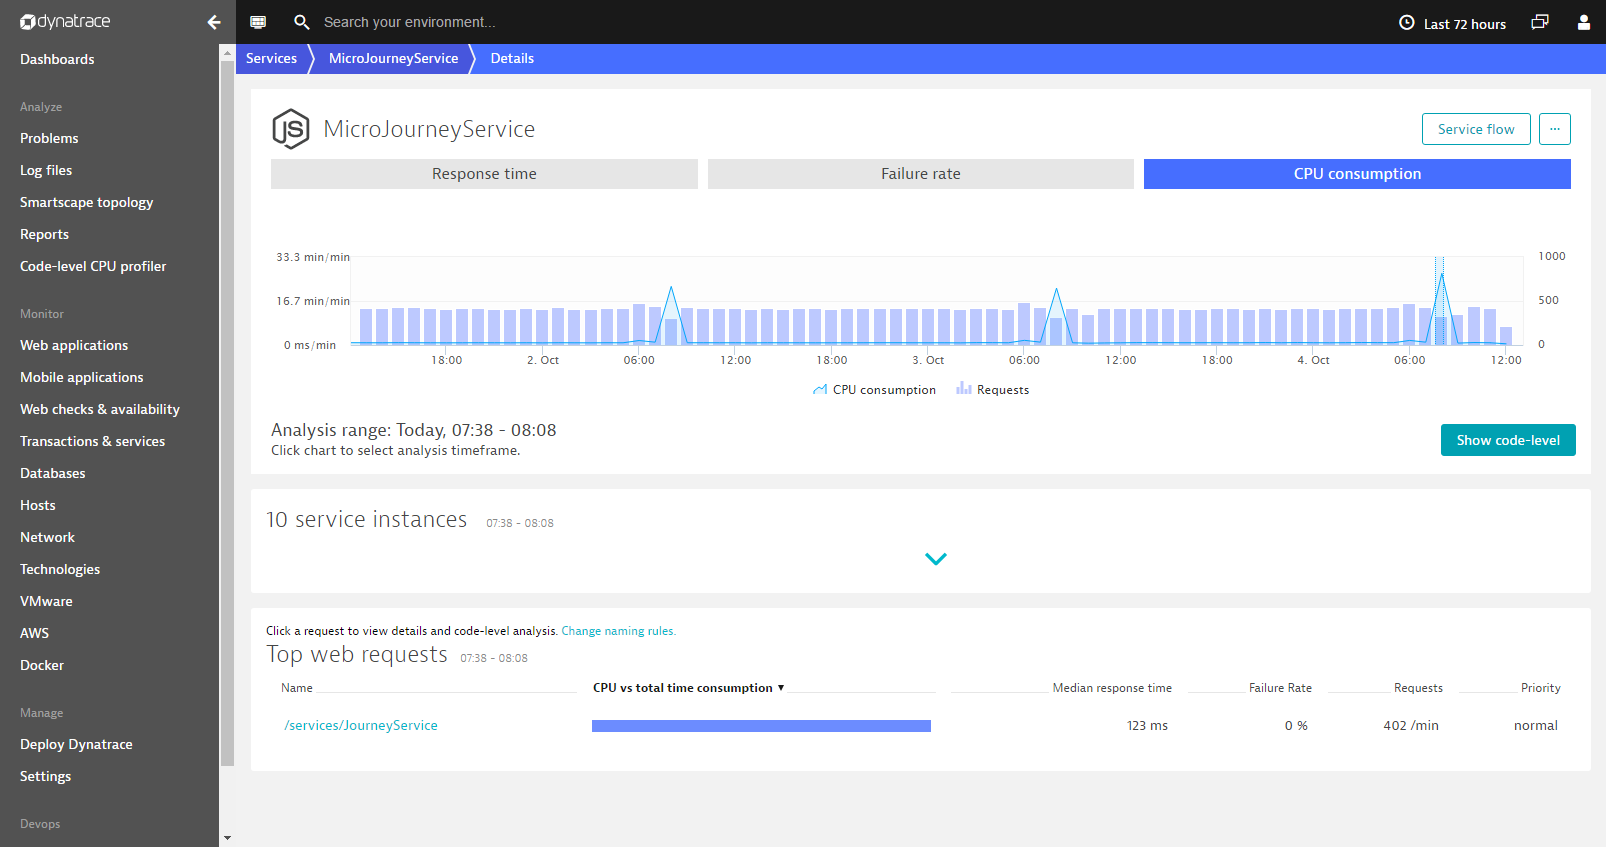
For those situations where you aren’t interested in the CPU consumption of a process group or process, but rather the CPU consumption of a specific service or even a specific type of request, simply select the service you’re interested in. You’ll find the Show code-level button for the selected service beneath the CPU consumption chart (this applies to both entire services and specific requests).
- Select Transactions & services from the navigation menu.
- Select the service you want to analyze.
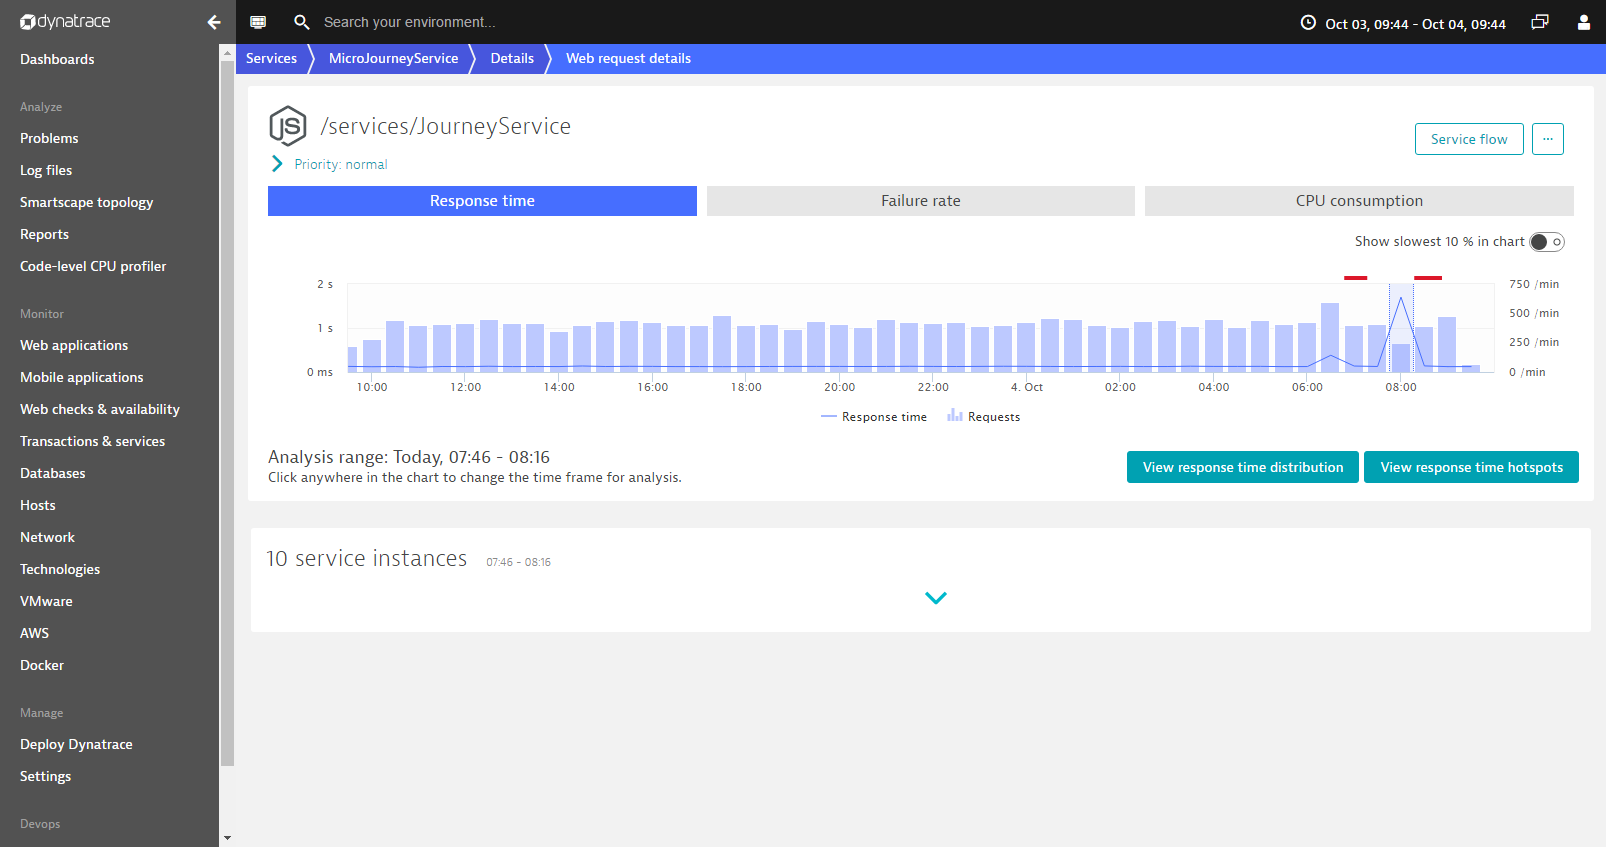
- Once on the Service page, click the Details button.
- Select the CPU consumption tab.
- Click the Show code level button.
Accessing code-level CPU-consumption analysis works the same for entire services (as shown above) as it does for individual web requests (as shown below).
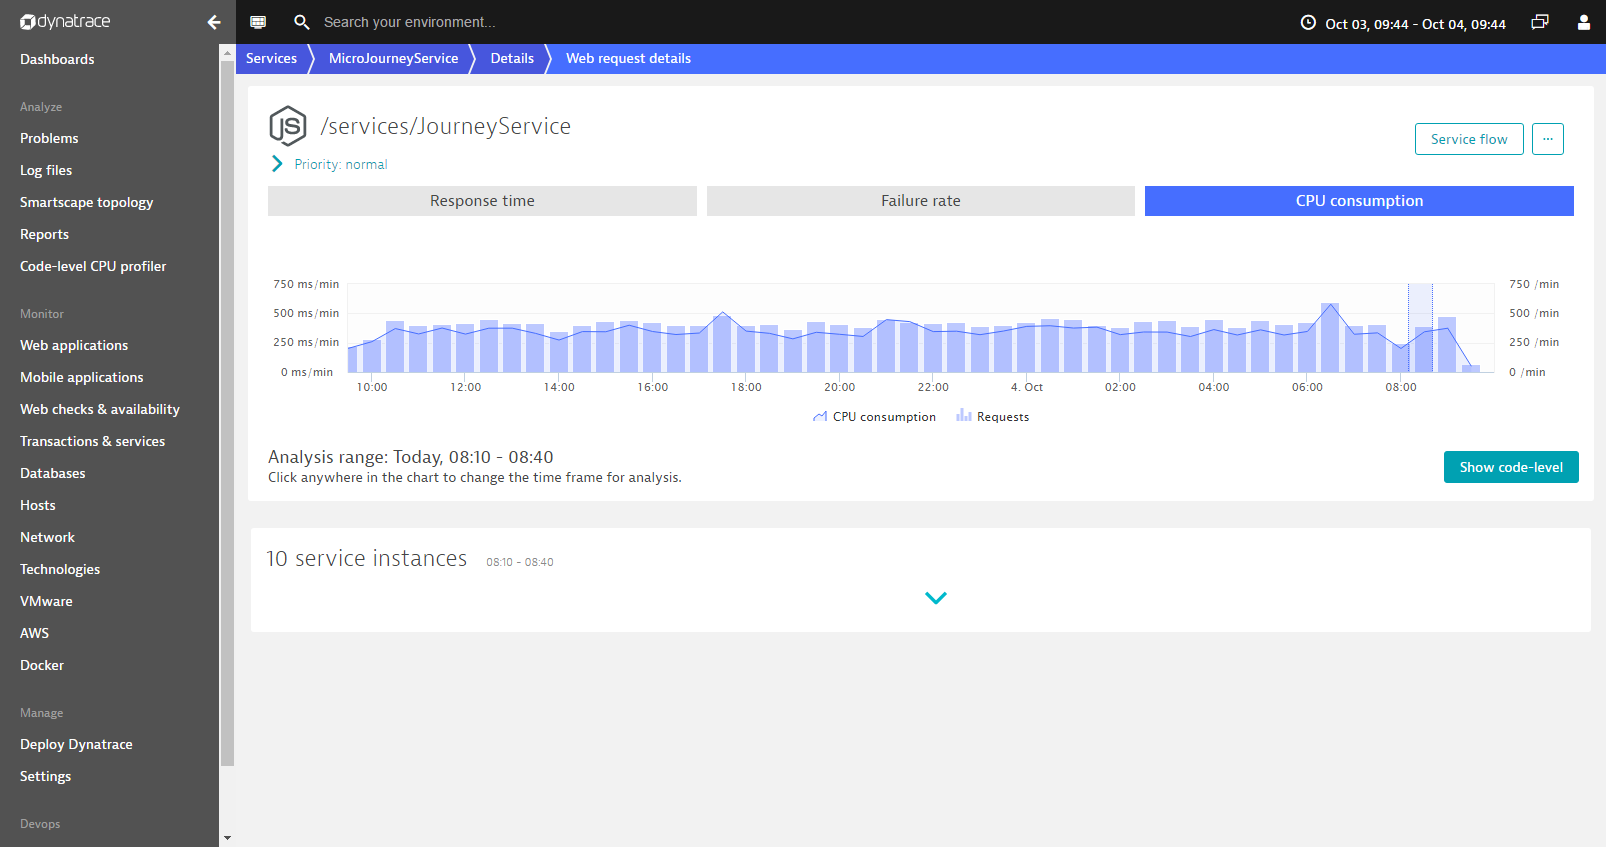
The resulting hotspot tree represents all requests within the selected time frame.
Understand how your code impacts response time
Understanding how your code affects the response time of your service requests enables you to make code-level improvements that improve customer experience.
To view response-time hotspots of a service at the code level
- Select Transactions & services from the navigation menu.
- Select the service you want to analyze.
- Once on the Service page, click the Details button.
Alternatively, you can select a specific request for analysis. - Click the View response time hotspots button.
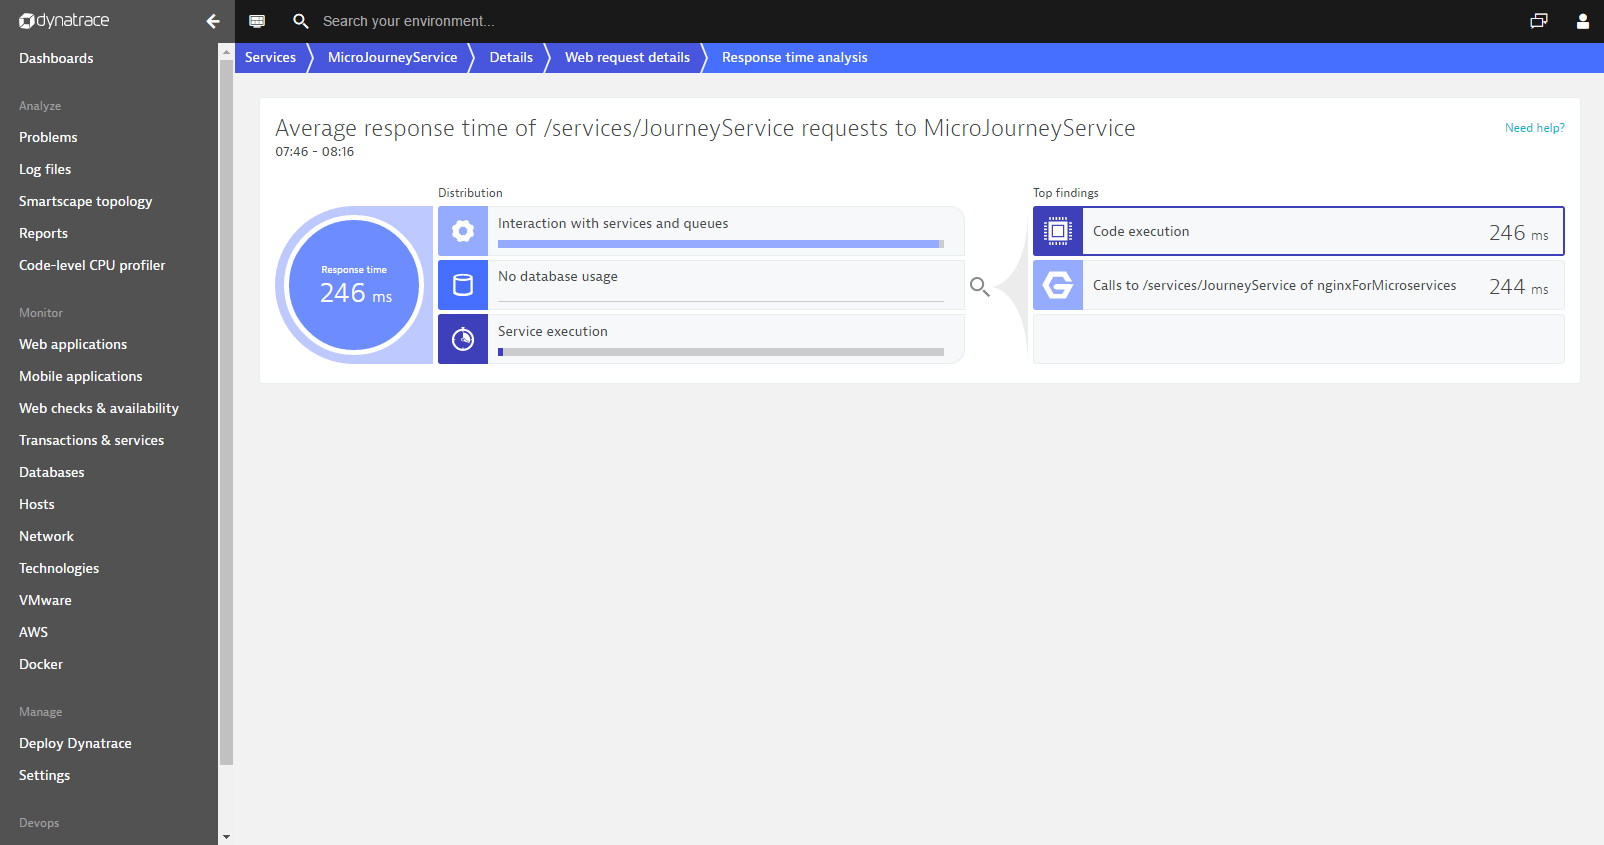
Response time analysis shows you where a service’s requests consume the most time. If response time hotspots are detected within the analyzed service or request, you’ll see a Code execution entry in the Top findings portion of the infographic. In this example, JavaScript Code execution has been identified as the biggest contributor to response time. - Click Code execution to view the analysis.
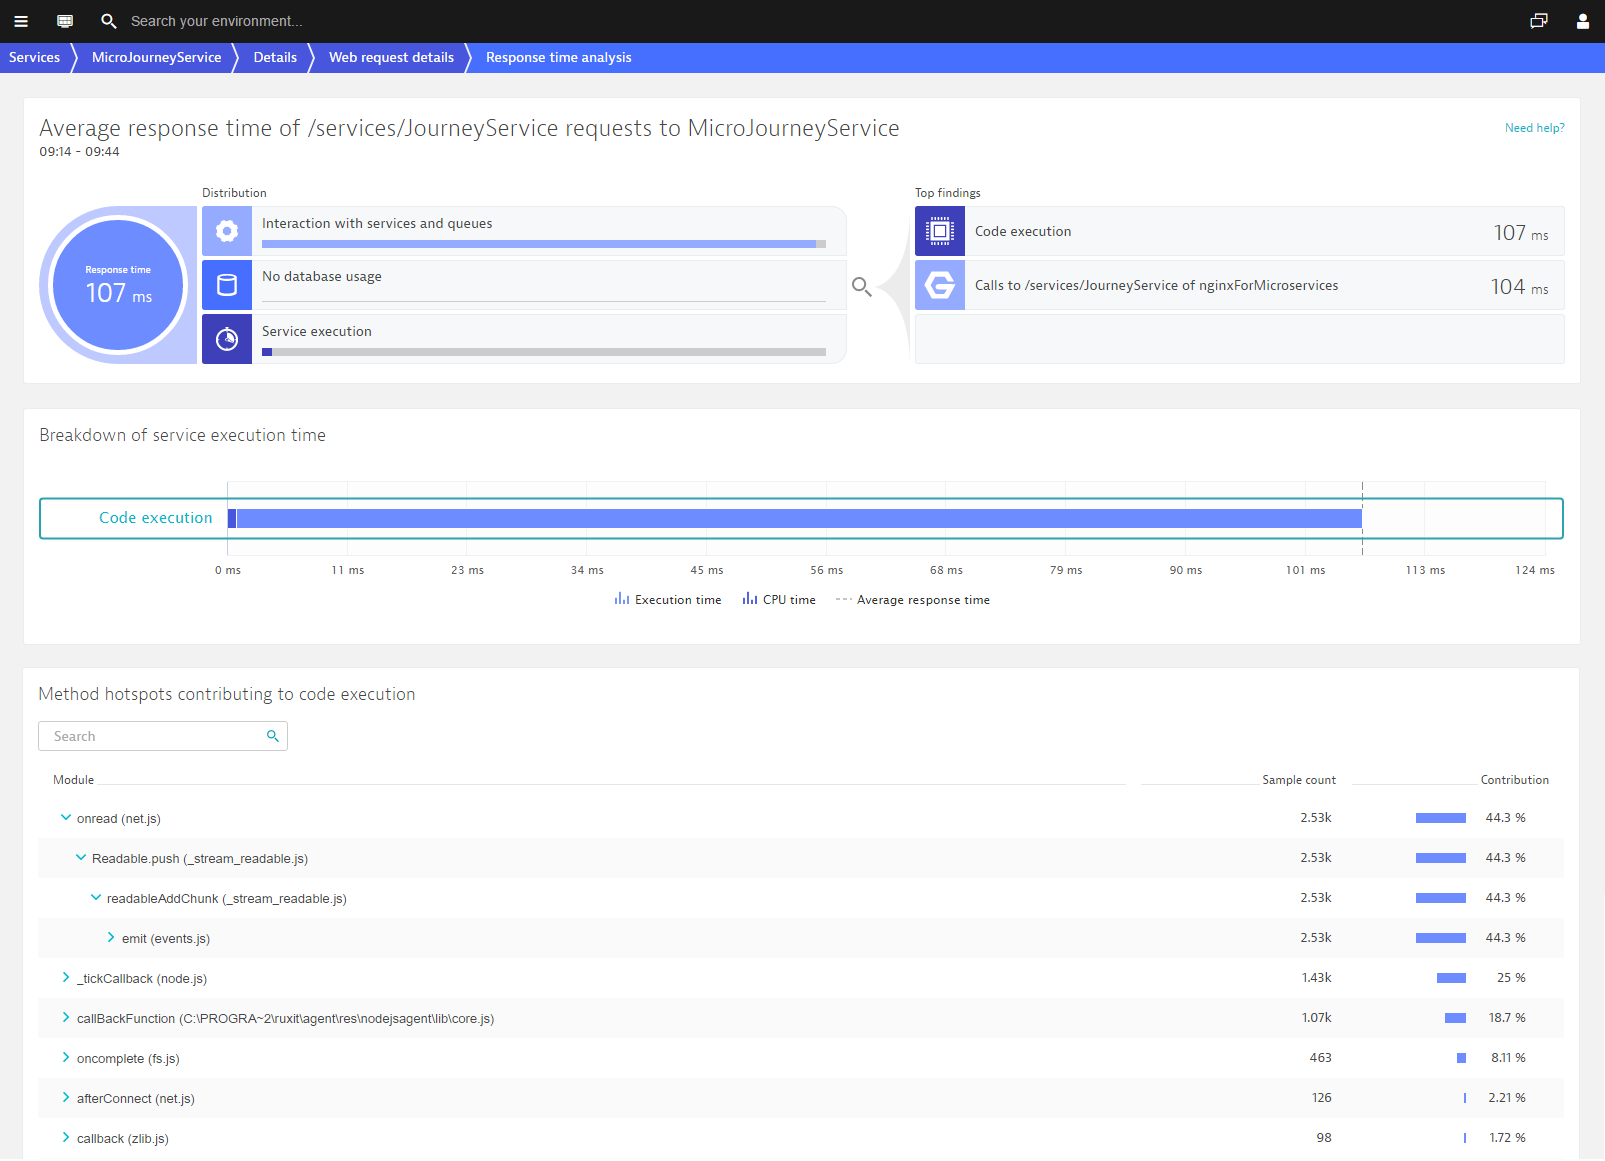
Now you can analyze the response time of the code that’s executed by the analyzed request.
Learn more about Node.js monitoring
Visit our dedicated webpage about Node.js monitoring to learn more about how Dynatrace supports Node.js.


Looking for answers?
Start a new discussion or ask for help in our Q&A forum.
Go to forum