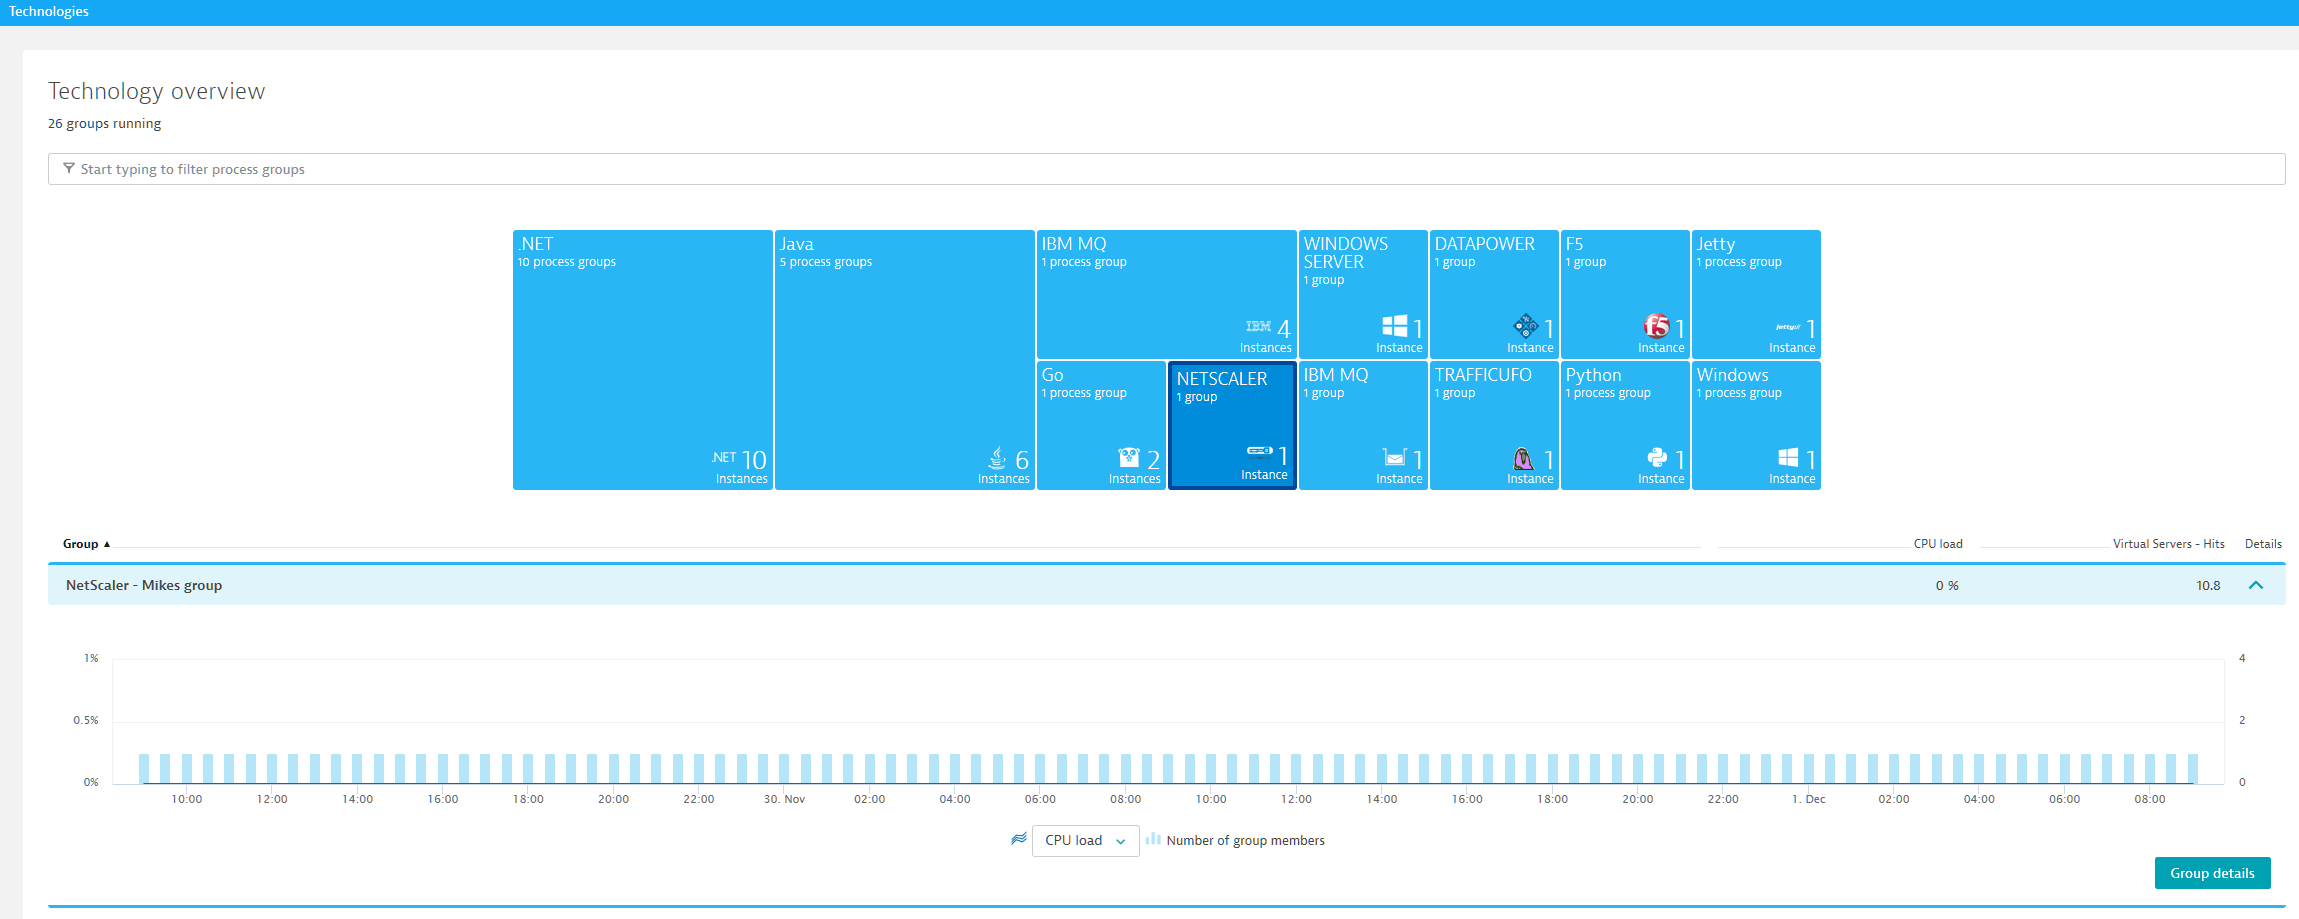
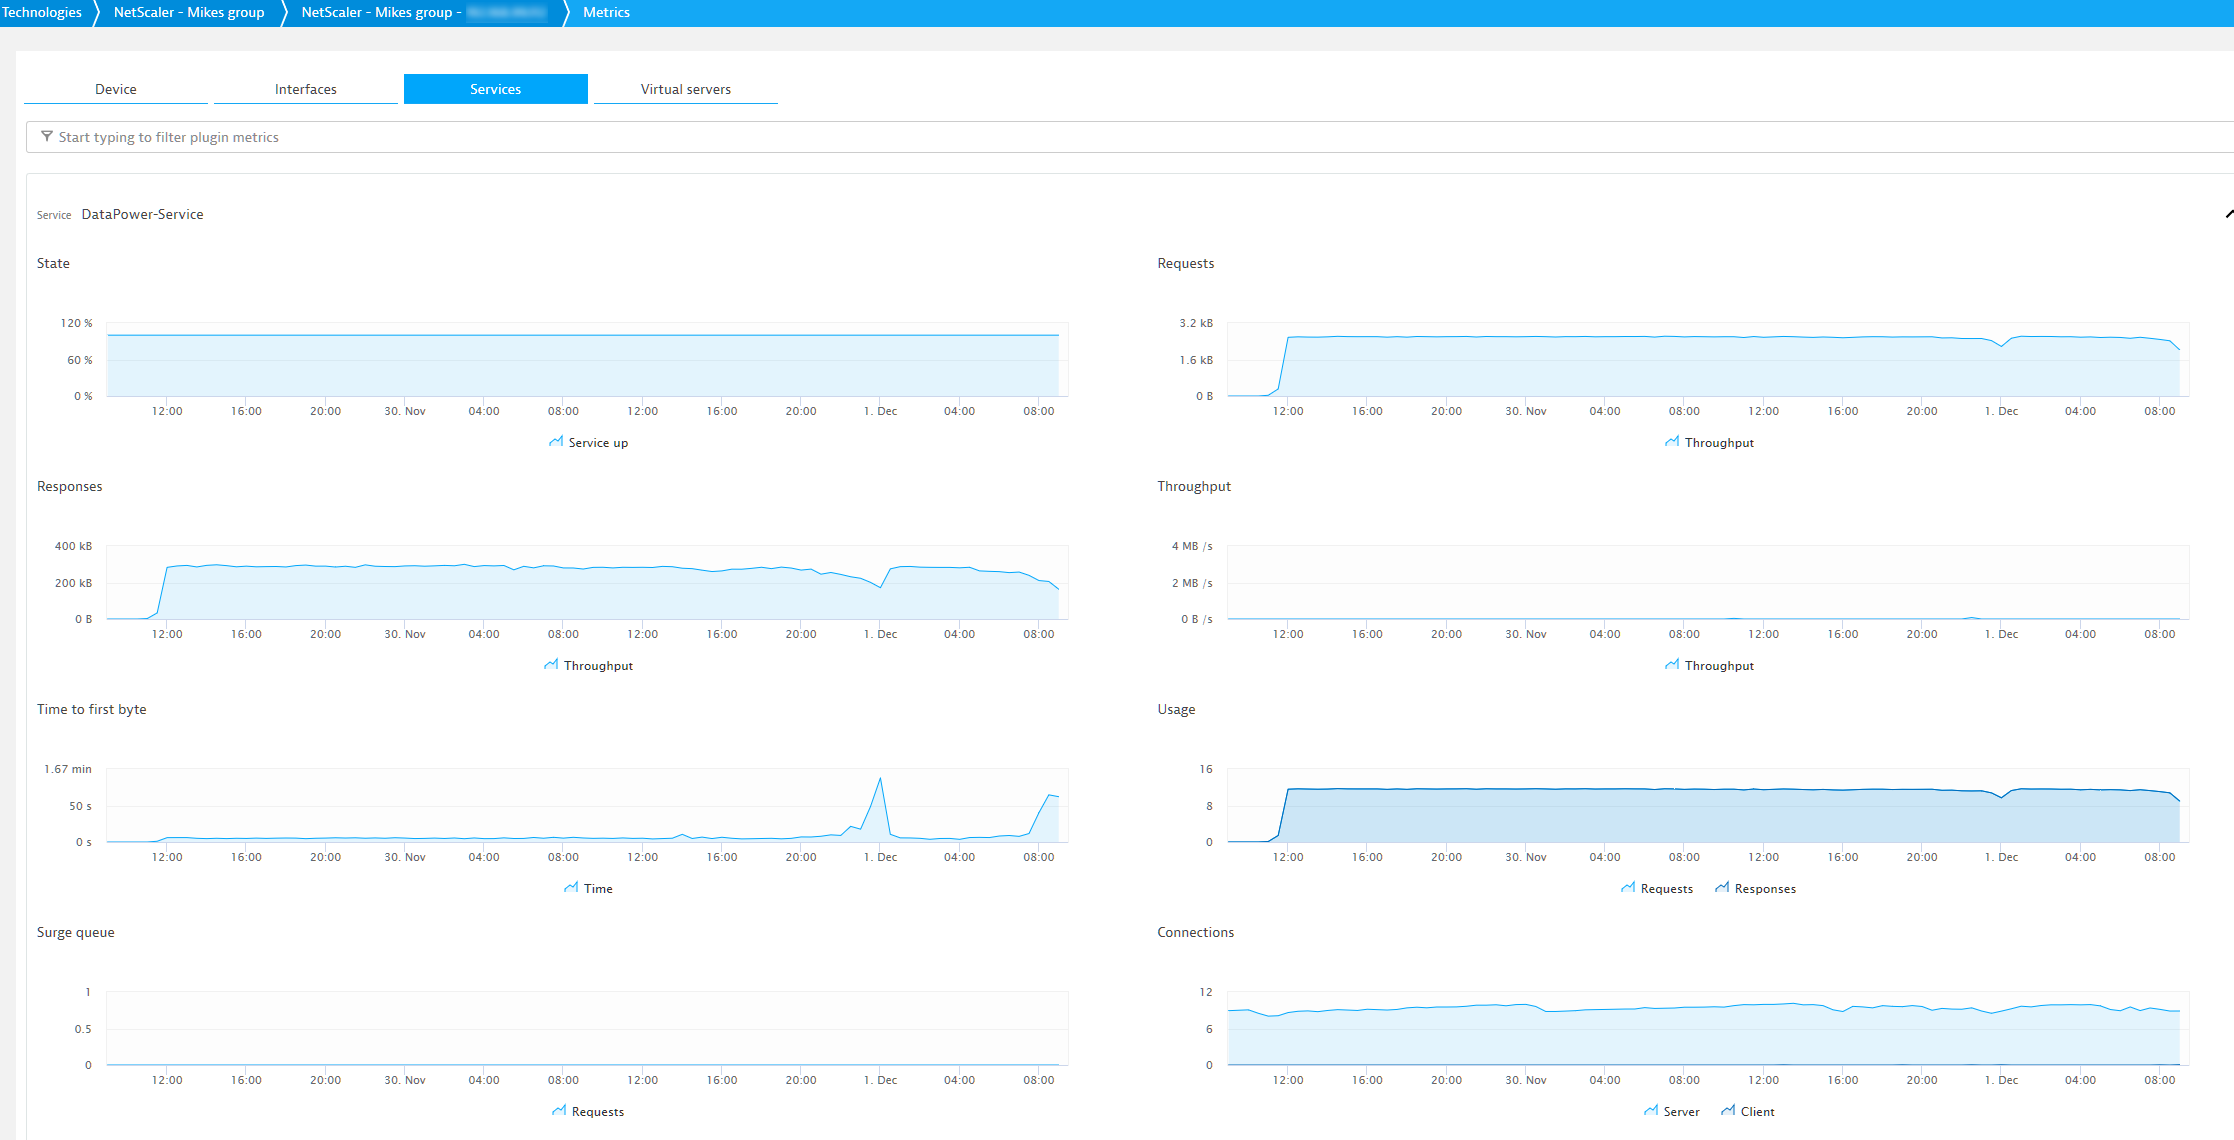
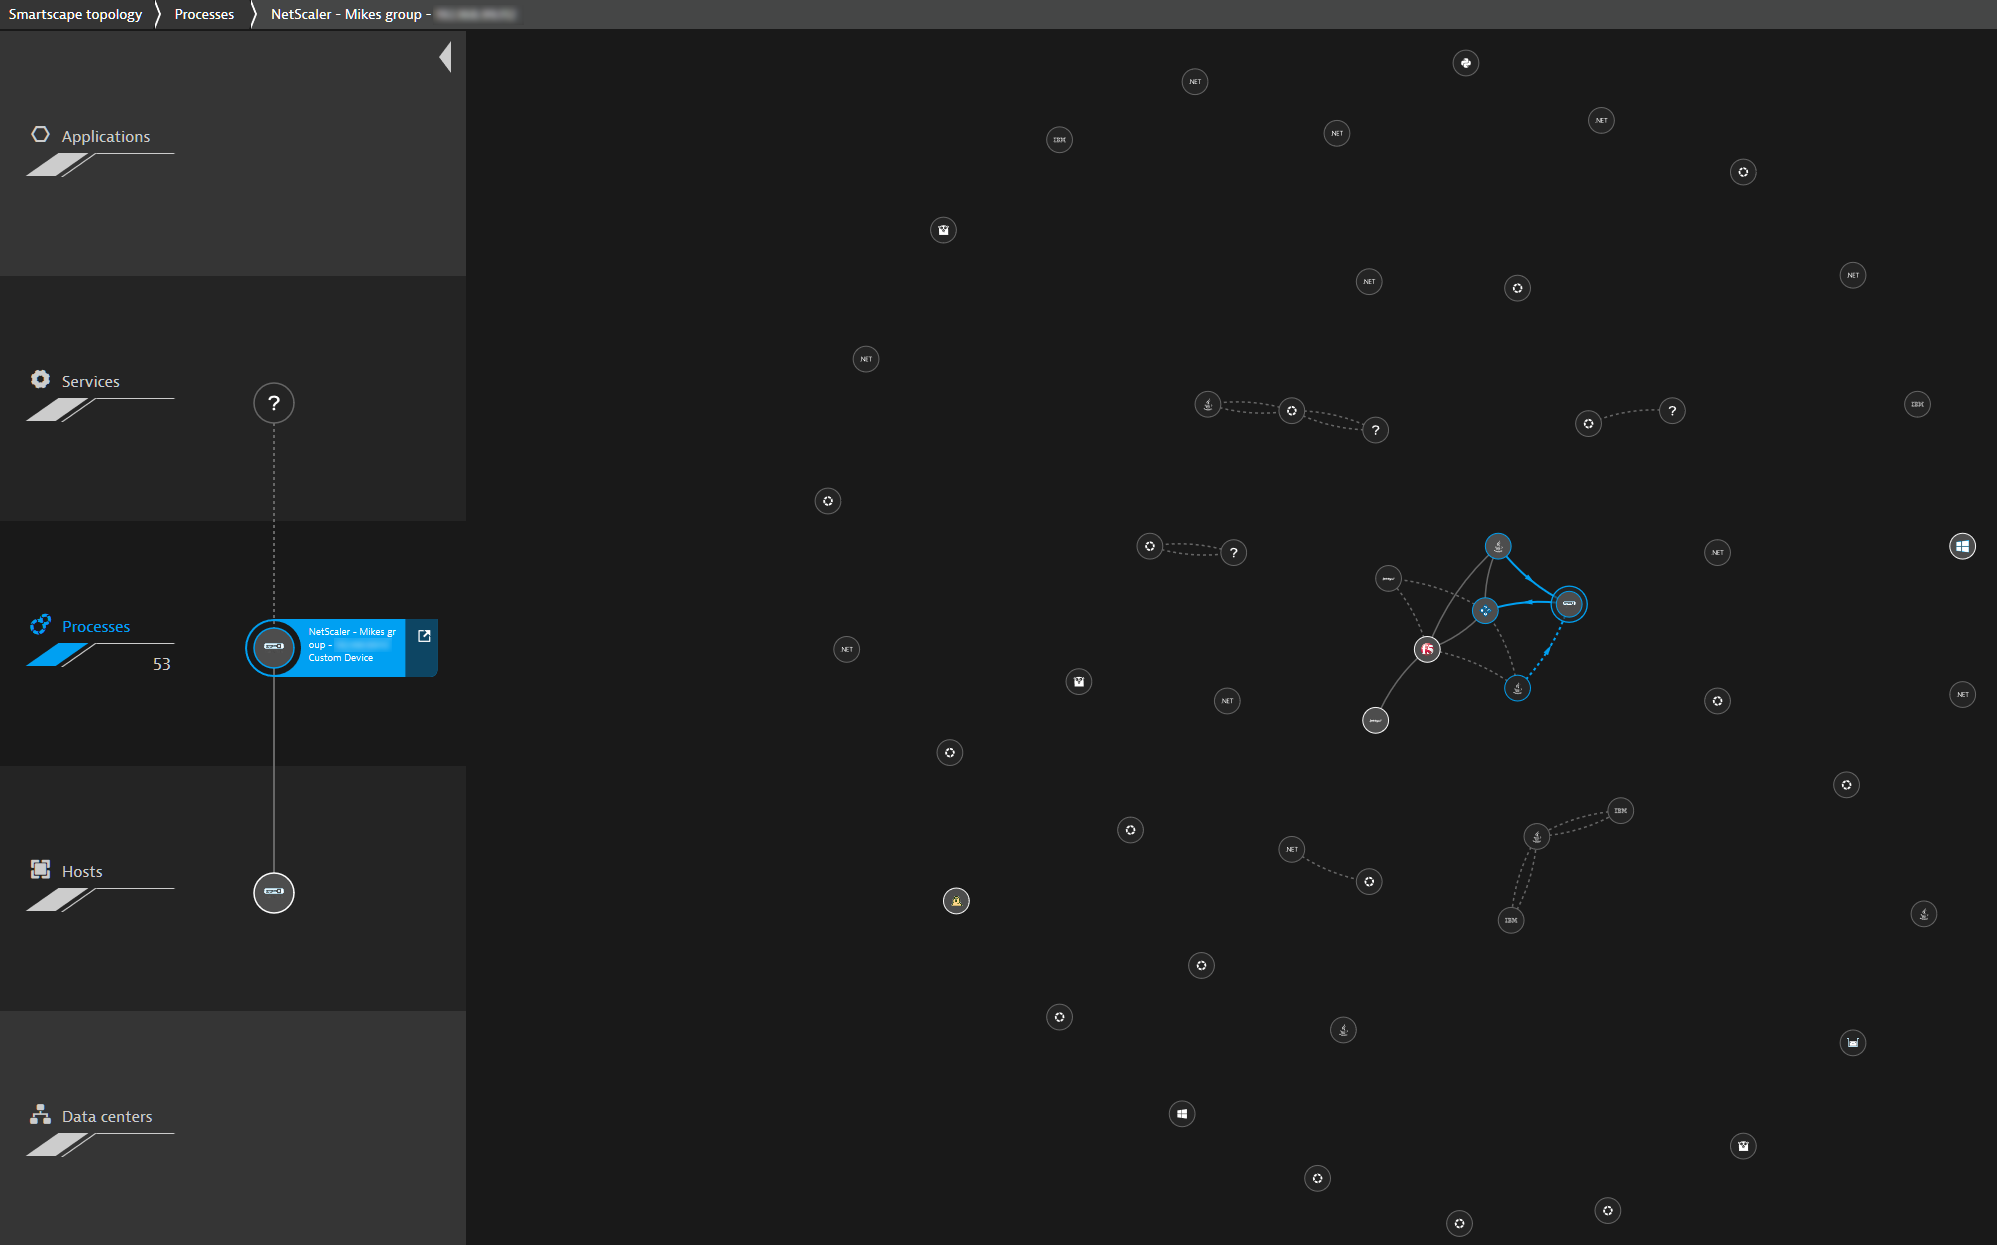
Dynatrace is continuously working to expand our monitoring coverage to include critical components within our customers’ technology stacks. The challenge with monitoring security-related technologies such as Citrix ADC devices is their inhospitality to agent-based monitoring approaches. Remote monitoring via the ActiveGate plugin framework is one of the avenues available for increasing our coverage. Today, we are pleased to announce that the Citrix (formerly NetScaler) ADC ActiveGate extension is available in an EAP. Through this extension, you can monitor the health and performance of your Citrix ADC instances without installing OneAgent.

Prerequisites
- Dynatrace cluster version 1.156+
- ActiveGate 1.155+
- Citrix (NetScaler) ADC device(s) running version 10.5+ with support for Nitro REST API
What you get
After deploying the extension from your ActiveGate, every 60 seconds this extension remotely queries the Citrix ADC instance key metrics, events, and properties related to overall system, virtual server, service, and network health and performance.
The data ingested through the extension enables Dynatrace to provide you with real-time insight into the performance of your Windows hosts, using the same UI as natively monitored technologies:
- Automatically generated visualization tools, dashboards, infographics, and reports
- A single and actionable notification (no alert storms)
- Metric anomaly-based root-cause analysis through AI 2.0 (coming soon)
The following metrics are returned by the Citrix ADC ActiveGate extension and ingested by the Dynatrace cluster:
Virtual servers (split by virtual server name)
- State is OK %
- Hits
- Requests
- Responses
- Server connections
- Client connections
- Services with state OK %
- Request bytes received
- Response bytes received
- Invalid requests/responses
- Invalid requests/responses dropped
- Diversions to backup virtual server
- Apdex measured satisfied/tolerating/frustrated requests
- Active services
- Requests in the surge queue
- (Event) State is not OK
- (Correlation) IP/Port
System
- CPU/Management CPU/Packet Engines CPU usage %
- Resident CPU usage %
- Memory used/utilization %
- (Parameter) Allocated memory
- (Parameter) CPU count
- (Parameter) Start time
Services (split by service name)
- State is OK %
- Throughput
- Average time to first byte
- Requests/Responses
- Request/Response bytes
- Requests in surge queue
- Server/Client connections
- Apdex measured satisfied/tolerating/frustrated requests
- (Event) State is not OK
Network (split by interface ID)
- State is UP %
- Bytes received/transmitted
- Out/Inbound packet errors
- Out/Inbound packets discarded/dropped
- (Event) State is not UP
Compression
- HTTP/TCP compression ratio
Interested in participating in the EAP?
If you’re interested in joining the EAP, and your environment meets the requirements, please complete the enrollment form.
For additional information about the EAP, please email the Platform Extensions team.


Looking for answers?
Start a new discussion or ask for help in our Q&A forum.
Go to forum