With Dynatrace version 1.198, we've dramatically improved CPU analysis, allowing you to easily understand CPU consumption over time, in the context of your workloads.
Analyzing and optimizing CPU consumption has always been an important concern. With the rise of cloud computing, it’s now more important than ever. While in classic bare-metal stacks CPU resources are made “available” through over-provisioning, in modern SaaS environments you only pay for those CPU resources that you use—no over-provisioning of resources is required. The benefit of this is that optimizing the CPU usage of your workloads now pays off almost immediately in the form of reduced cloud computing costs.
We’re happy to announce that with Dynatrace version 1.198, we’ve dramatically improved CPU analysis, allowing you to easily understand CPU consumption over time, in the context of your workloads. This means that you can now identify the exact workloads much earlier for which CPU optimization will return the highest value.
Fully automated code-level visibility
Apart from its best-in-class observability capabilities like distributed traces, metrics, and logs, Dynatrace OneAgent additionally provides automatic deep code-level insights for Java, .NET, Node.js, PHP, and Golang, without the need to change any application code or configuration. This allows you to identify CPU-intensive applications and find actionable insights into how source code can be optimized to reduce the CPU footprint of specific applications.
Easily identify and analyze your most impacting workloads
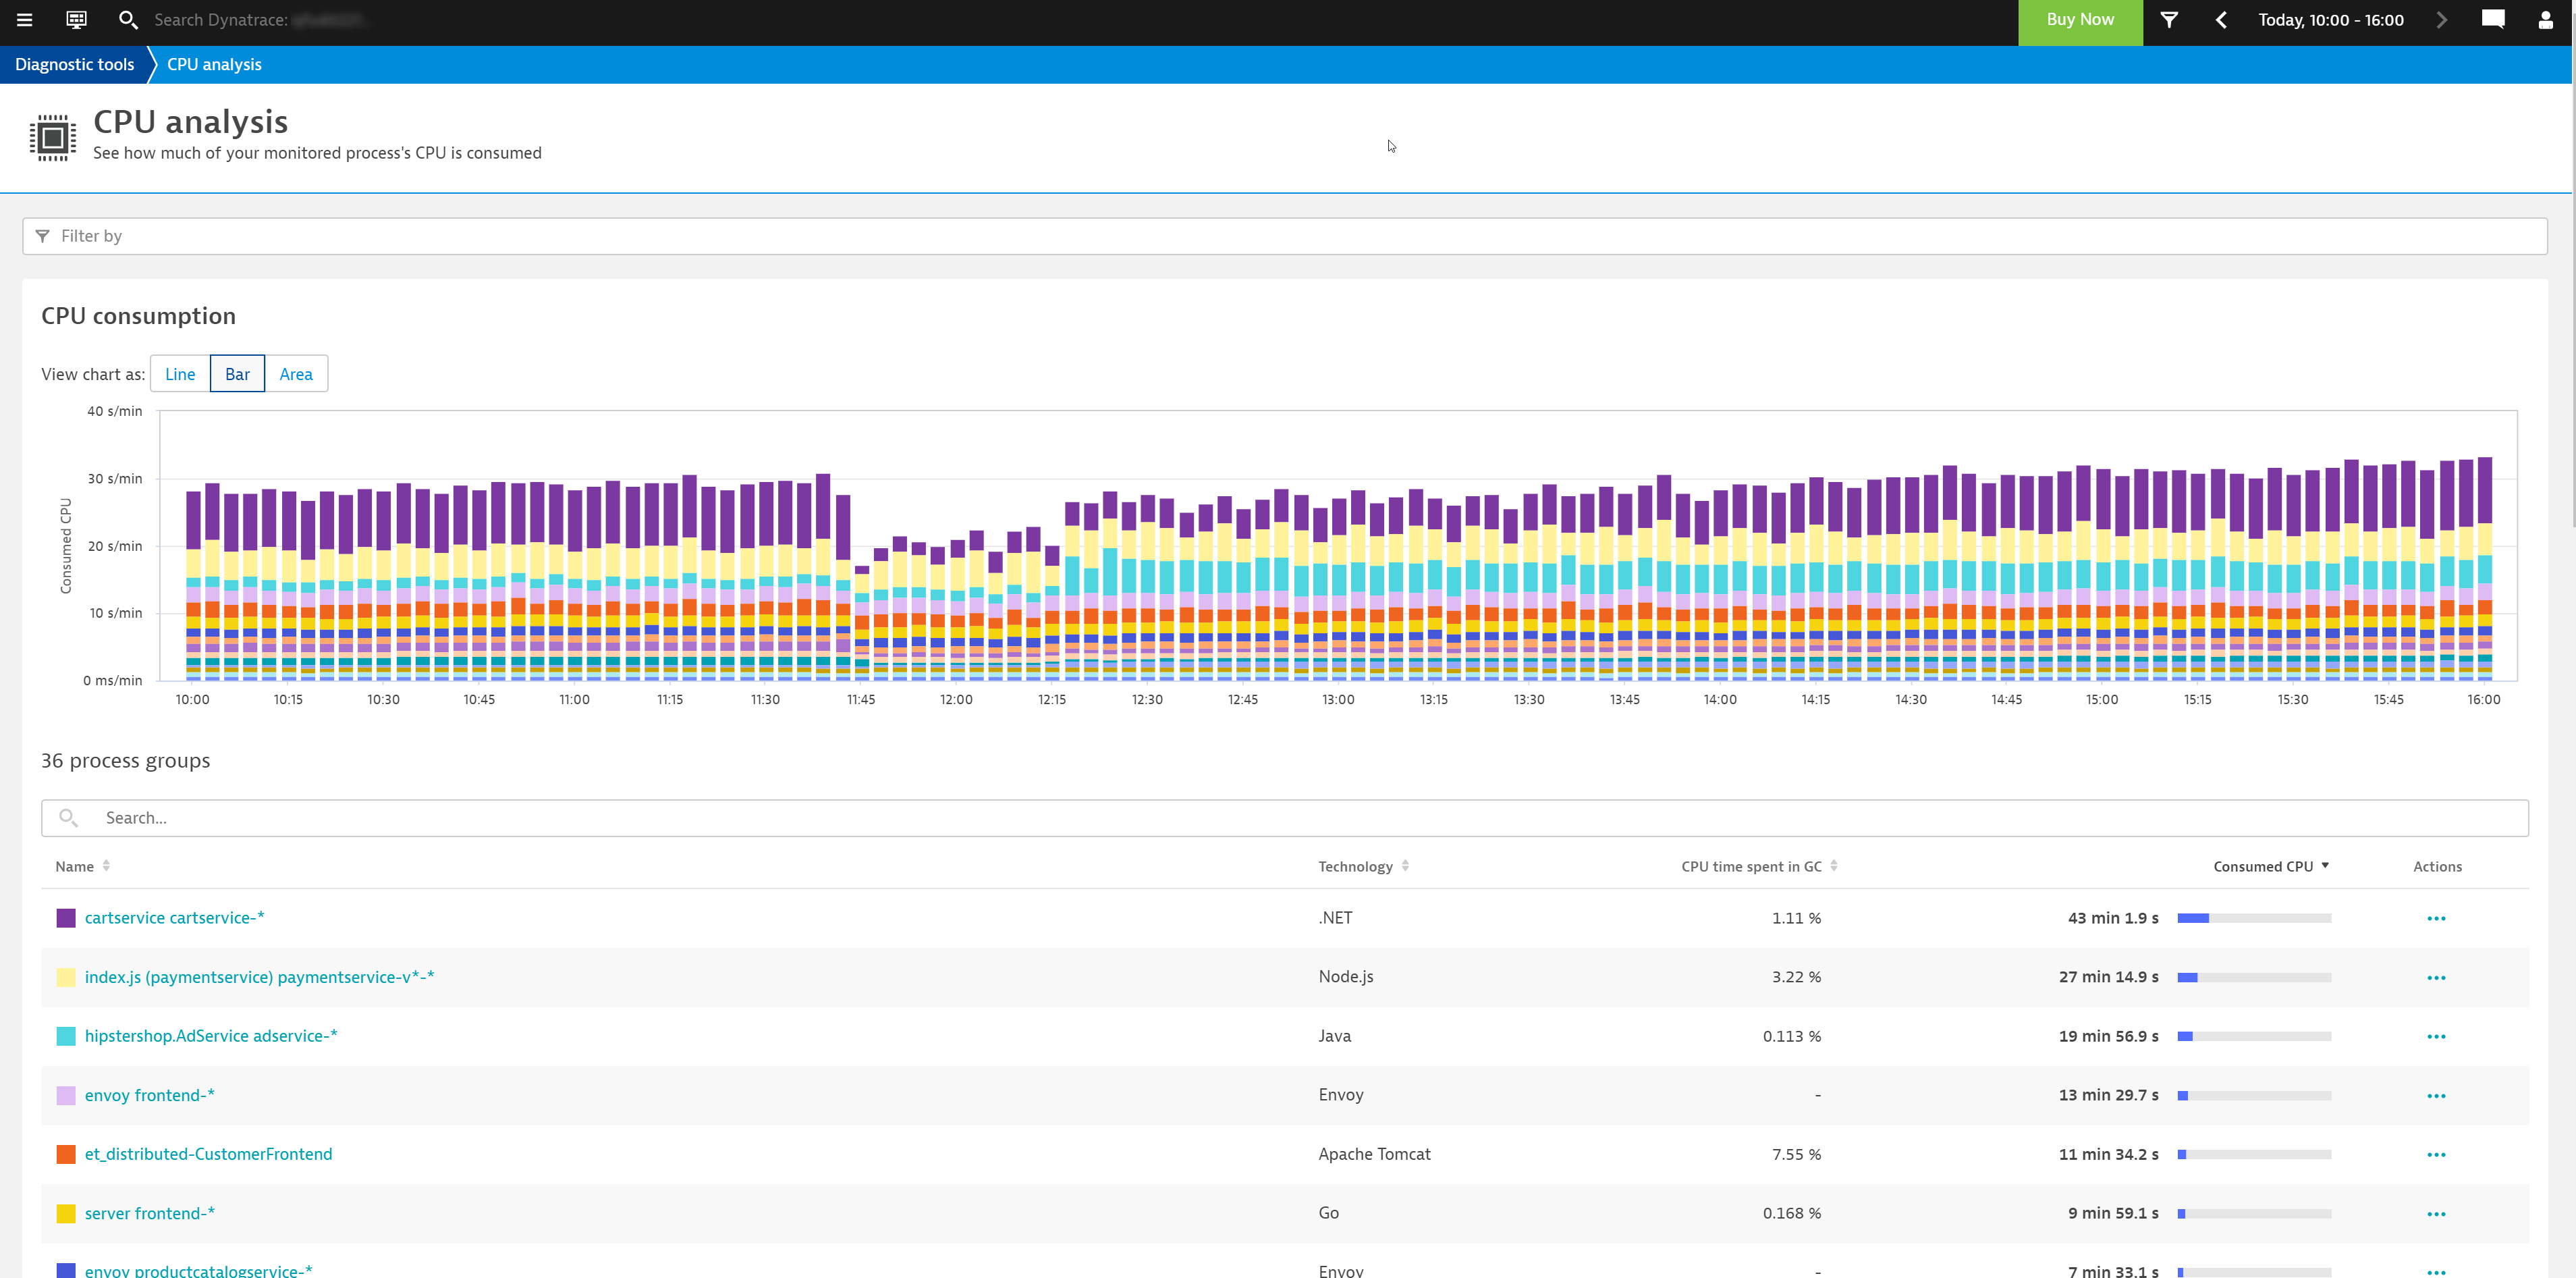
Improved CPU analysis provides an easily understandable overview of your CPU consumption over time, focused on your workloads, represented as process groups, even if they are clustered over several instances. The new CPU analysis view supports different chart types and color coding that make it easier to identify “interesting” workloads.
As shown below, you can now sort your workloads by the total CPU consumed, whether this is needed for service execution, in background activities, or for garbage collection. This enables you to quickly identify those workloads for which optimization will return the highest value.
From here, you can use the context-aware Actions menu next to each process group (see the right-hand column in the process group table shown above) to dive directly into all the code-level insights that are collected by OneAgent, including method hotspots, thread analysis, and memory allocation analysis. You can also easily access the details of a specific process group to investigate related infrastructure metrics, log files, or all auto-detected properties like the underlying execution engine (including version), bitness, listening ports, and more of your workload.
As garbage collection is still one of the most prominent CPU consumers in high-load production environments, you can also sort your workloads based on the CPU time spent in GC (see the column of this same name in the image above). If your workloads run on Java 11, you can even use our powerful, always-on memory-allocation analysis to get deep, actionable insights into how to optimize it. The improved filter bar allows you to search for workloads by name, tags, or technology.
For more complex workloads, it can make sense to follow a divide and conquer strategy—select the name of a specific workload to slice and analyze it further. This can be helpful when multiple instances of your workload run in parallel or when your workload offers multiple endpoints/services that may contribute differently to overall CPU consumption.
Divide and conquer
Split analyzed workload by processes
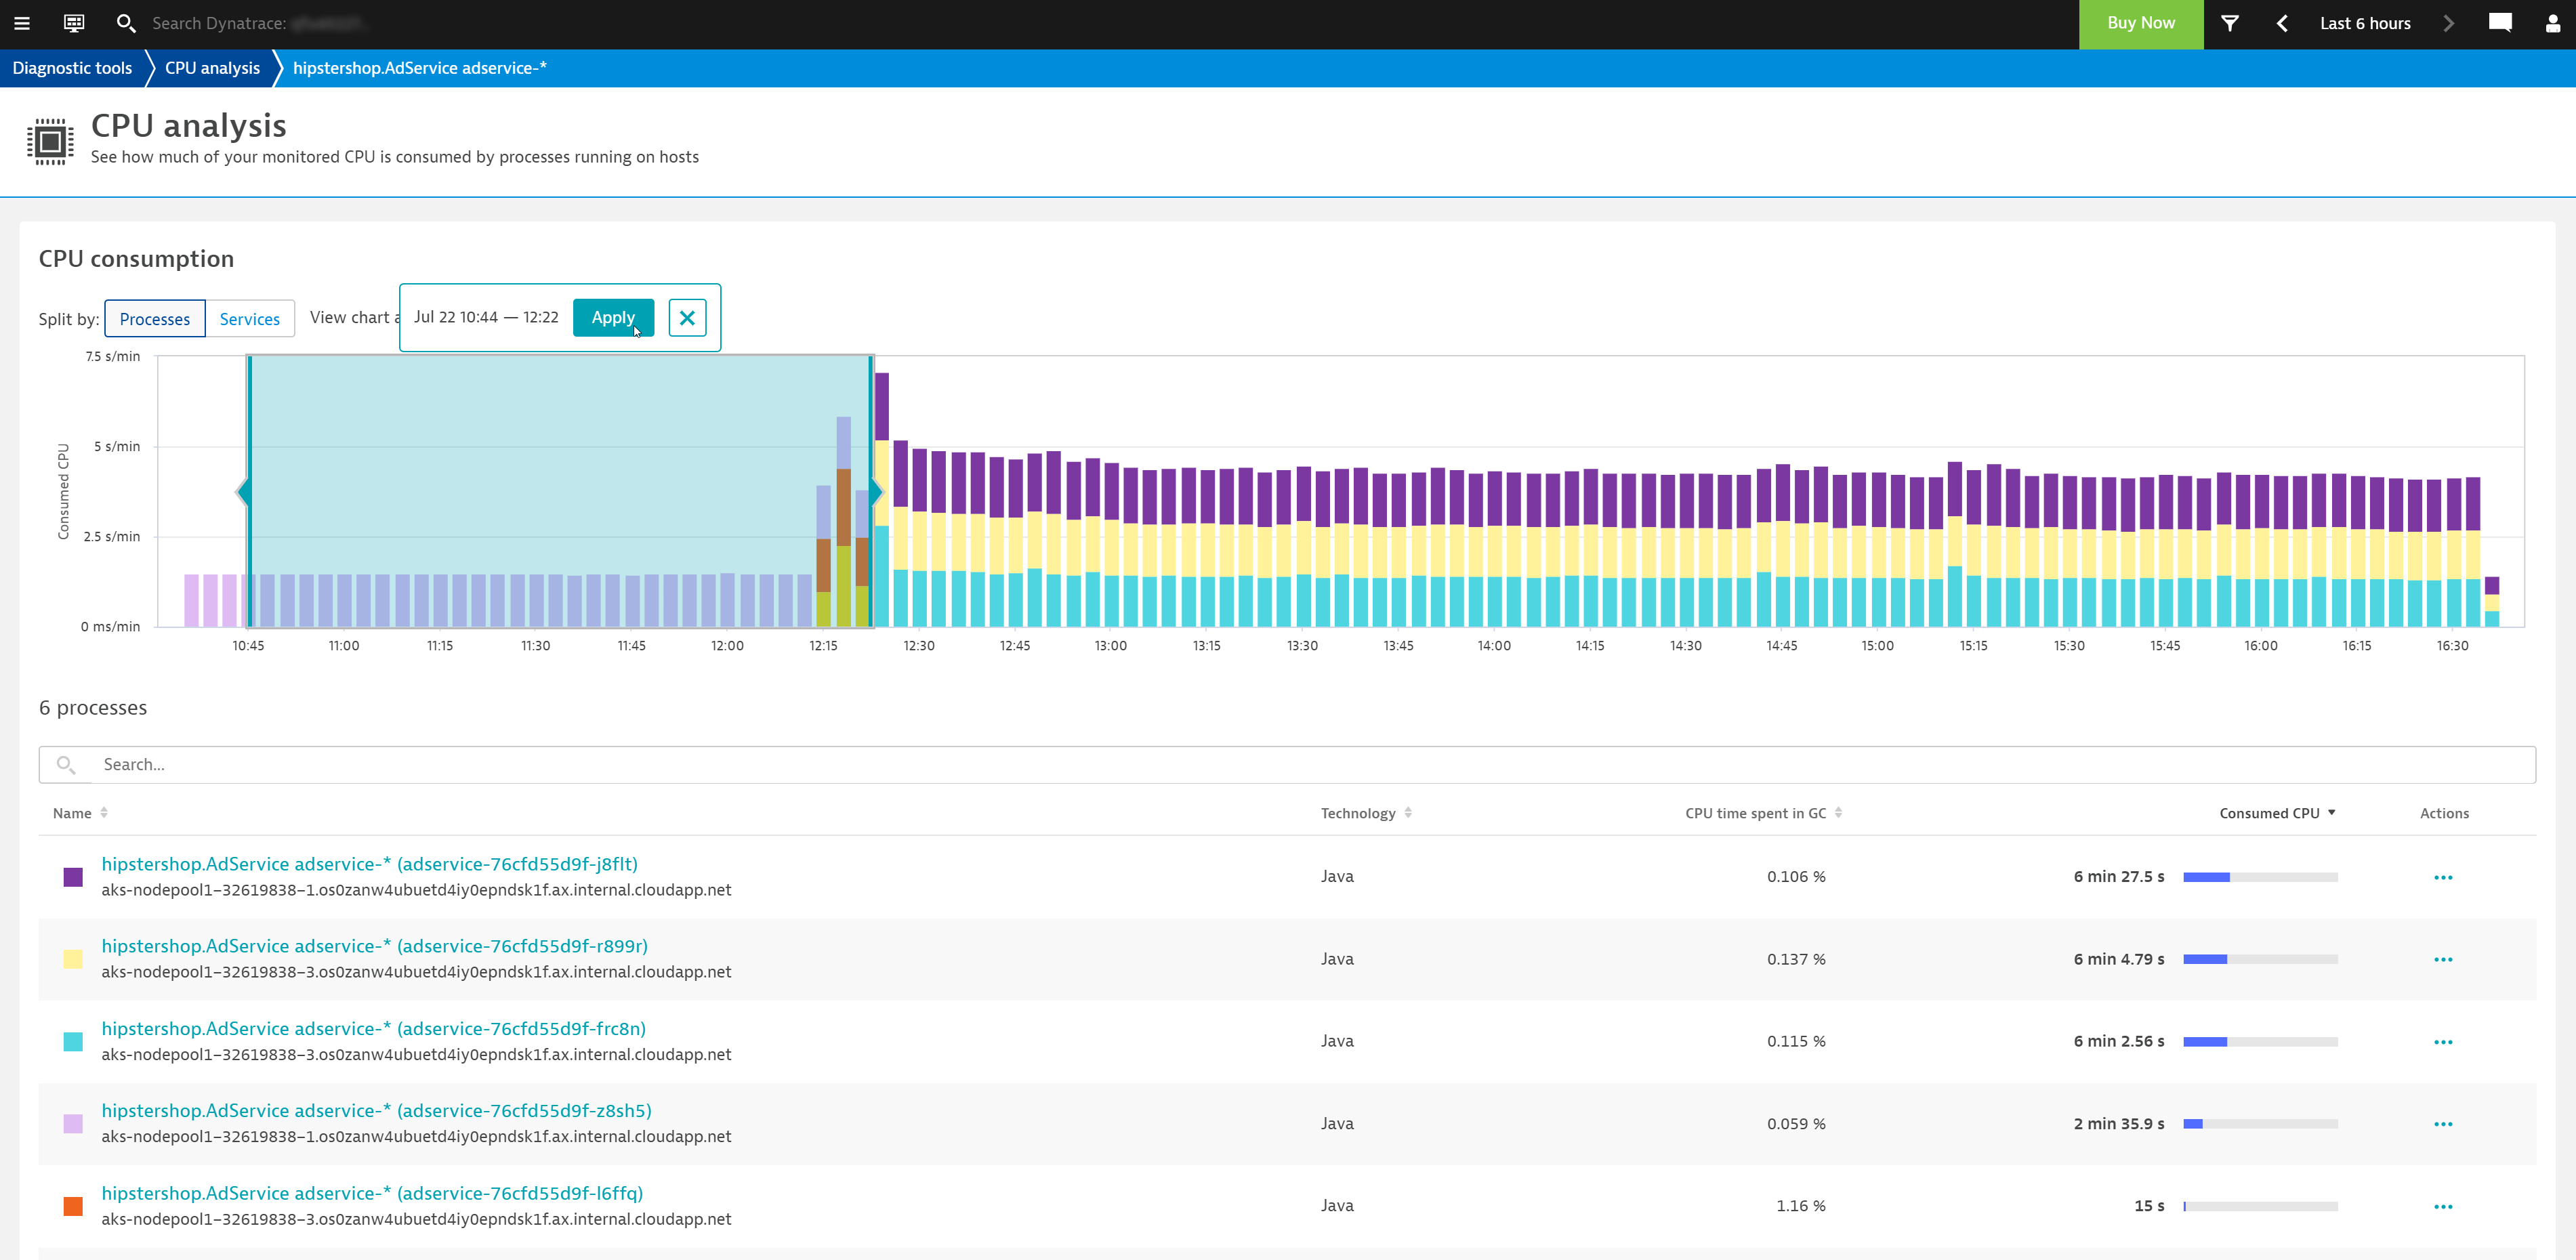
The process group view splits your workload based on the distinct Processes that the workload runs in.
As the example below shows, hipstershop.AdService was deployed on one instance until about 12:15, at which time it was scaled up by two additional instances for a total of three instances. After about three minutes, all three running instances were deleted and replaced by three new instances, all of which are easily identifiable based on the differently colored bars in the graph. All deeper analysis actions are performed across the entire timeframe.
You can now narrow down the analysis timeframe by interacting directly with the chart. Just click in the graph to select the timeframe you want to take a closer look at and choose the desired Action to drill down to code-level detail so that you can be sure of looking at the correct information later.
Split analyzed workload by services
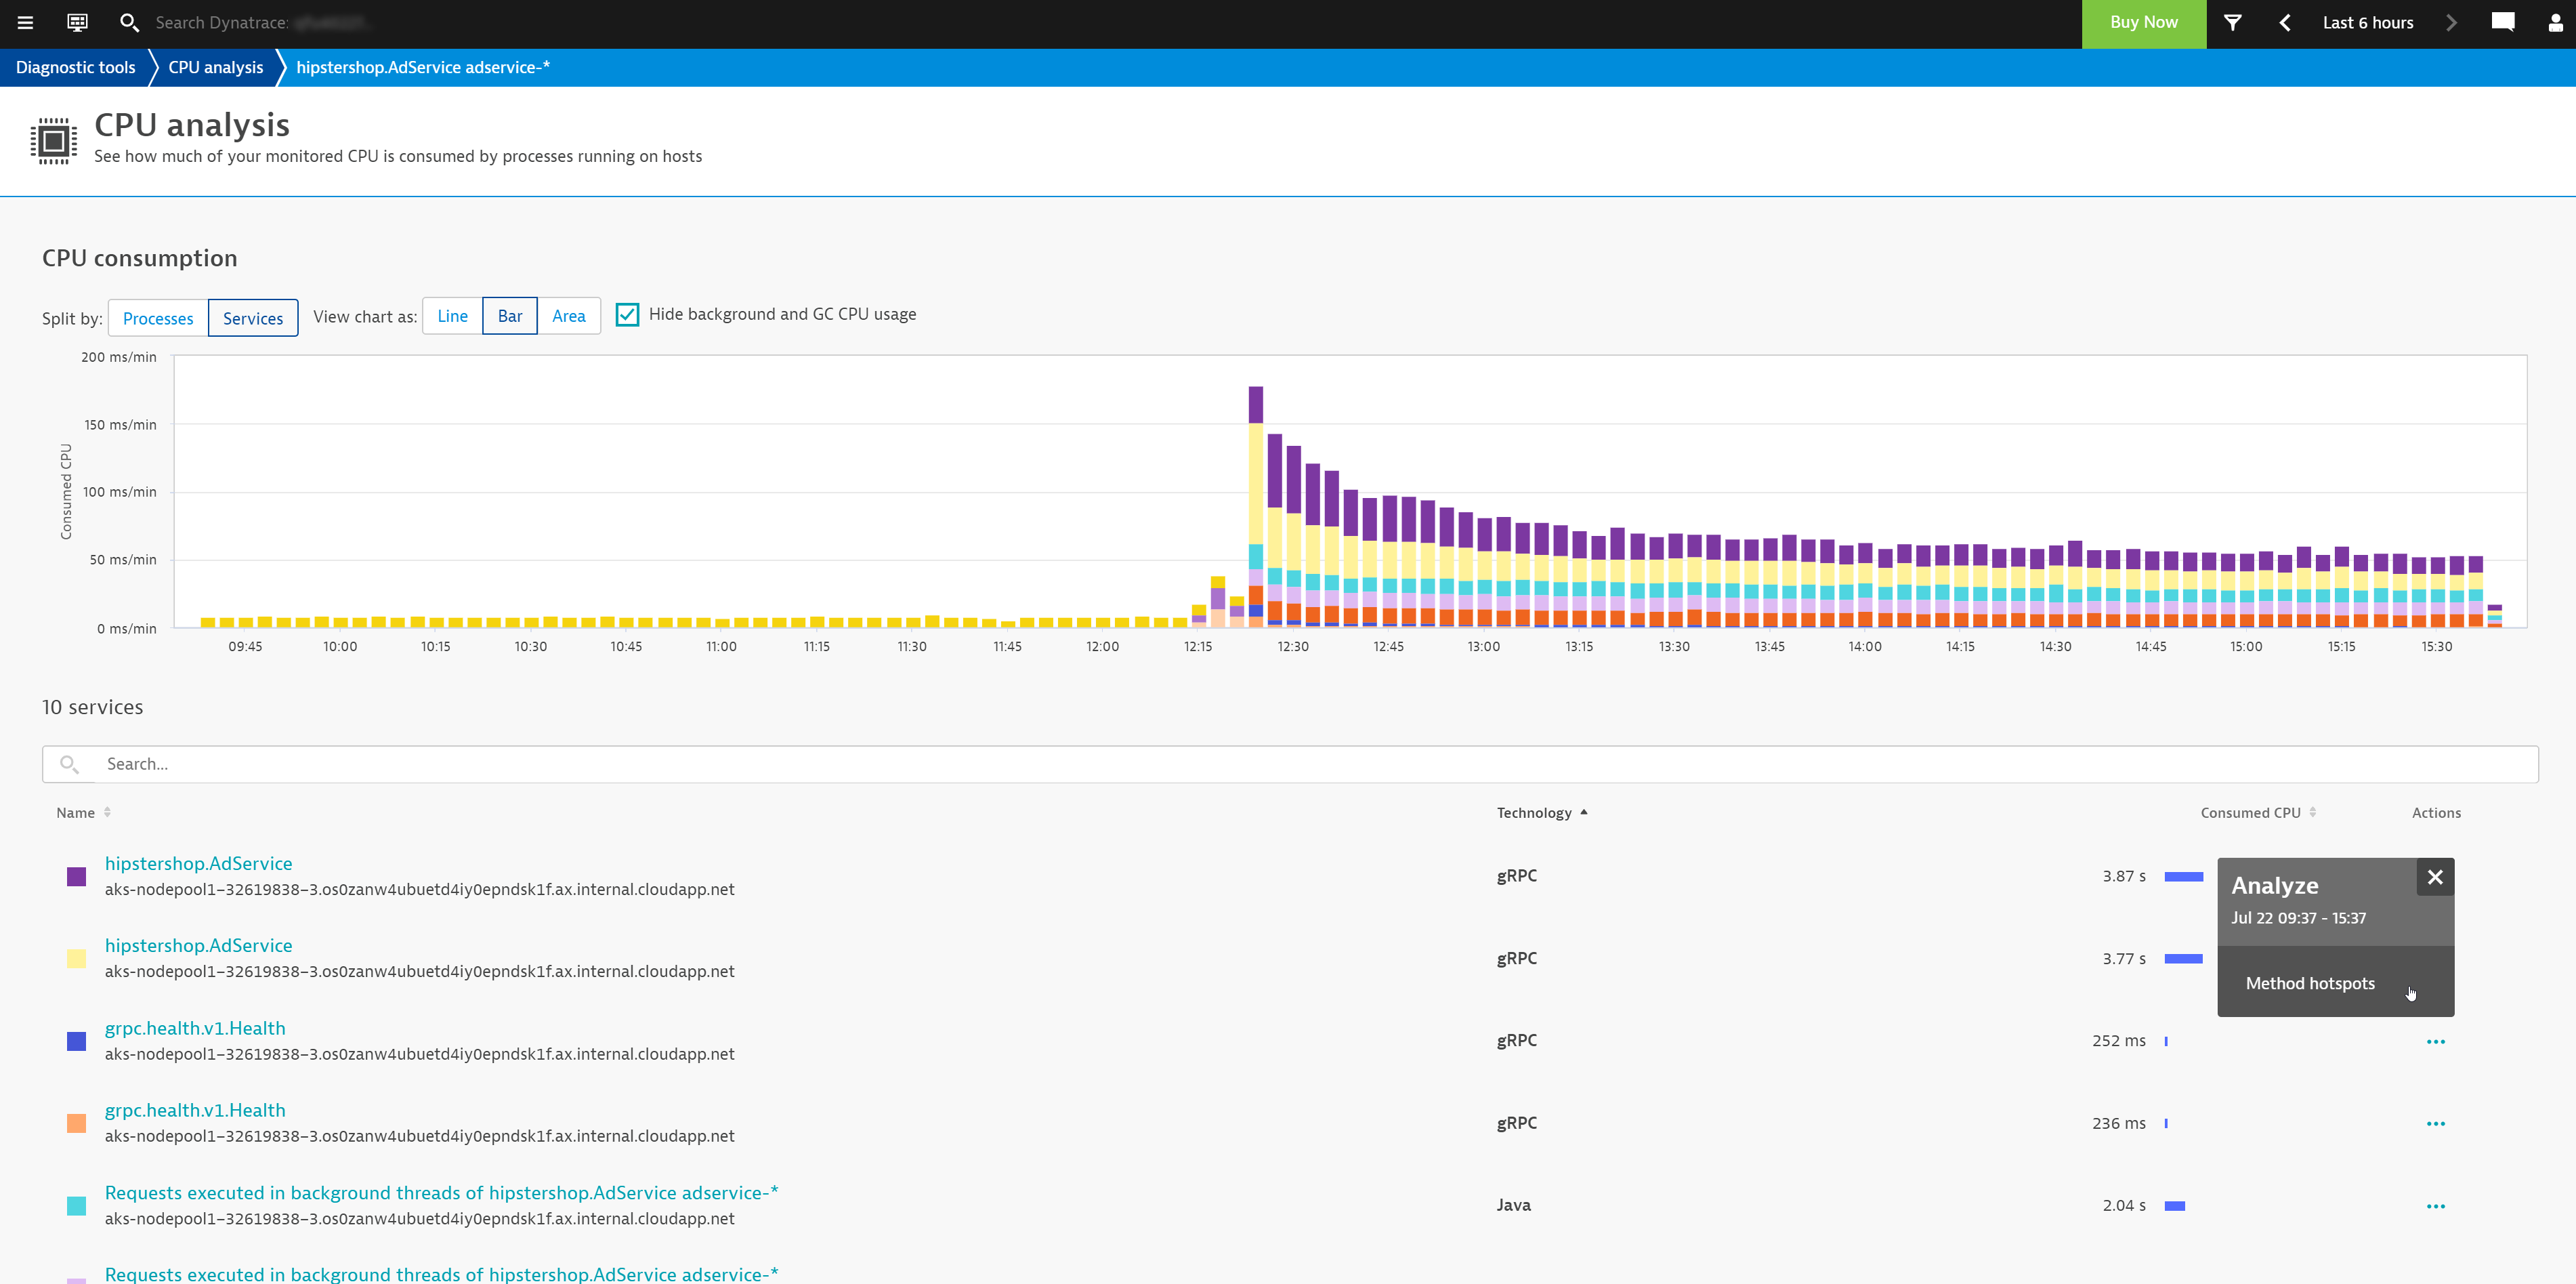
Besides splitting workload by processes, you can also split it by Services. This allows you to focus on the services that are offered by your workload to see if any of them are CPU heavy.
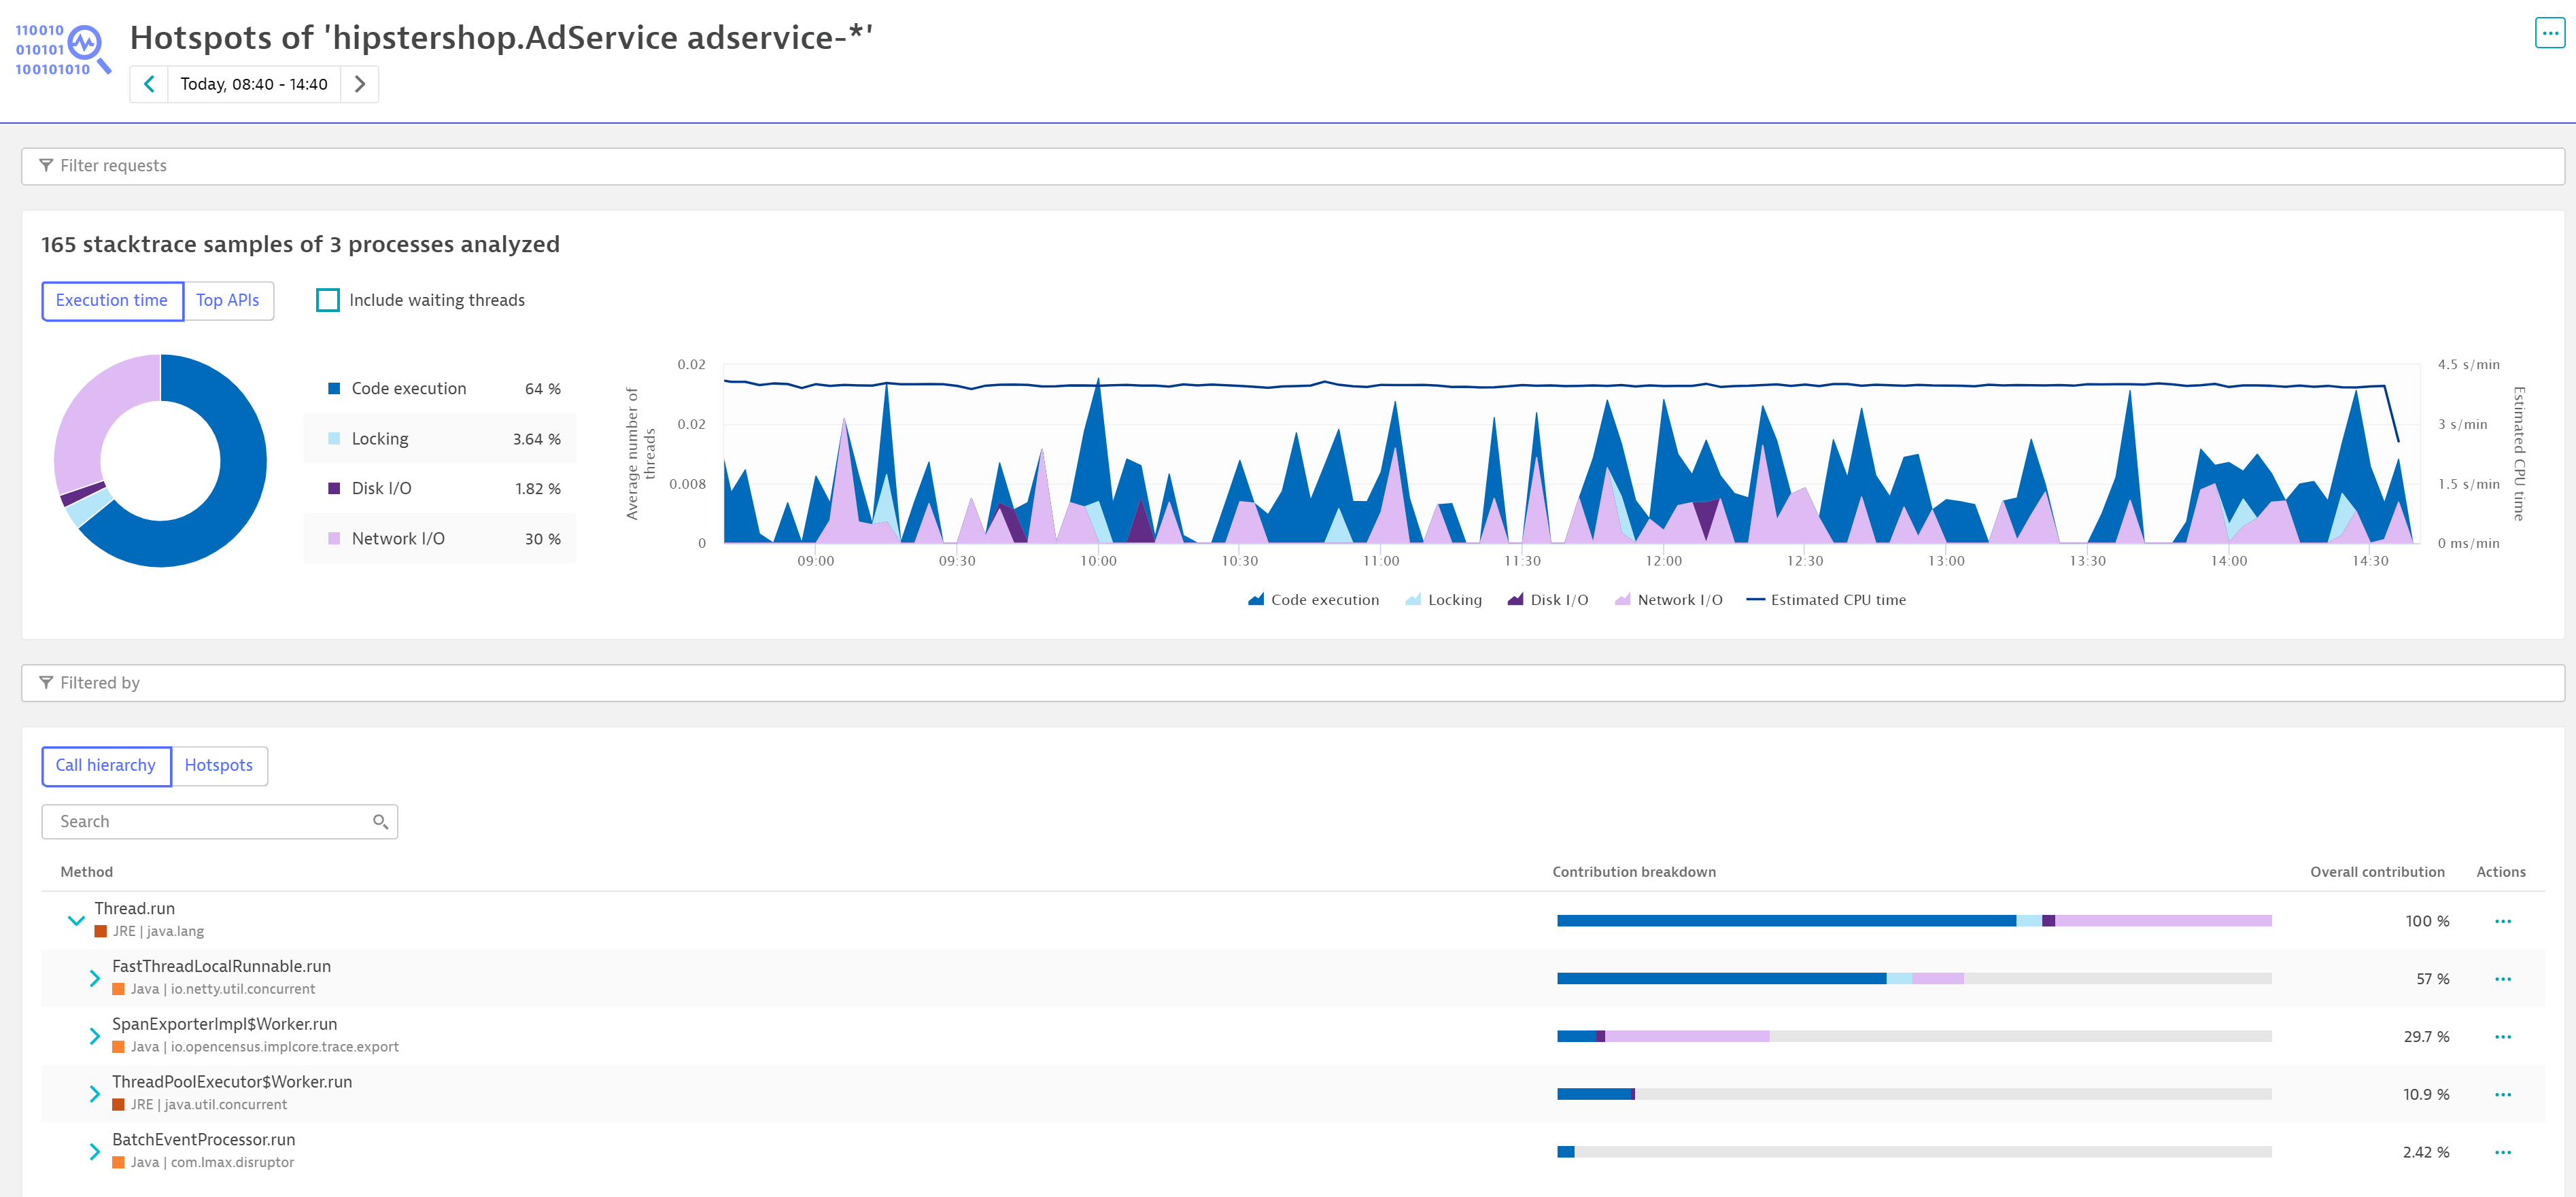
You can also quickly access the automatically collected profiling data via Method hotspots analysis (select Method hotspots from the Actions menu). This allows you to see exactly which methods were executed in the context of a specific service.
Understand what happens under the hood of a specific service via method details
Selecting Method hotspots enables you to better understand the CPU consumption of a specific service (see below). It shows you which methods were invoked and helps you understand if the service was really executing code on the CPU, was in a Locking state, or mainly waiting for disk or networking I/O operations.
How to get started
The new CPU Analysis view is automatically enabled in Dynatrace environments on version 1.198+. You can access it from the navigation menu at Diagnostic tools > CPU analysis.
Whats next?
We’re continuously improving our Diagnostic tools capabilities and workflows and are currently working on improving the Top database statements, Top Web requests, and Exception analysis views. So please keep an eye on this space for more blog posts related to these improvements.





Looking for answers?
Start a new discussion or ask for help in our Q&A forum.
Go to forum