For more than six years now, the Dynatrace Davis® AI causation engine has automatically detected incidents within web-scale service infrastructure environments. In business-critical situations, the amount of information that’s processed by Davis goes way beyond what a human operator could ever hope to process manually.
Davis supports situations where millions of individual transactions must be analyzed in order to detect the correct root cause of a complex incident and where remediation insights are needed within minutes, not hours.
What’s sometimes forgotten is that Davis has capabilities that go way beyond just analyzing individual transactions. Davis has the unique ability to precisely identify code-level findings, such as resource consumption during the span of an individual transaction.
Why code-level context is important
Code-level context is the crucial information that helps DevOps teams to immediately locate the fundamental problems within their service implementations. Without such detailed information, it simply isn’t possible to identify the real code-level cause of a software problem. Davis, with its unique ability to access all such context-rich information, traverses all incoming traces individually, identifying abnormal code-level behavior and offering direct access to the sorts of summarized answers that DevOps teams need.
This kind of fully automatic code-level analysis has been performed for years by Davis but has been a bit hidden behind the scenes. Even though Davis has successfully guided operators to the correct information they need, the process typically required multiple clicks to get to relevant code-level findings.
With this release, we’ve simplified the navigation process tremendously, and Davis now displays code-level findings directly within the root cause analysis of each reported problem.
Faster problem remediation with code-level root-cause analysis detail
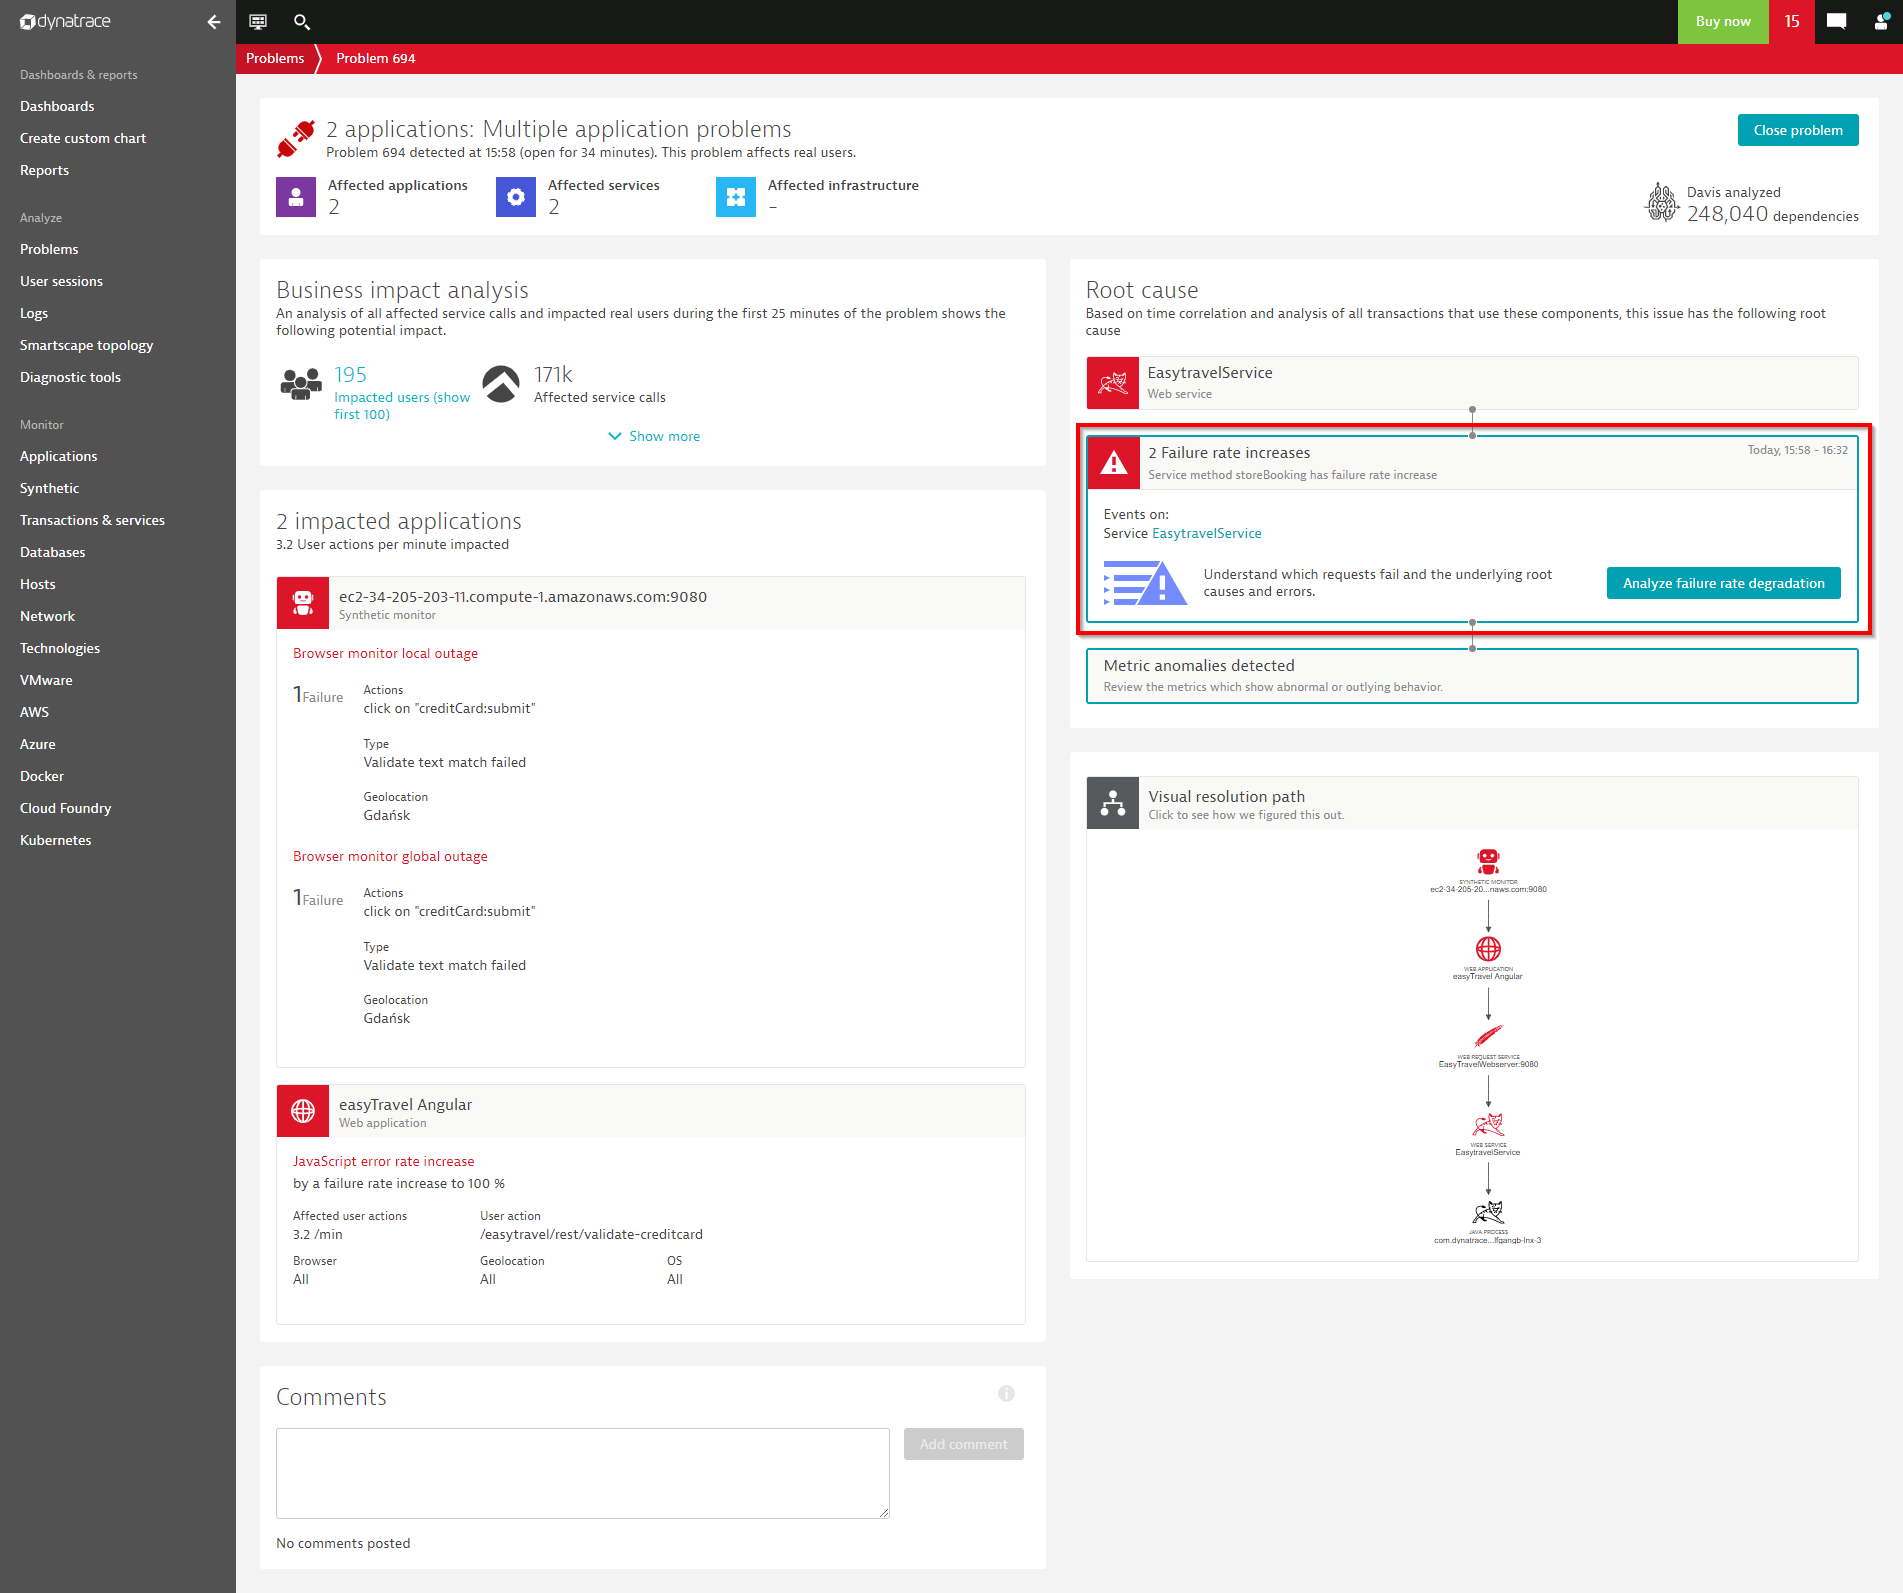
Let’s take a look at how Davis presents code-level information. In the example below, Davis has surfaced an application error that affects real users and a synthetic incident.
Davis automatically followed the transactions originating from the web application and performed a code-level check on the underlying services. The root cause shows that an error was thrown by a back-end service called EasytravelService where the service request storeBooking failed.
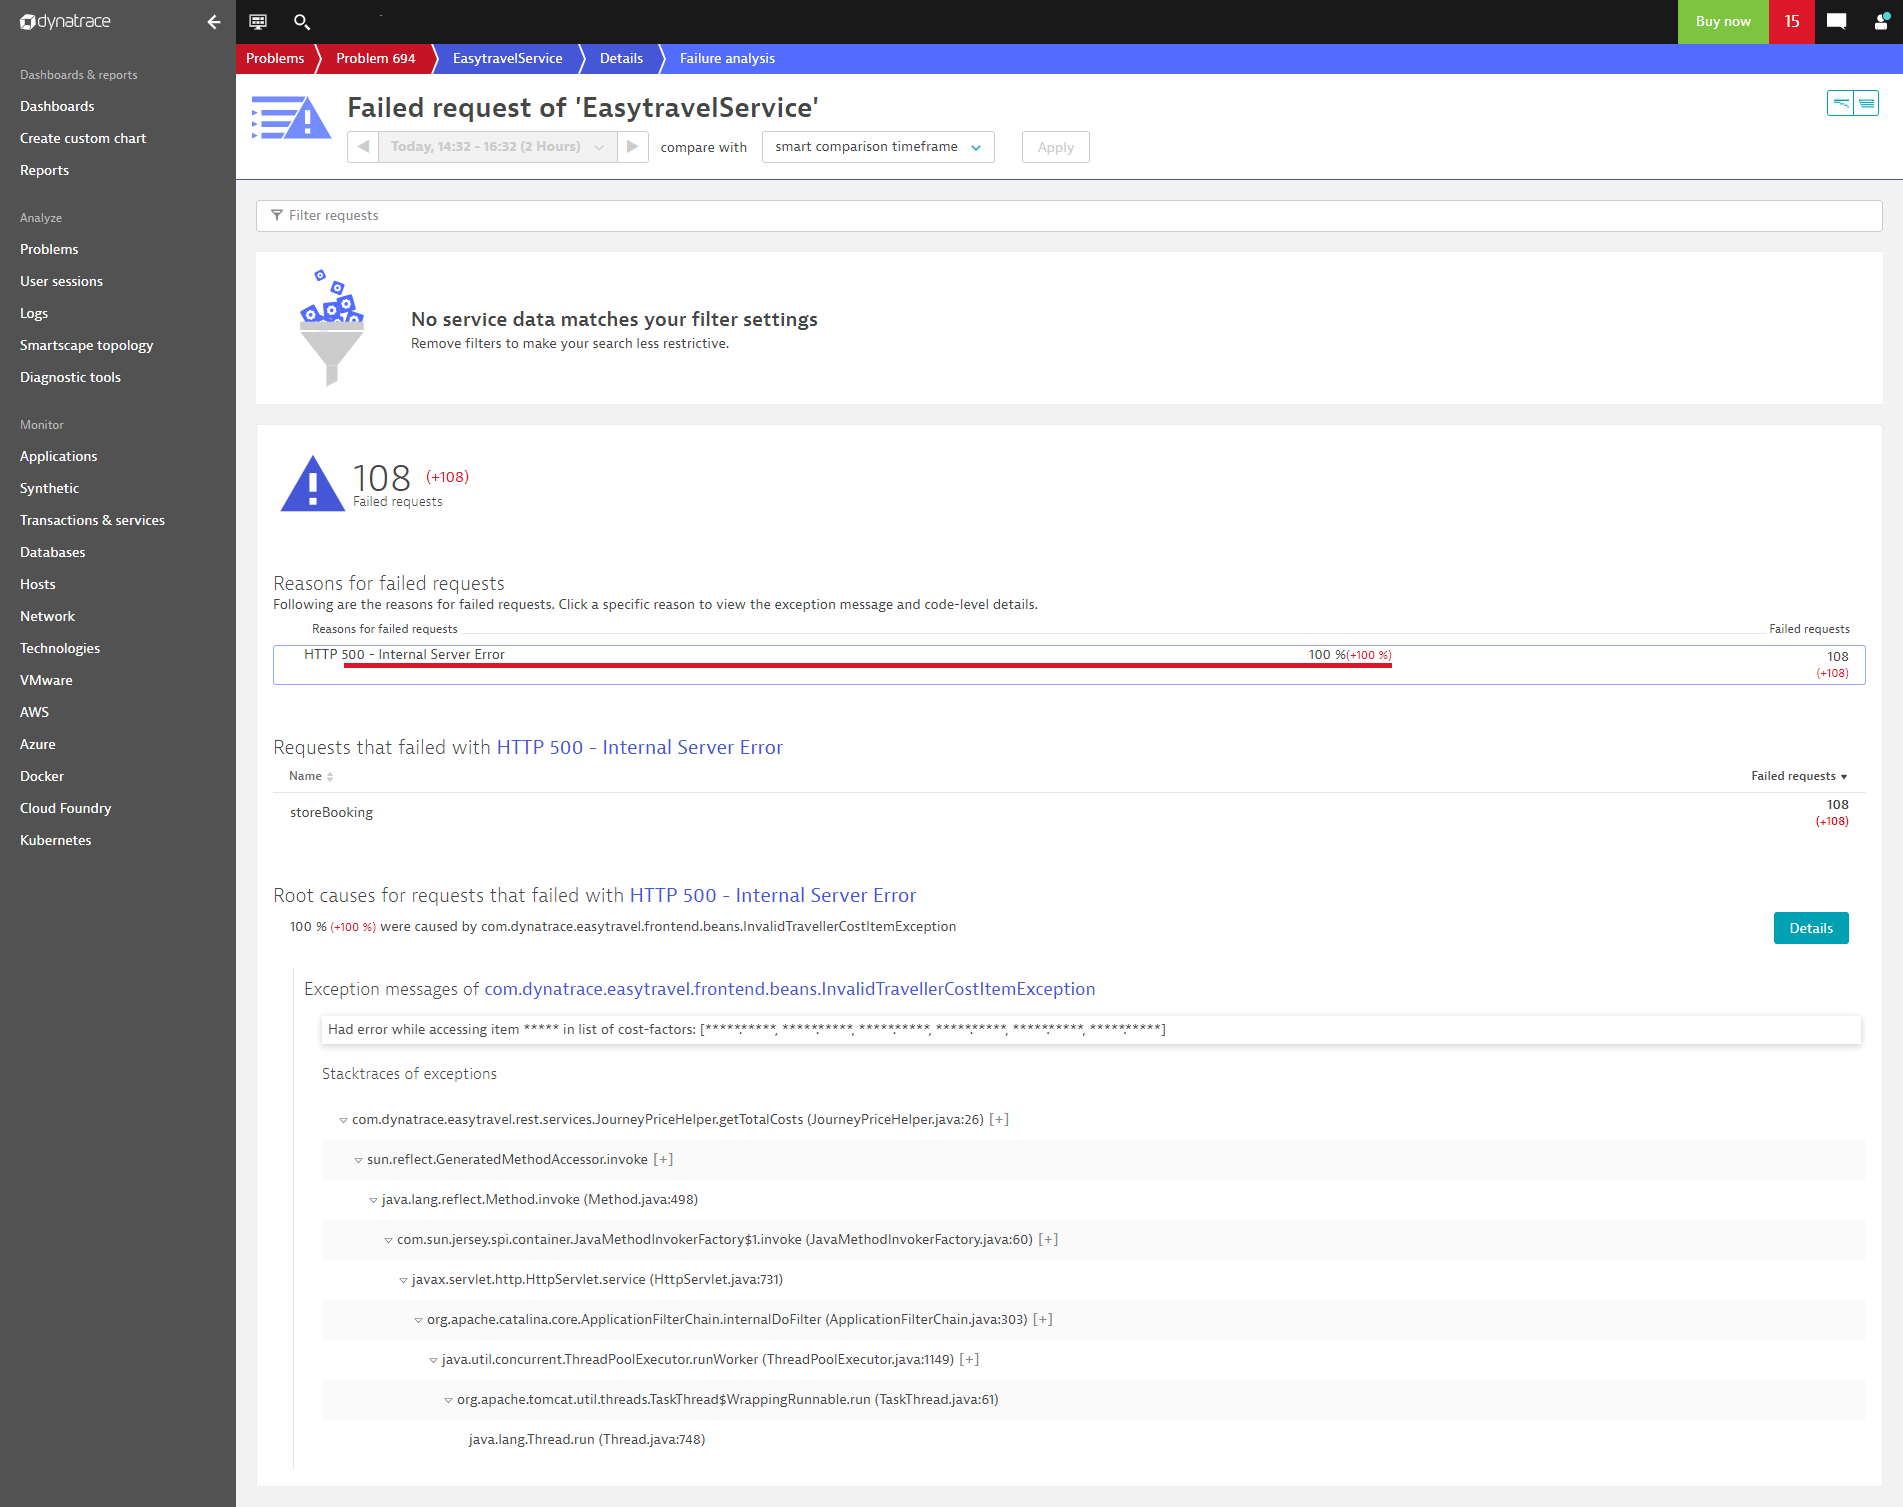
By selecting Analyze failure rate degradation you can see the failure stack traces that Davis found in the root cause EasytravelService service.
This example also highlights the importance of code-level and contextual information that goes much beyond pure tracing capabilities.
Summary
Fully-automated Davis problem analysis delivers answers, not just data. With the unique code-level capabilities of Davis, we’ve reduced the number of clicks required to reach and understand code-level findings. When there’s a critical outage, this new feature will save you a lot of time compared to cumbersome and error-prone manual analyses of millions of service traces.
Automation is the key to software intelligence and autonomous cloud operation, so start using Davis to analyze your traces!


Looking for answers?
Start a new discussion or ask for help in our Q&A forum.
Go to forum