Dynatrace automatically monitors performance changes over time, alerts you to all detected performance problems (including any impact on real users), and points you to the root causes of such detected problems so they can be resolved as quickly as possible. This design approach enables you to react quickly and effectively when your customers are affected by performance problems with your application.
For Developers to understand how to avoid future performance issues and proactively optimize performance, you must be able to analyze real-time data and understand performance differences over time. Dynatrace provides you with just the tools you need to do this.
Dynatrace recently added a comprehensive means of comparing service request performance and error trends over time. We’ve since added even more sophisticated means of slicing and dicing data so that you can better understand performance changes in more detail. The Response time analysis and Failure analysis views can now be used for side-by-side comparisons.
Compare response time hotspots
To compare the response times of two executions of the same service:
- Select Transactions & services from the navigation menu.
- Select the service you want to analyze.
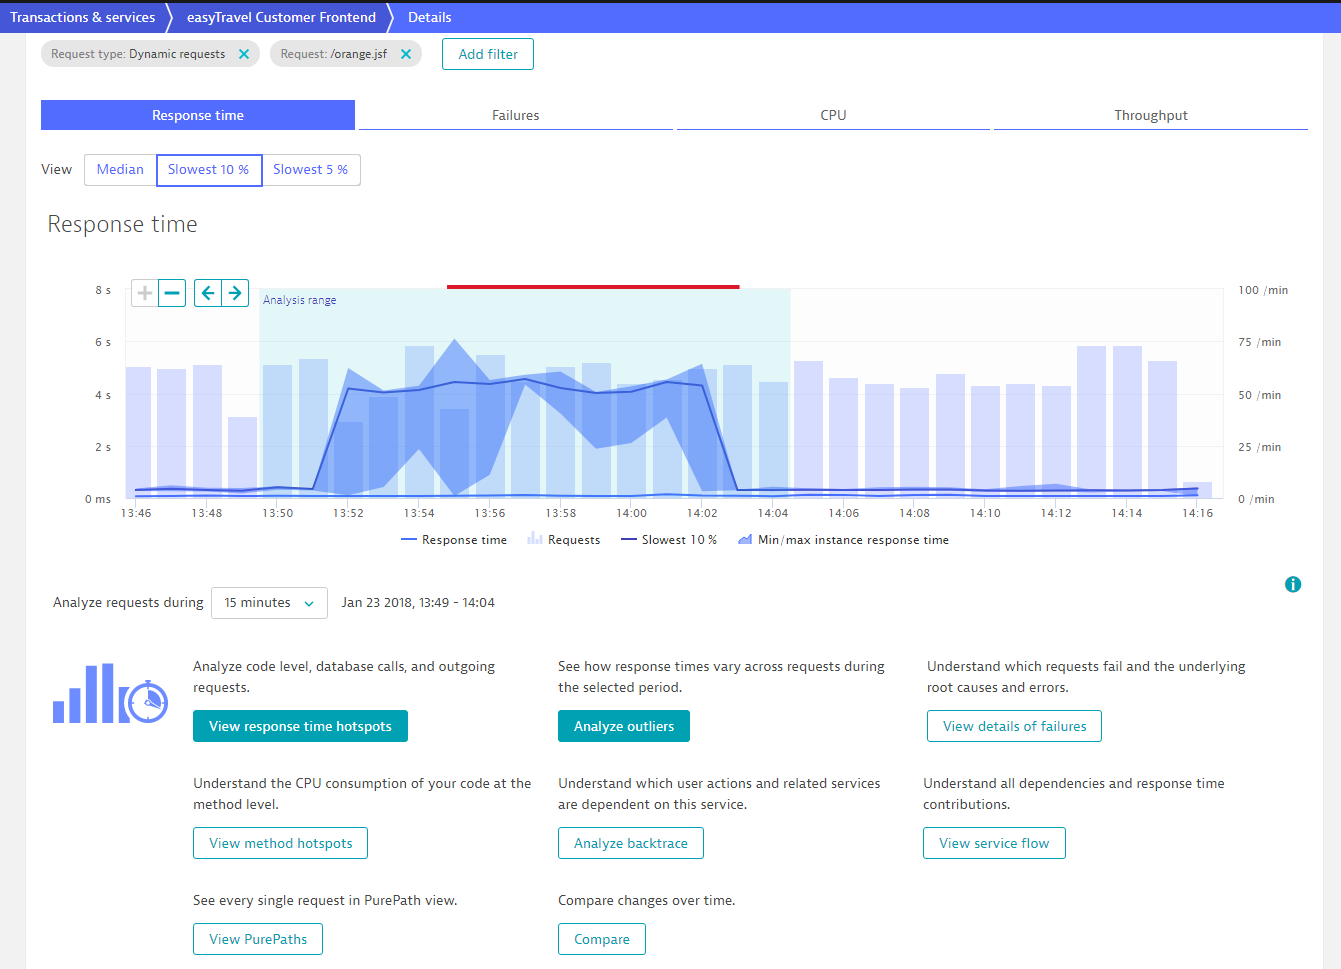
- Click the View dynamic requests button to view the service’s Details page.
Note the large Response time spike in the example below.

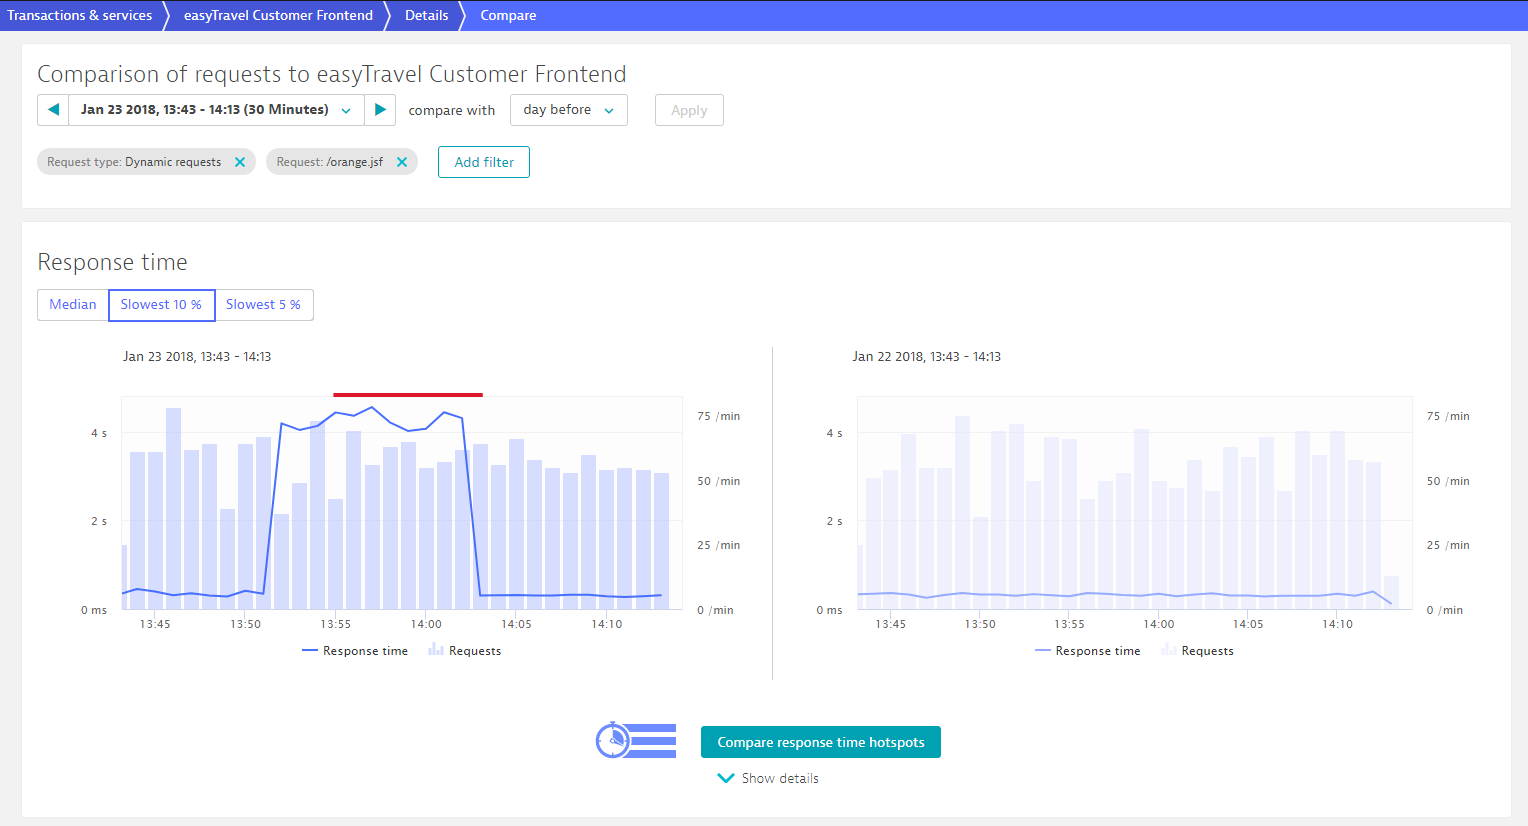
- Click the Compare button to compare the response time of this service execution to any past execution of the same service.
If the Compare button is not visible, click the More button to reveal it. - You can use this Compare view to compare the performance of service requests over time. This feature is not new. What is new is the Compare response time hotspots button underneath (see below).

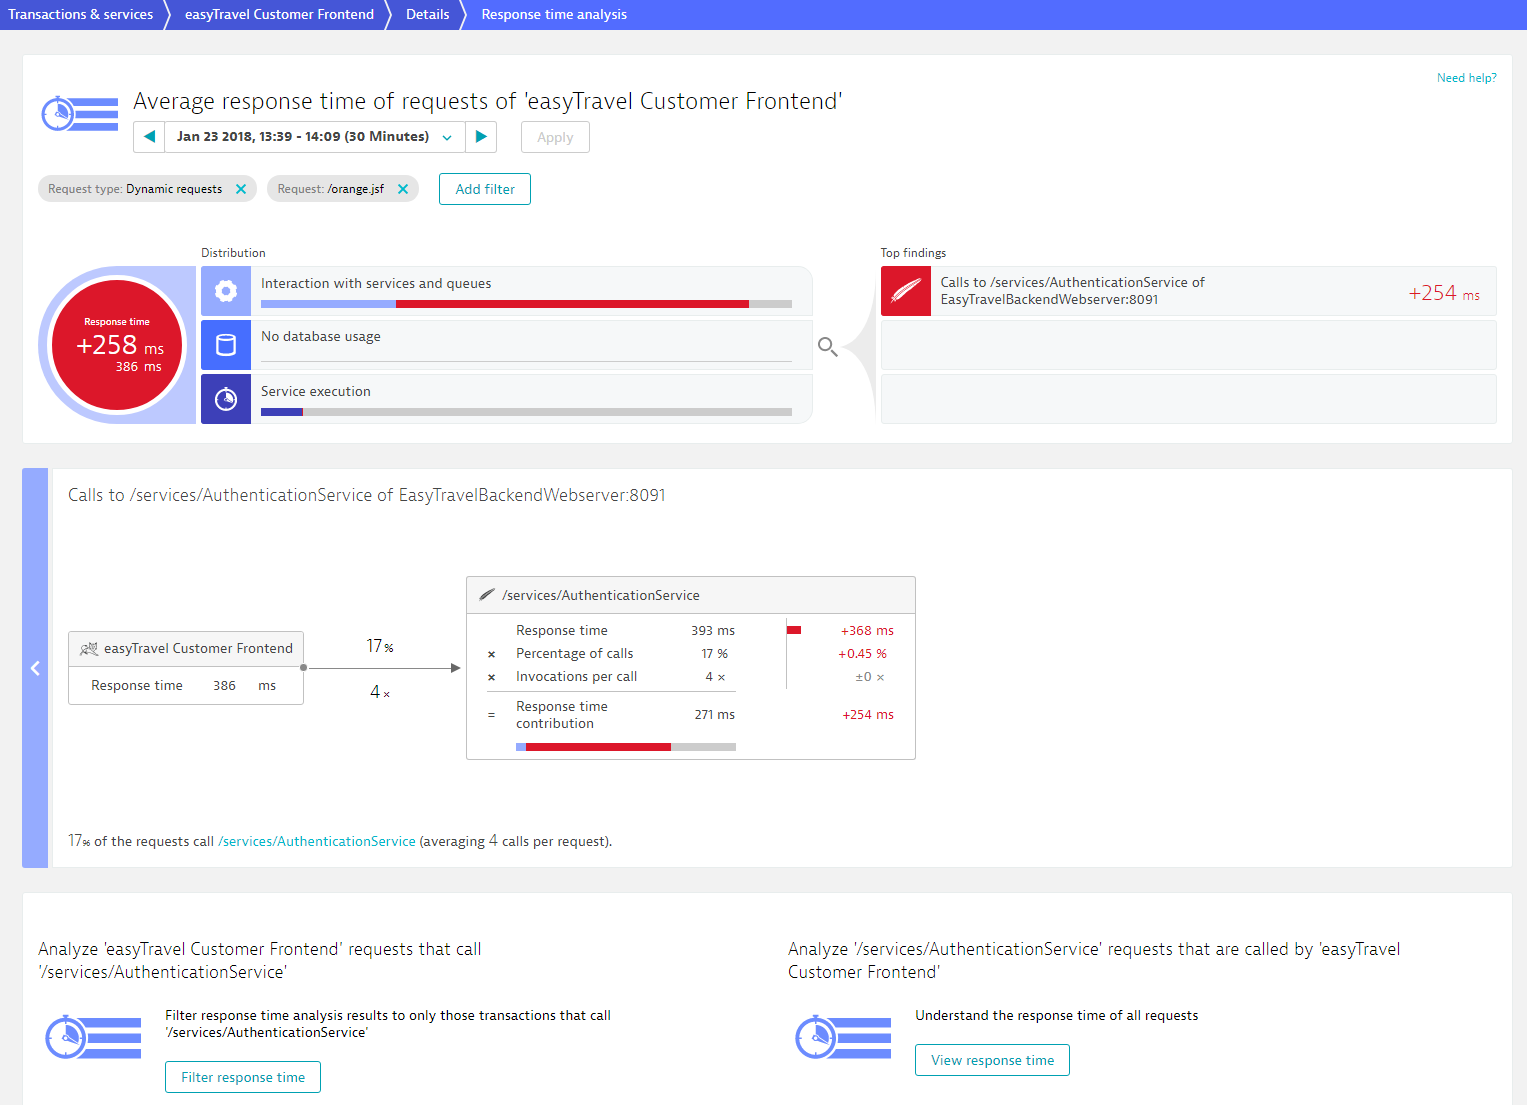
- Click the Compare response time hotspots button to open Response time analysis view in compare mode. This highlights the root cause of the change in response time. Note in the example below that the call to AuthenticationService is the cause of this performance problem. Note that requests to AuthenticationService represent 17% of the analyzed calls.
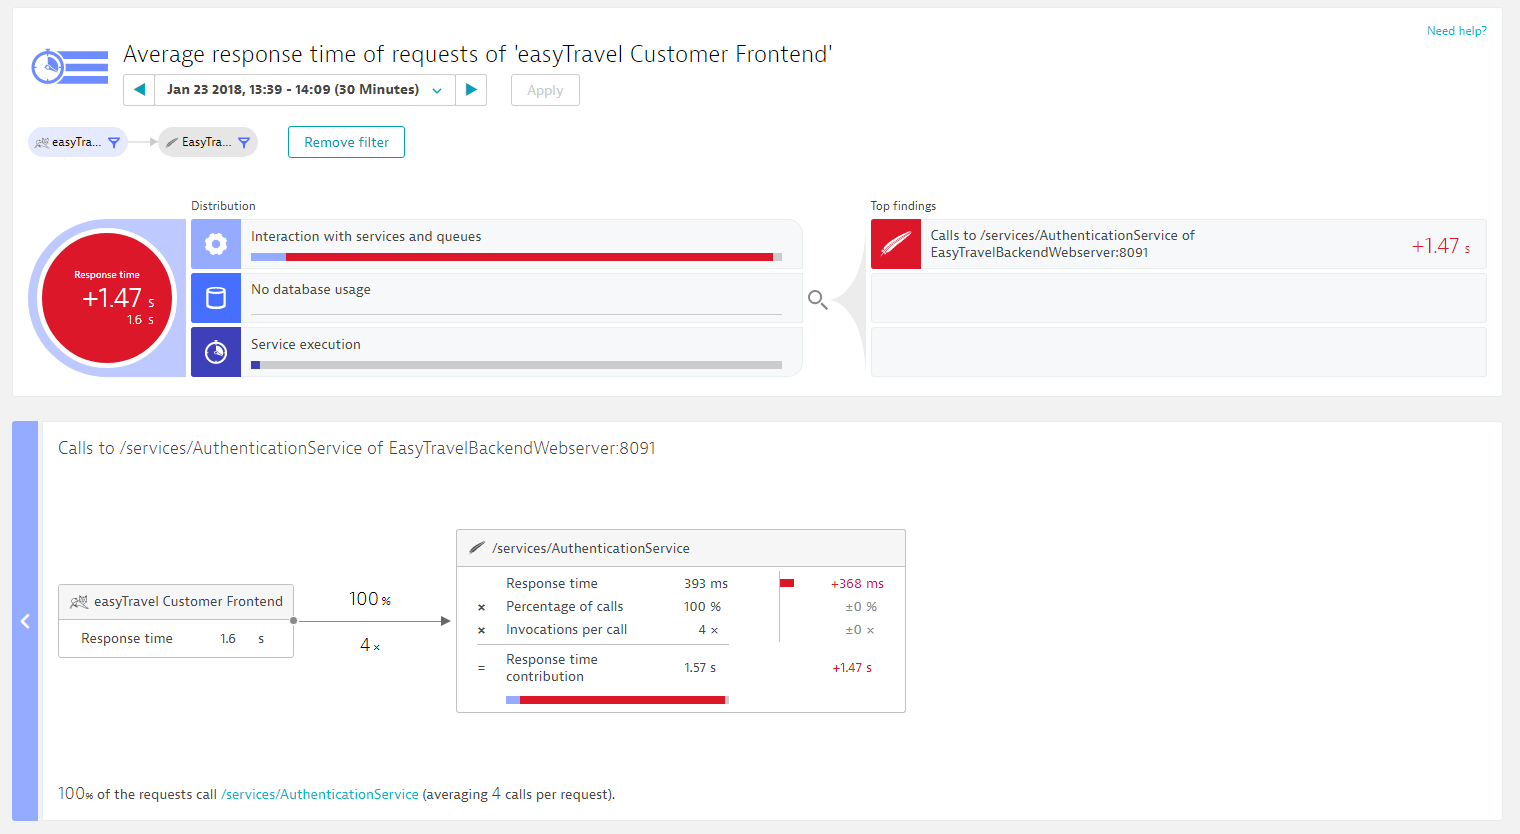
- To take the analysis one step further, click the Filter response time button to focus on these authentication service calls.

- Looking now at only this subset of requests, the performance difference between the two service executions is now easy to see.

Such proactive service-performance analysis can be very useful in understanding how effective your organization’s optimization efforts are over time. Simply use Compare mode to compare the latest execution of a service with an earlier execution to verify that your team’s optimizations have in fact resulted in improved performance.
In addition to response time comparisons between two executions of the same service, you can now also compare failure rates between two executions of the same service. And there’s more to follow. So please stay tuned.


Looking for answers?
Start a new discussion or ask for help in our Q&A forum.
Go to forum