
We enhance Dynatrace monitoring capabilities with every release, including Redis, a component that’s critical to high performance of distributed applications. Following are details about some of the new Redis monitoring features that we’ve been working on.
Redis replication monitoring
Dynatrace now automatically recognizes Redis replicas (previously referred to as “Redis slaves”) and master instances and monitors their replication. Redis master and replica instances must be fully synchronized to maintain optimal performance and stability of Redis servers.
With the new Current status indicator (available on all Redis process overview pages, see example below), you can now instantly see the health of your Redis servers. Select specific analysis time frames in the Replica (“Slave”) state bar chart to analyze server status changes over time. Or consult the Status pie chart to understand the exact status distributions during a given timeframe.
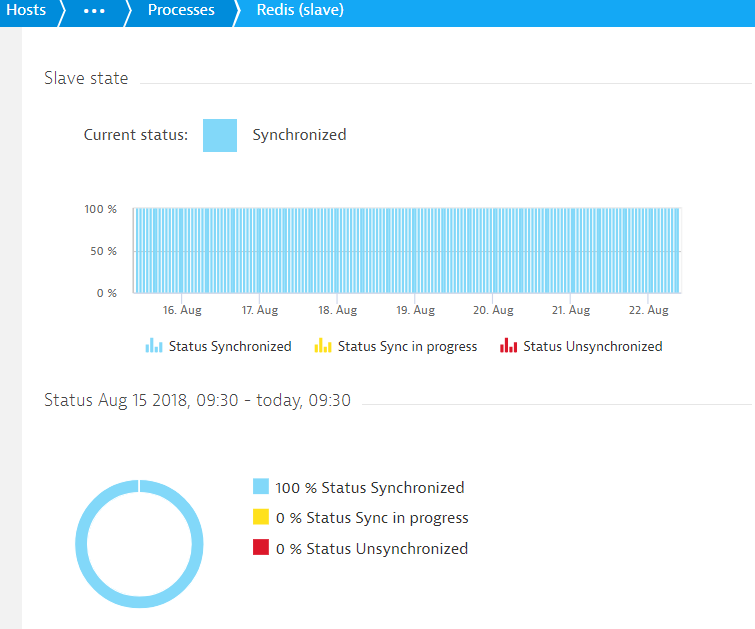
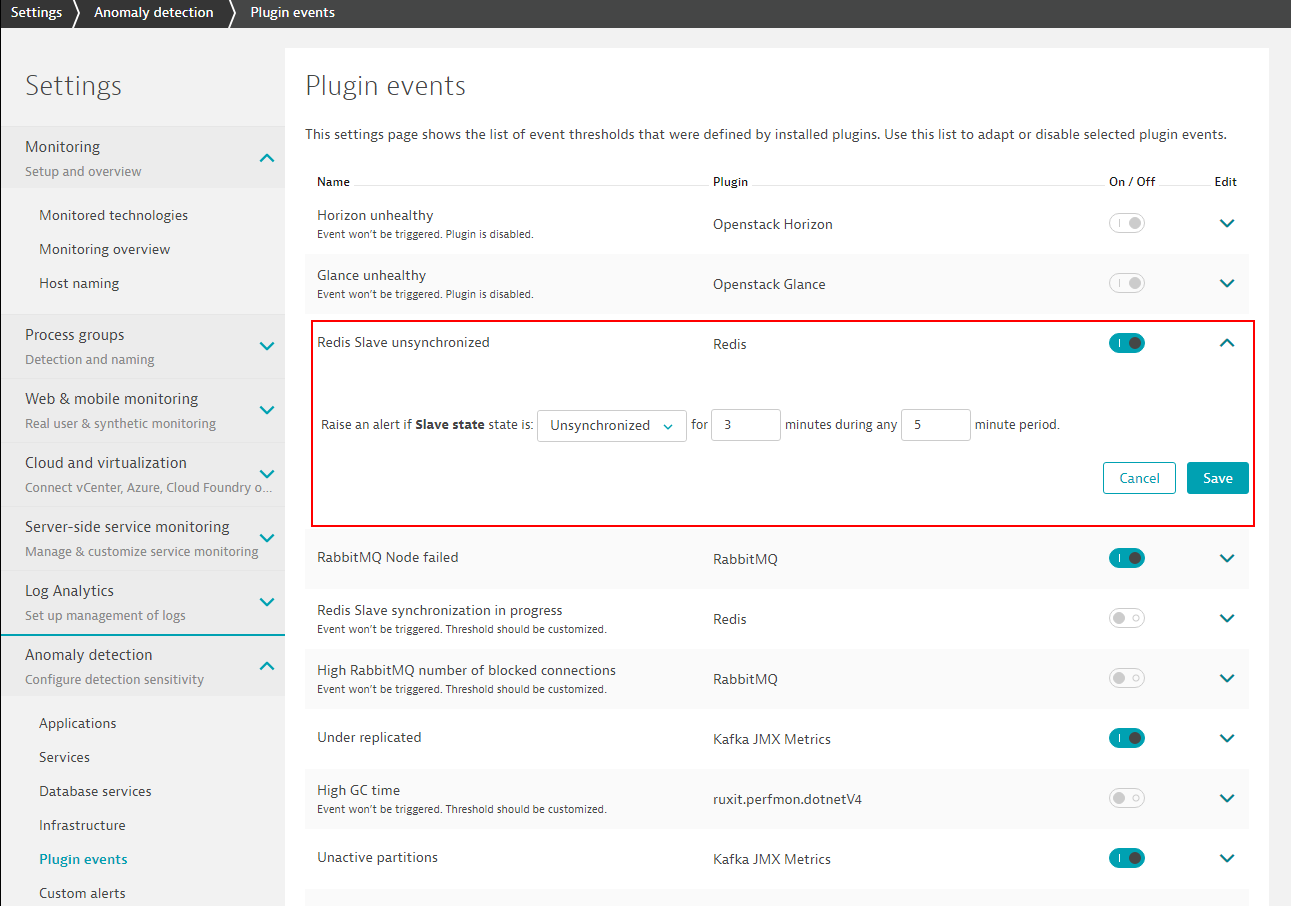
Dynatrace automatically detects when a Redis replica isn’t fully replicated and generates a corresponding Redis replica unsynchronized event. Event-specific settings enable you to adjust the conditions under which alerts are sent out to notify you of these events (see below). To access plugin event settings, go to Settings > Anomaly detection > Plugin events.
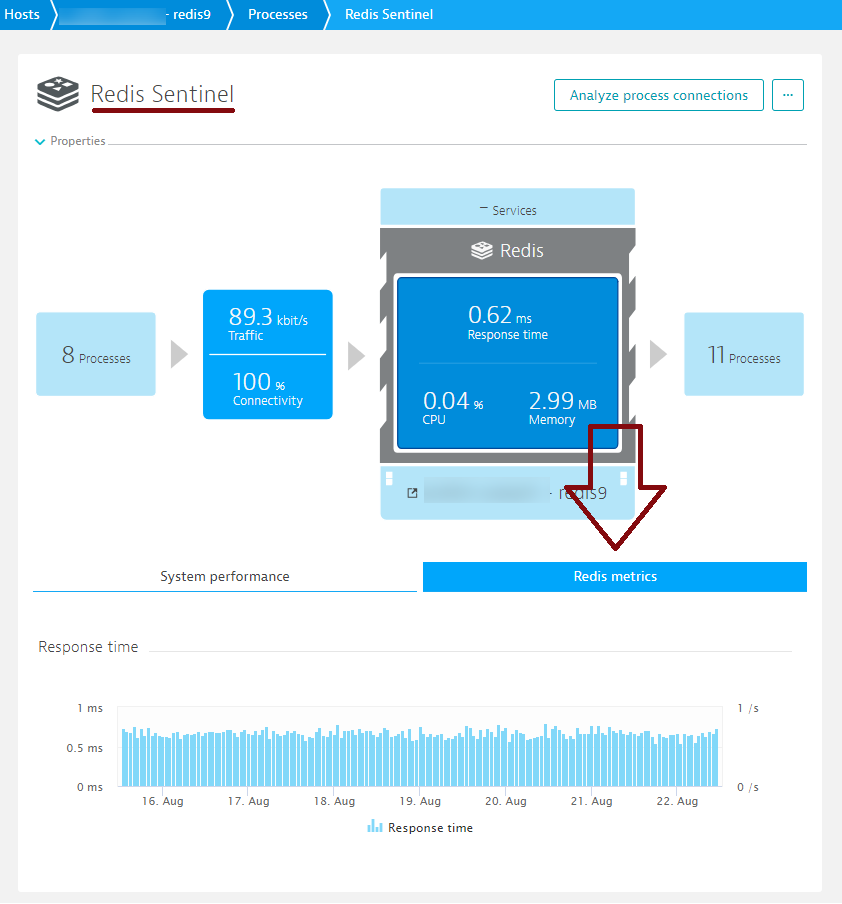
Redis Sentinel response time
Redis Sentinel is the name of the process that’s responsible for the availability of your Redis deployment. The performance of the Redis Sentinel process is measured based on Response time (see example process overview page below).
Redis monitoring support for Cloud Foundry
We also support the monitoring of Redis when deployed within Cloud Foundry environments.


Looking for answers?
Start a new discussion or ask for help in our Q&A forum.
Go to forum