
Dynatrace now provides native, end-to-end observability for Amazon Bedrock AgentCore agents, delivering unified tracing, cost and latency analytics, and guardrail monitoring out of the box. By ingesting OpenTelemetry signals enriched with generative AI semantic attributes, Dynatrace allows easy monitoring of agent workflows, faster troubleshooting, and more effective control over spending through intelligent anomaly detection and forecasting.
Teams can transition from setup to insights in minutes using a lightweight OTLP configuration and ready-made dashboards.
Agentic observability is evolving
Agentic AI systems are quickly moving from proof-of-concept to production, giving customers the ability to automate complex workflows, invoke a variety of different tools and APIs, and coordinate tasks across multiple services. However, traditional monitoring overlooks critical AI-specific signals, such as token consumption, model behavior, and guardrail outcomes. Teams struggle to trace non-linear agent flows, establish baselines for dynamic systems, and maintain predictable costs as usage scales. Without purpose-built observability, organizations risk degraded experiences, higher costs, and compliance gaps as agent complexity grows.
As agentic AI moves from pilot programs to production, organizations are automating complex, cross-system workflows with Amazon Bedrock AgentCore. However, most monitoring stacks weren’t designed for emergent, tool-driven behaviors and, therefore, leave blind spots around correctness, safety, and cost. Teams struggle to trace non-linear flows, establish baselines for dynamic systems, build agentic workflows, and keep token-driven spend under control as usage scales.
The observability gap in AI agent deployments
While AI agents offer significant benefits, including improved employee productivity, increased efficiency, and competitive advantage, among others, an observability gap remains, creating the following challenges:
- Complex multi-step workflows
AI agents run non-linear, multi-system sequences with inter-agent dependencies, making data flow and responsibility hard to trace. This obscures where time is spent and who is responsible for failures in the chain. - Limitations of traditional metrics
Basic operational metrics often overlook AI reasoning errors and quality issues that don’t significantly affect CPU or p95 latency. Without AI-specific telemetry, subtle degradations often slip through. - Continuous underlying agent and LLM model version changes
Your system might be robust today, but upstream model and version updates can alter behavior, latency, and costs, forcing continuous adaptation to prevent regressions and incidents. Proactive detection of model-induced changes is crucial to maintaining stable quality and safety over time. - Scalability and quality challenges
As deployments grow, telemetry volume and coordination overhead surge while token usage and API calls remain untracked. This breaks cost predictability and quality control, leading to issues such as hallucinations and model drift. Multi-agent logic evolves constantly, so “normal” is a moving target. Baselines drift, complicating anomaly detection and root-cause analysis.
Without addressing these challenges, organizations face risks, from degraded user experiences and spiraling costs to compliance violations and reputational damage.
New enhancements for teams building with Amazon Bedrock AgentCore
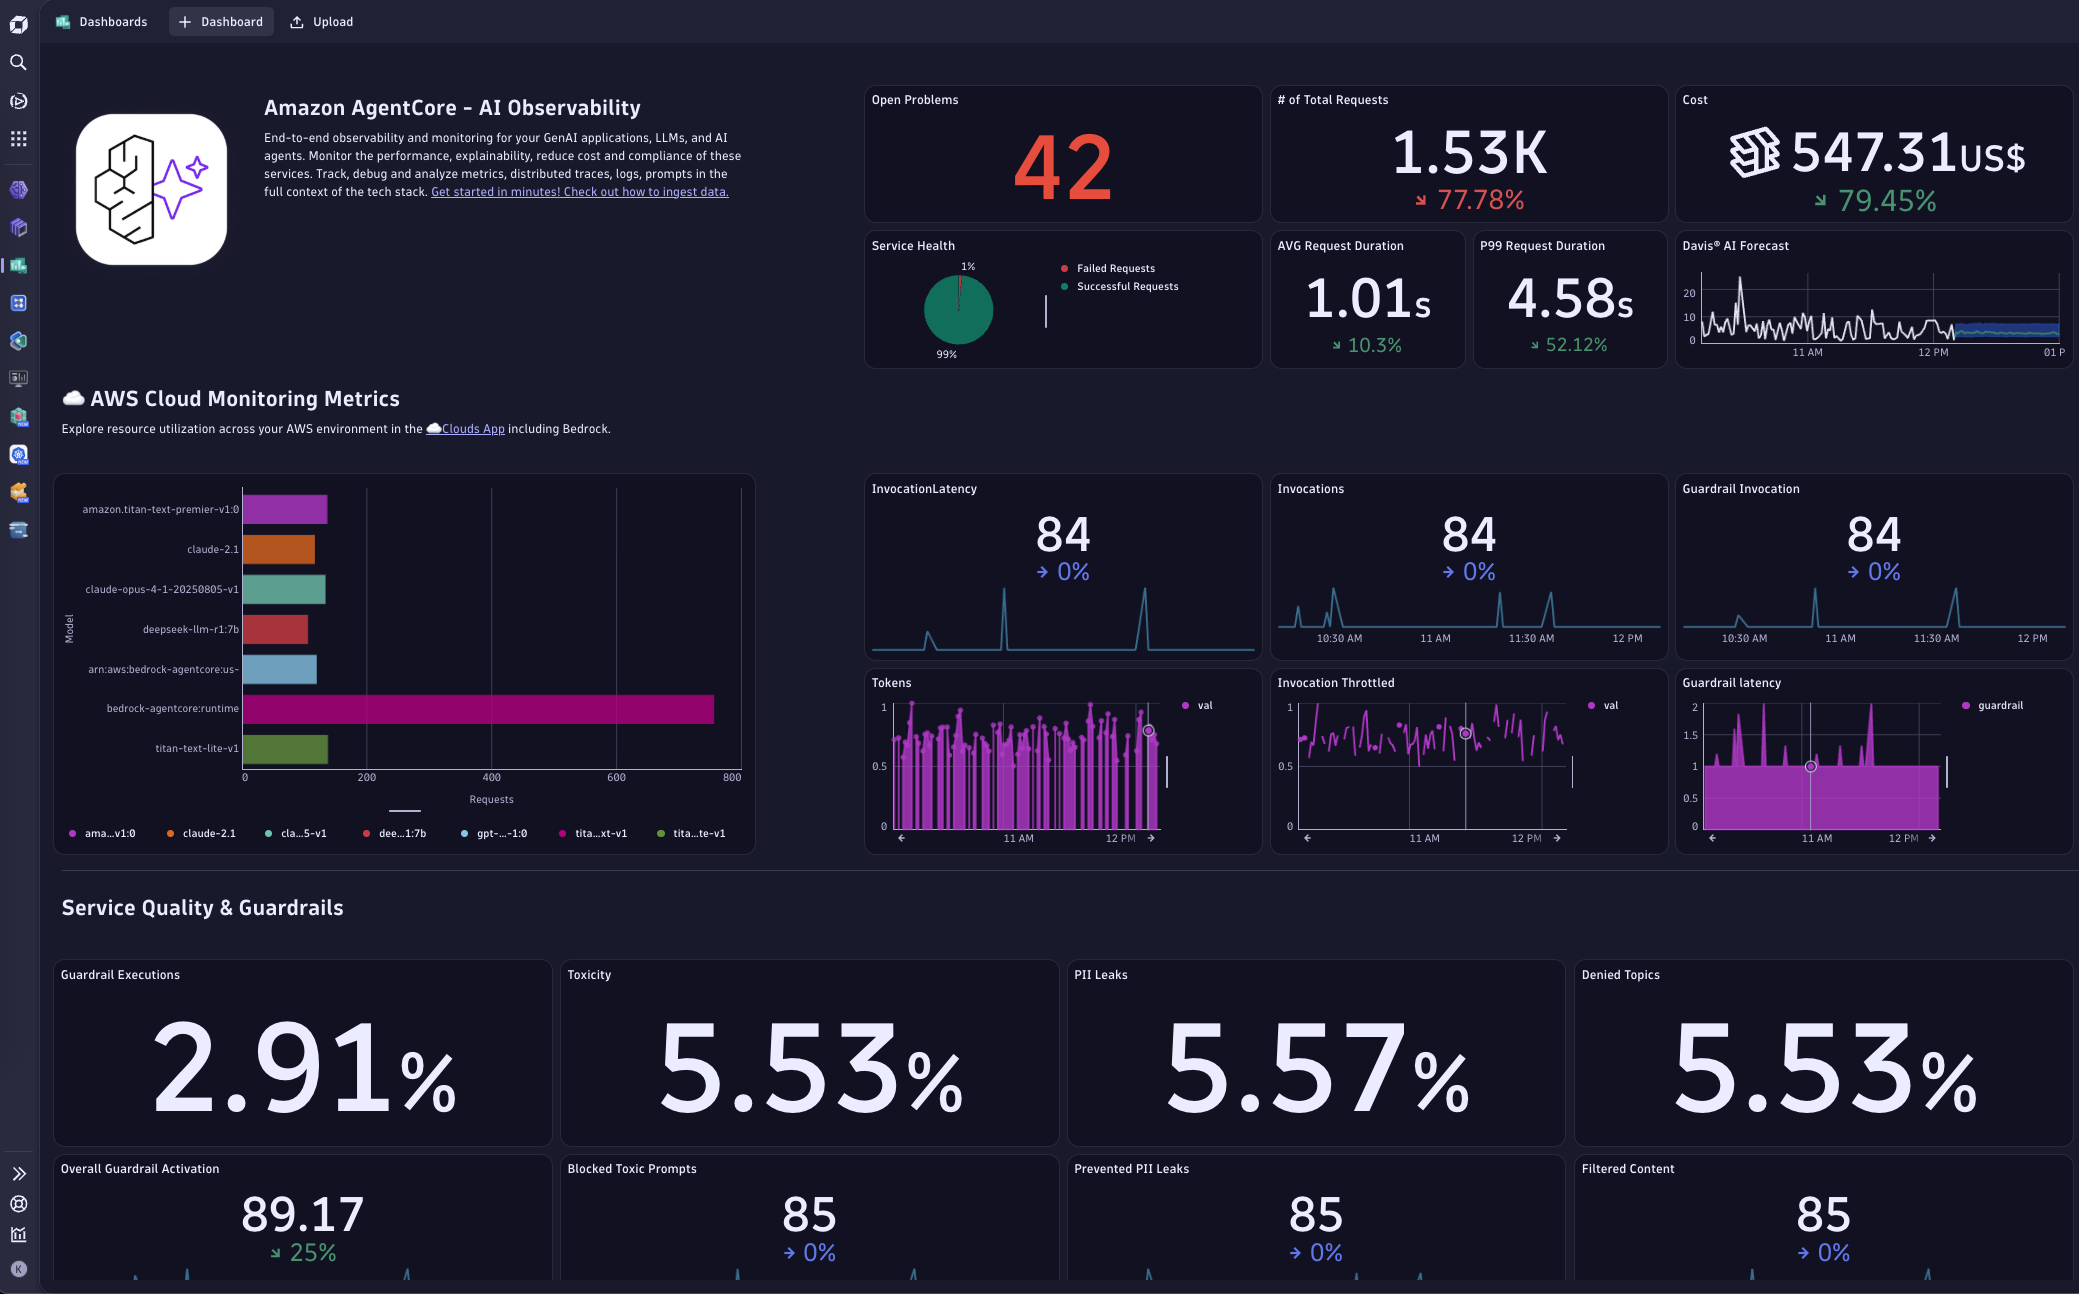
The new Dynatrace AI Observability app embeds Amazon Bedrock AgentCore observability into a dedicated end-to-end experience, featuring out-of-the-box analytics, auto-instrumentation, targeted GenAI metrics, debugging flows, and ready-made dashboards to address all observability gaps in agent deployments. Support is available for over 20 technologies, including Amazon Bedrock, OpenAI, Gemini/Vertex, Anthropic, and LangChain.
These enhancements enable teams to take advantage of the following benefits:
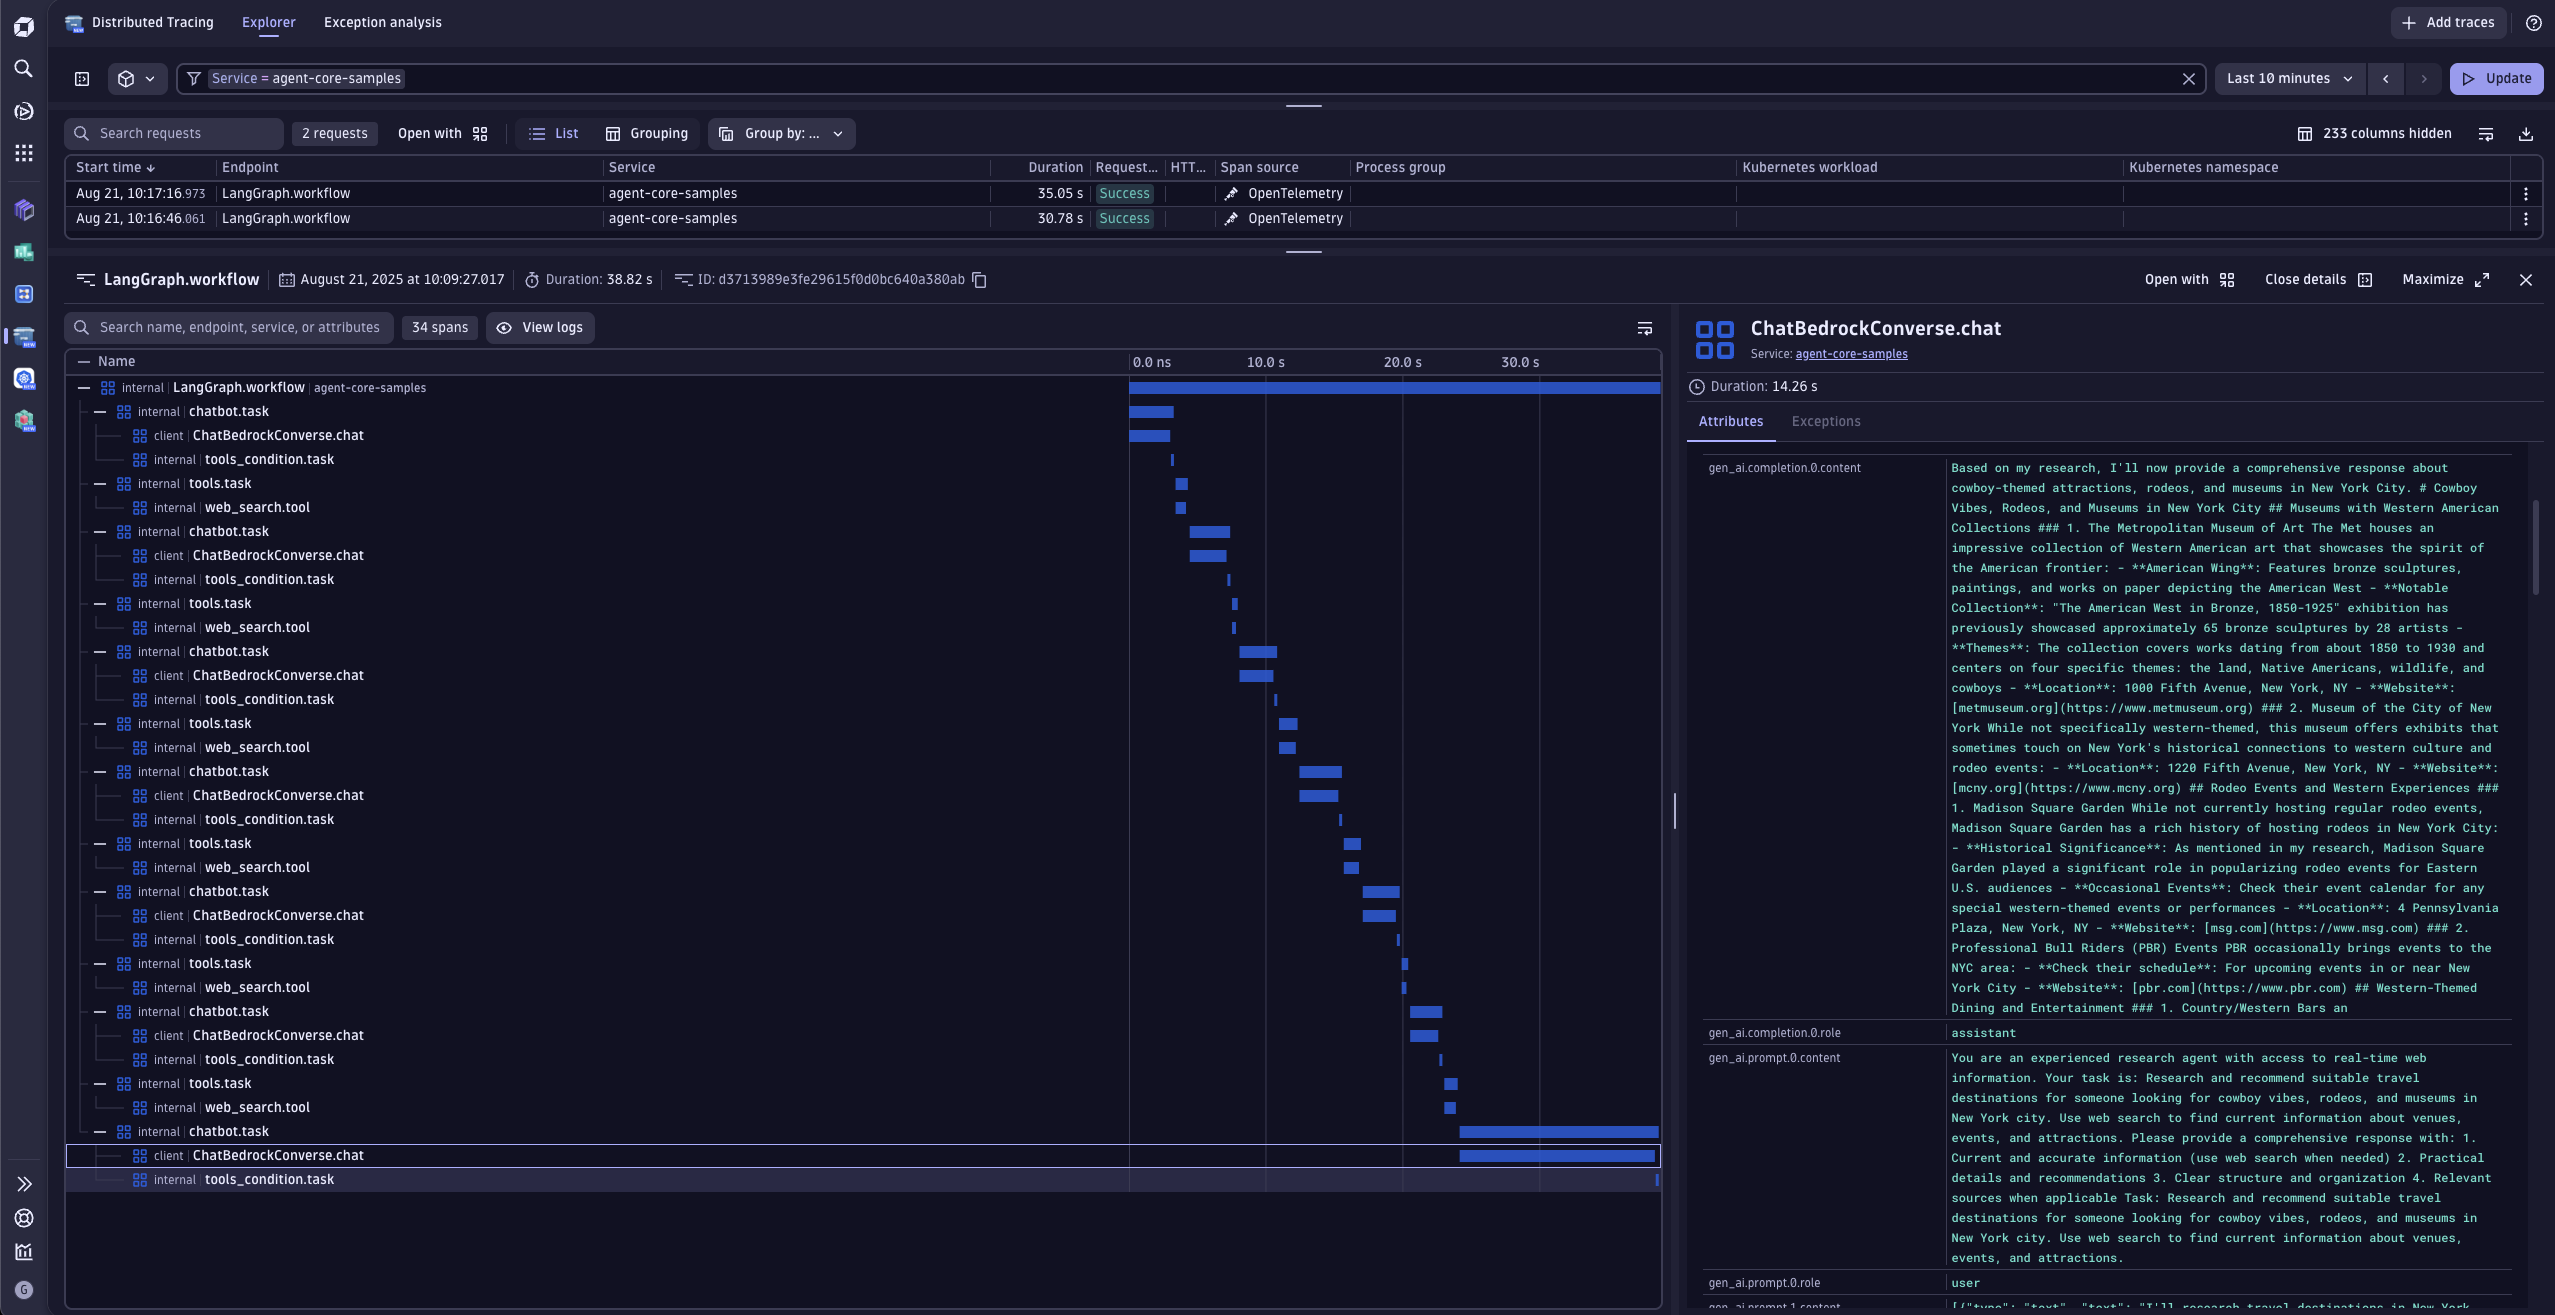
- End-to-end distributed tracing
Trace every interaction from user prompt to model reasoning to tool calls, so you can pinpoint bottlenecks, errors, or costly loops in seconds. Filter by model, provider, token usage, latency, and more to accelerate root-cause analysis. - Enriched GenAI telemetry data, out of the box
Each LLM and tool invocation emits spans with prompts, completions, token counts (for both prompts and completions), finish reasons, model IDs, latency, and errors, utilizing GenAI semantic attributes. Orchestration layers (for example, actions, HTTP durations, and step names) are captured for the complete workflow context. - Cost, performance, and safety insights
Use intelligent forecasting to detect cost and performance anomalies in token consumption and latency. Monitor guardrails for toxicity, PII, and denied topics to build trust and meet compliance requirements. - Simple OTLP setup, fast time to value
AgentCore already emits telemetry; simply register the OpenTelemetry export to Dynatrace once. Use your Dynatrace OTLP endpoint and token, and you’re streaming signals into the Dynatrace Grail® data lakehouse with no code rewrites. Ready-made dashboards for Amazon Bedrock let you verify ingestion and gain instant insights.
What’s next
We’re investing in a deeper Amazon Bedrock model and provider insights, expanded guardrail analytics, and additional automation so you can attach remediation playbooks to cost or safety anomalies.
Additionally, we’ll introduce a new agent visualization and topology experience that visualizes your AgentCore agents, LLM services, tool backends, and dependencies, allowing you to understand real-time topology and data flows across the entire stack.
Navigate from the topology map to traces to follow agent behavior step-by-step across services, protocols, and external calls, pinpointing hotspots, ownership, and blast radius more quickly.
Expect tighter integrations with popular orchestration frameworks and more dashboards for common agent patterns, such as retrieval, multi-agent collaboration, and tool-heavy workflows.
Get started with Dynatrace AI Observability for Amazon Bedrock AgentCore agents
Ready to learn more? Have a look at our GitHub repository.
Start instrumenting your agents today. Open the Amazon Bedrock AI Observability dashboard in Dynatrace to verify telemetry and begin your analysis.


Looking for answers?
Start a new discussion or ask for help in our Q&A forum.
Go to forum