
For quite some time already, Dynatrace has provided full observability into AWS services by ingesting CloudWatch metrics that are published by AWS services. Amazon CloudWatch gathers metric data from various services that run on AWS. Dynatrace ingests this data to perform root-cause analysis using the Dynatrace Davis® AI engine.
Before now, CloudWatch metrics were periodically pulled from AWS to Dynatrace Clusters on a user-defined polling schedule. This allowed for the best balance between reactivity and performance, however, for some services, like AWS Lambda or Amazon EC2, even faster reactivity is required.
We’re happy to announce that Dynatrace is now a launch partner for Amazon CloudWatch Metric Streams. This allows for fast and direct push of metric data from the source to Dynatrace.
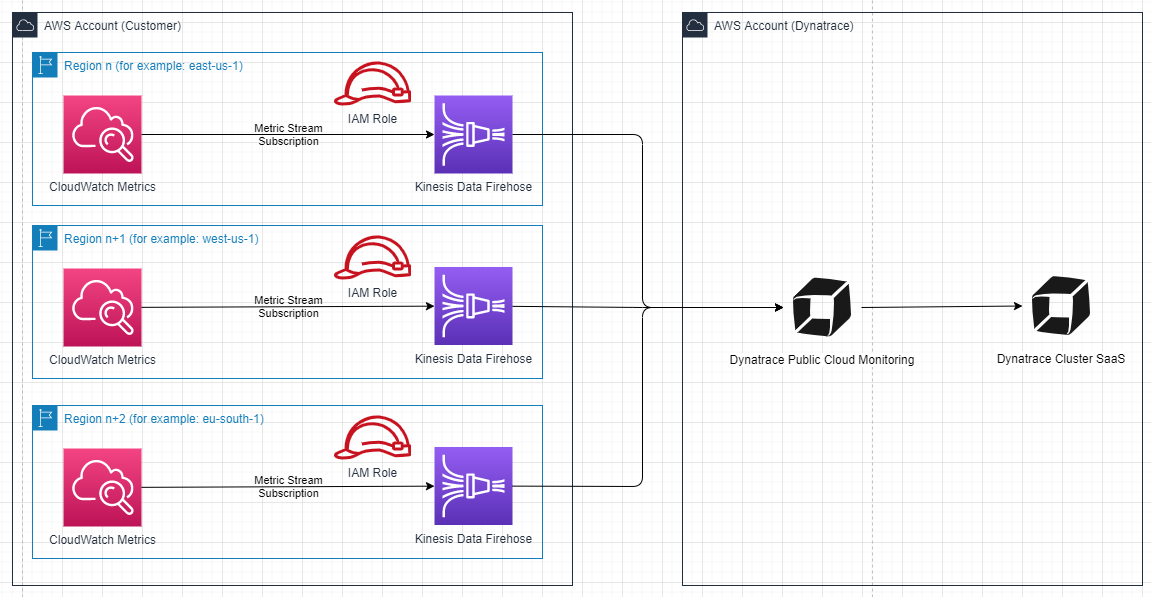
What is Amazon CloudWatch Metric Streams?
CloudWatch Metric Streams delivers data quickly by forwarding it directly to a Dynatrace endpoint using Amazon Kinesis Data Firehose. Dynatrace begins analyzing incoming data within minutes of CloudWatch data generation.
Thanks to centralized configuration, near real-time availability of all services, and potential cost optimization, metric streaming is now the future of performance data distribution. Currently Dynatrace requests CloudWatch data every five minutes.
Additionally, data ingest configuration doesn’t need to be complex. Detailed documentation and complicated manual configurations aren’t required. For Metric Streams, you only need to run a CloudFormation script that creates the complete Dynatrace configuration stack for you.
How to get started
Amazon CloudWatch Metric Streams provides an easy way to deliver metric streams to Dynatrace. Hence, the setup is quite simple.
Syntax of the CloudFormation deployment:
aws cloudformation deploy --capabilities CAPABILITY_NAMED_IAM --template-file ./dynatrace-aws-metric-streams-client.yaml --stack-name <your_stack_name>
--parameter-overrides DynatraceEnvironmentUrl=<tenant_url> DynatraceAPIKey=<tenant_api_token>
Just replace the placeholder values in the code snippet above with your specific values:
your_stack_name– Name of the CloudFormation stacktenant_url– URL of your Dynatrace SaaS environment, for examplehttps://abc12345.live.dynatrace.comtenant_api_token– Access token for pushing data to the Dynatrace Cluster
Example
aws cloudformation deploy --capabilities CAPABILITY_NAMED_IAM --template-file ./dynatrace-aws-metric-streams-client.yaml --stack-name MetricStreamDynatraceDelivery
--parameter-overrides DynatraceEnvironmentUrl=https://abc12345.dynatrace.live.com DynatraceAPIKey=AD..SF
Here you can see an example of a created stack.
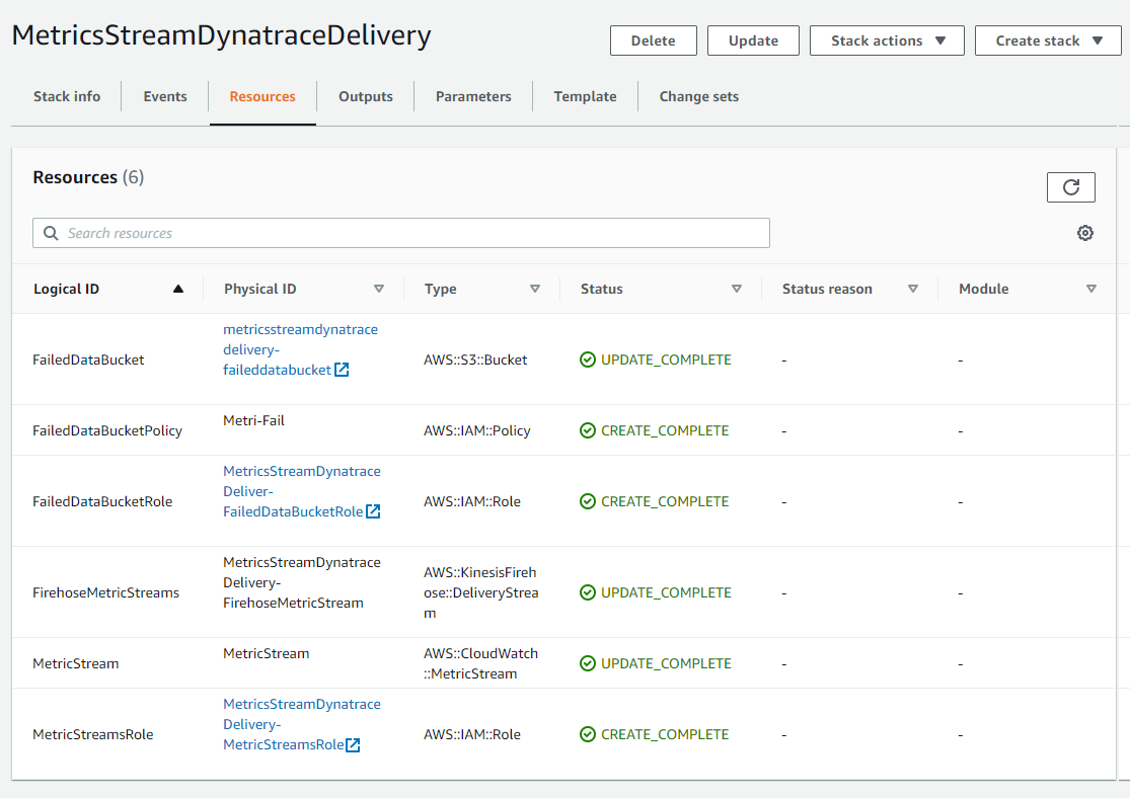
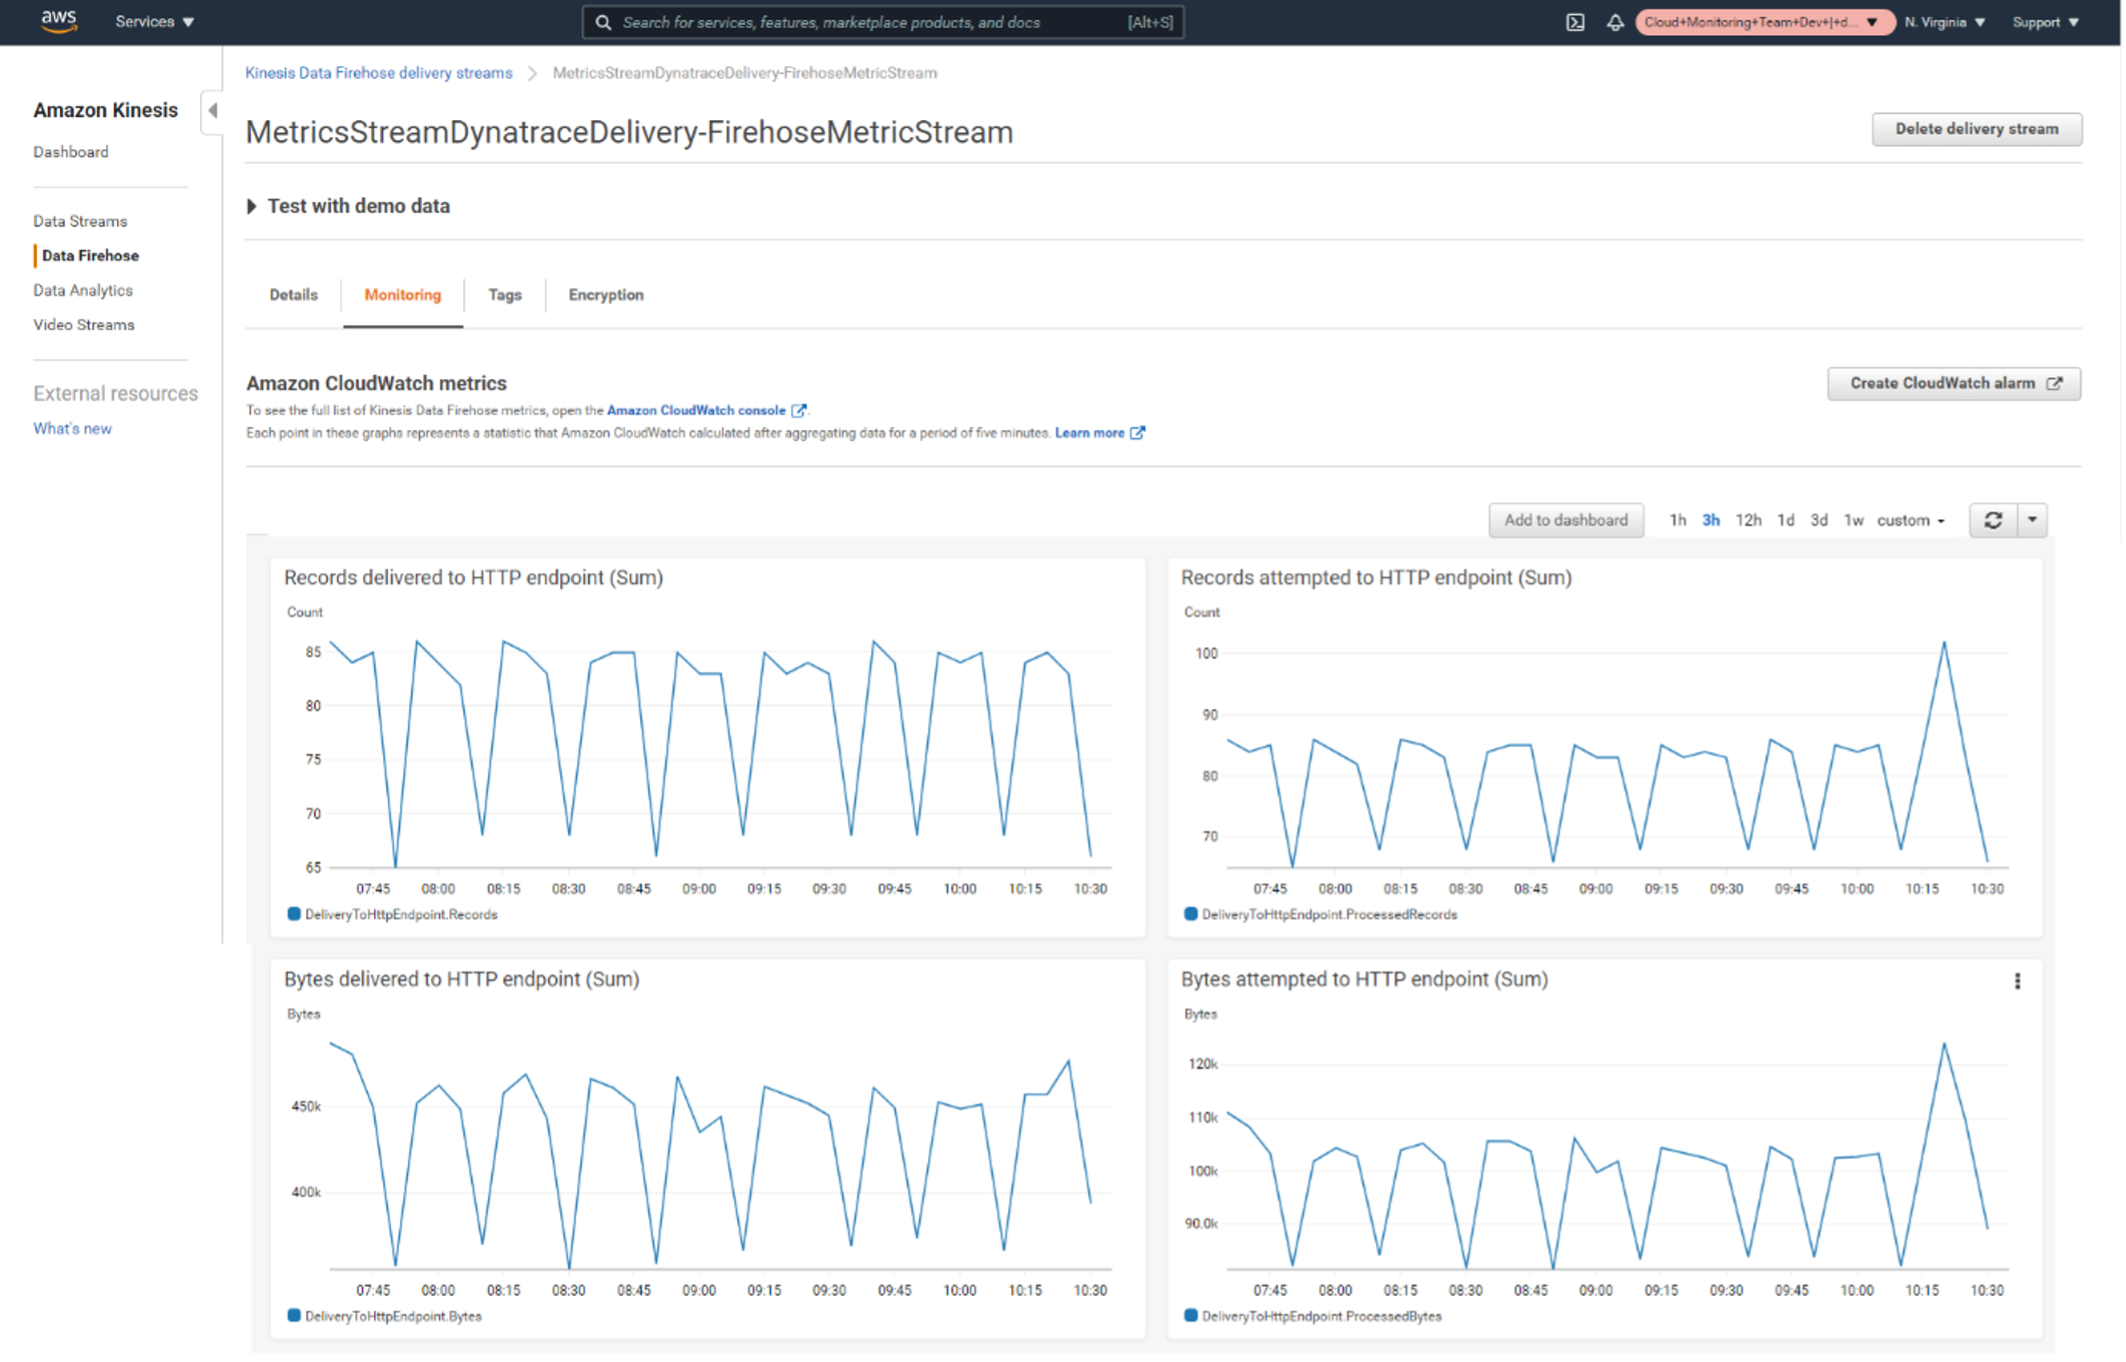
An Amazon Kinesis Data Firehose delivery stream is then created automatically.
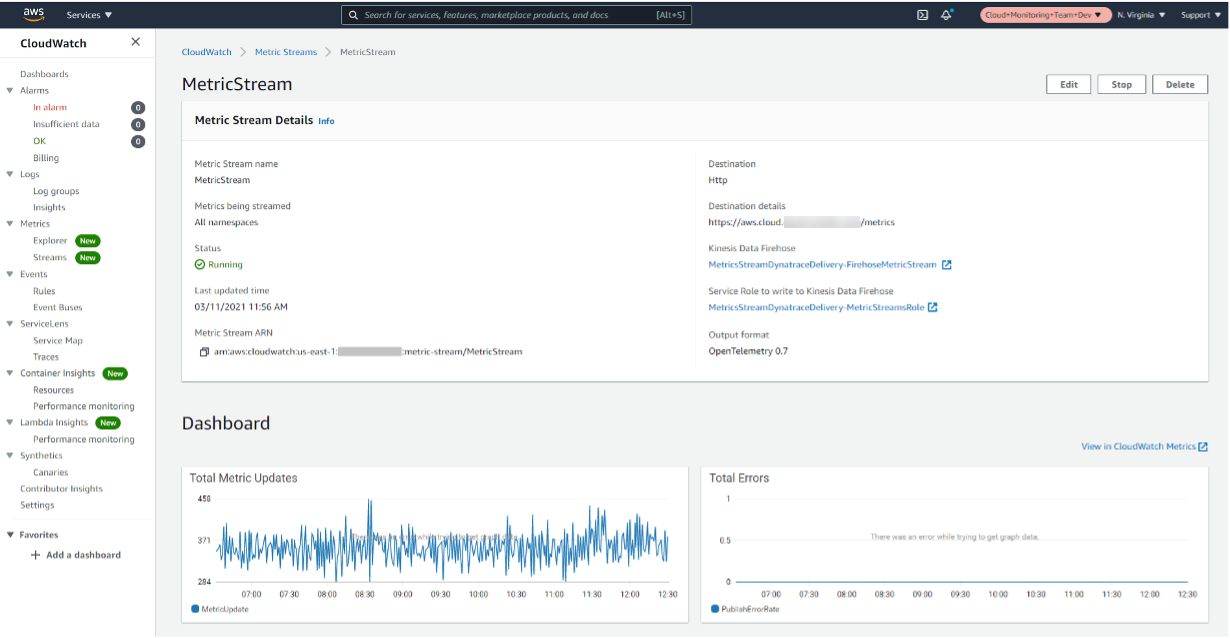
Amazon CloudWatch Metric Streams can be managed from your CloudWatch console in AWS.
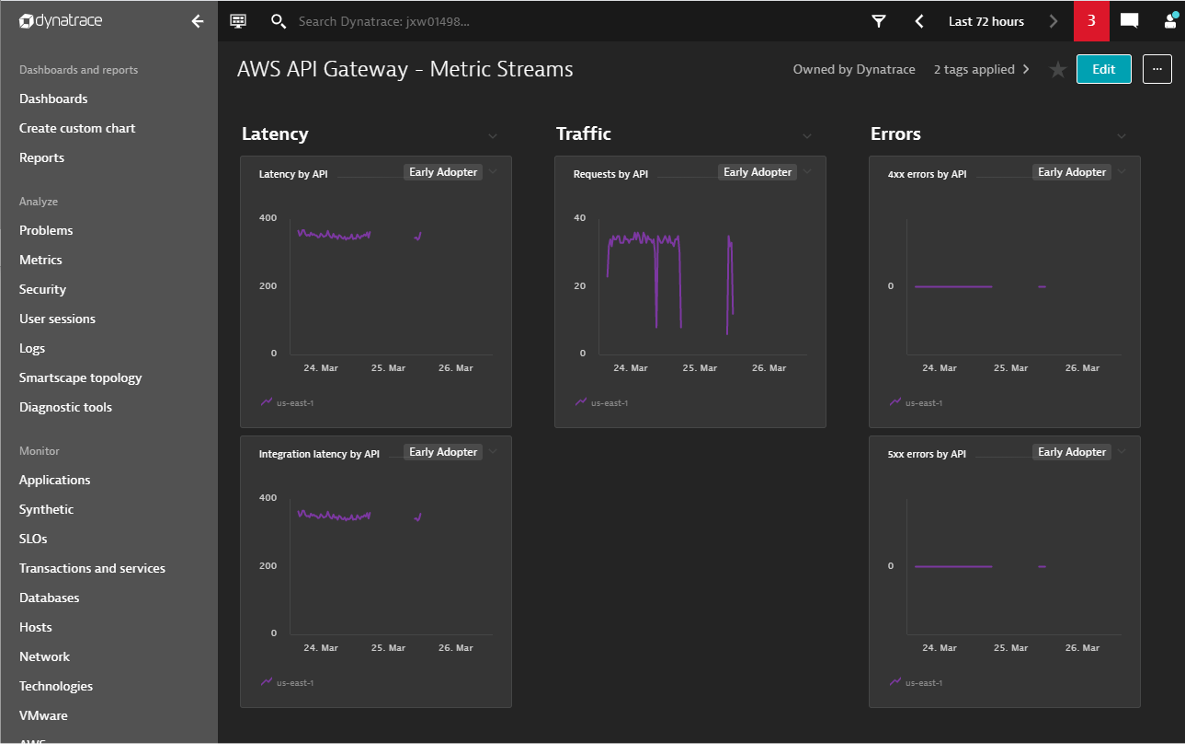
In the Dynatrace web UI, you can use predefined dashboard presets to visualize your ingested data.
What’s next?
We look forward to hearing from you regarding how Amazon CloudWatch Metric Streams can simplify your AWS cloud monitoring configuration. So, please don’t hesitate to post your feedback in the Dynatrace Community. Or, contact a Dynatrace ONE product specialist via in-product chat.
Meanwhile, Dynatrace is working closely with AWS to shape the future of Amazon CloudWatch. And we look forward to improving the experience of data ingest for AWS cloud.


Looking for answers?
Start a new discussion or ask for help in our Q&A forum.
Go to forum