
When onboarding network devices for observability, challenges often arise related to inconsistent or partial monitoring coverage or inefficient processes.
Such challenges make it difficult to ensure that all devices are properly and uniformly monitored and can provide actionable insights. Managing network devices at scale exacerbates the problem, as organizations contend with thousands of devices from a diverse range of vendors. This can have an adverse impact on your ability to maintain and troubleshoot your networks.
Network monitoring tools often lack integration with the rest of the infrastructure, making it even more challenging to analyze network monitoring data in context.
To achieve consistent, end-to-end monitoring, you need a tool that allows deterministic network observability and automatically contextualizes all ingested data. Let’s take a look at how Dynatrace does this.
Simplified and accelerated network monitoring
When onboarding network devices to an observability platform, it’s not uncommon to spend a disproportionate amount of time configuring network observability. Despite spending valuable time in the process, the uncertainty that some devices might be overlooked remains. Furthermore, in today’s dynamic environments, devices can be added or removed at a moment’s notice and at a rapid pace. This creates a burden for the operations team to constantly prove that the level of observability is at the right level.
To gain a comprehensive overview of the state of observability across all your environments, Dynatrace has expanded the Discovery & Coverage application to include network device monitoring capabilities. This ensures that there are no blind spots in this domain and that no network device is left unmonitored.
The Discovery & Coverage app achieves that by scanning predefined IP ranges or subnets. Based on the outcome of the discovery process, the journey continues by offering the possibility to automatically onboard the right device extension and create Network Availability monitors. Statistics are provided for both extension and availability coverage, providing tangible data to measure the completion of the observability enablement process.
Manage network devices at scale across distributed environments
SNMP (Simple Network Management Protocol) provides a standardized framework for monitoring and managing devices on IP networks. Its simplicity, scalability, and compatibility with a wide range of hardware make it an ideal choice for network management across diverse environments.
However, managing and monitoring SNMP across devices from multiple vendors in large, distributed, or even siloed networks can become cumbersome. Additional complexity is introduced when various teams own and manage their load-balancing devices or application firewalls and core switches individually.
Historically, IP Address Management (IPAM) tools have been effective at mapping entire IP networks, but they struggle to leverage the observability potential of discovered endpoints. Health information on SNMP devices is often isolated, and discovered devices are not placed in the correct context or topology, thereby failing to fulfill the goal of the discovery process: associating SNMP device data with the IT environments where the devices reside. This is where Dynatrace excels.
Leverage the power of the Dynatrace platform for your SNMP devices
Driving tool consolidation and integrating auto discovery and monitoring into your observability solution reduces costs and boosts operational excellence. Additionally, using the Discovery & Coverage app for auto discovery of networking devices means you’ll spend less time manually tracking devices and reduce the chance of lacking the right extension or using the wrong extension for a device.
The Dynatrace end-to-end observability approach makes your discovered network devices available in Dynatrace Grail® and the Dynatrace platform, allowing you to build innovative functionality while simultaneously reducing tool sprawl.
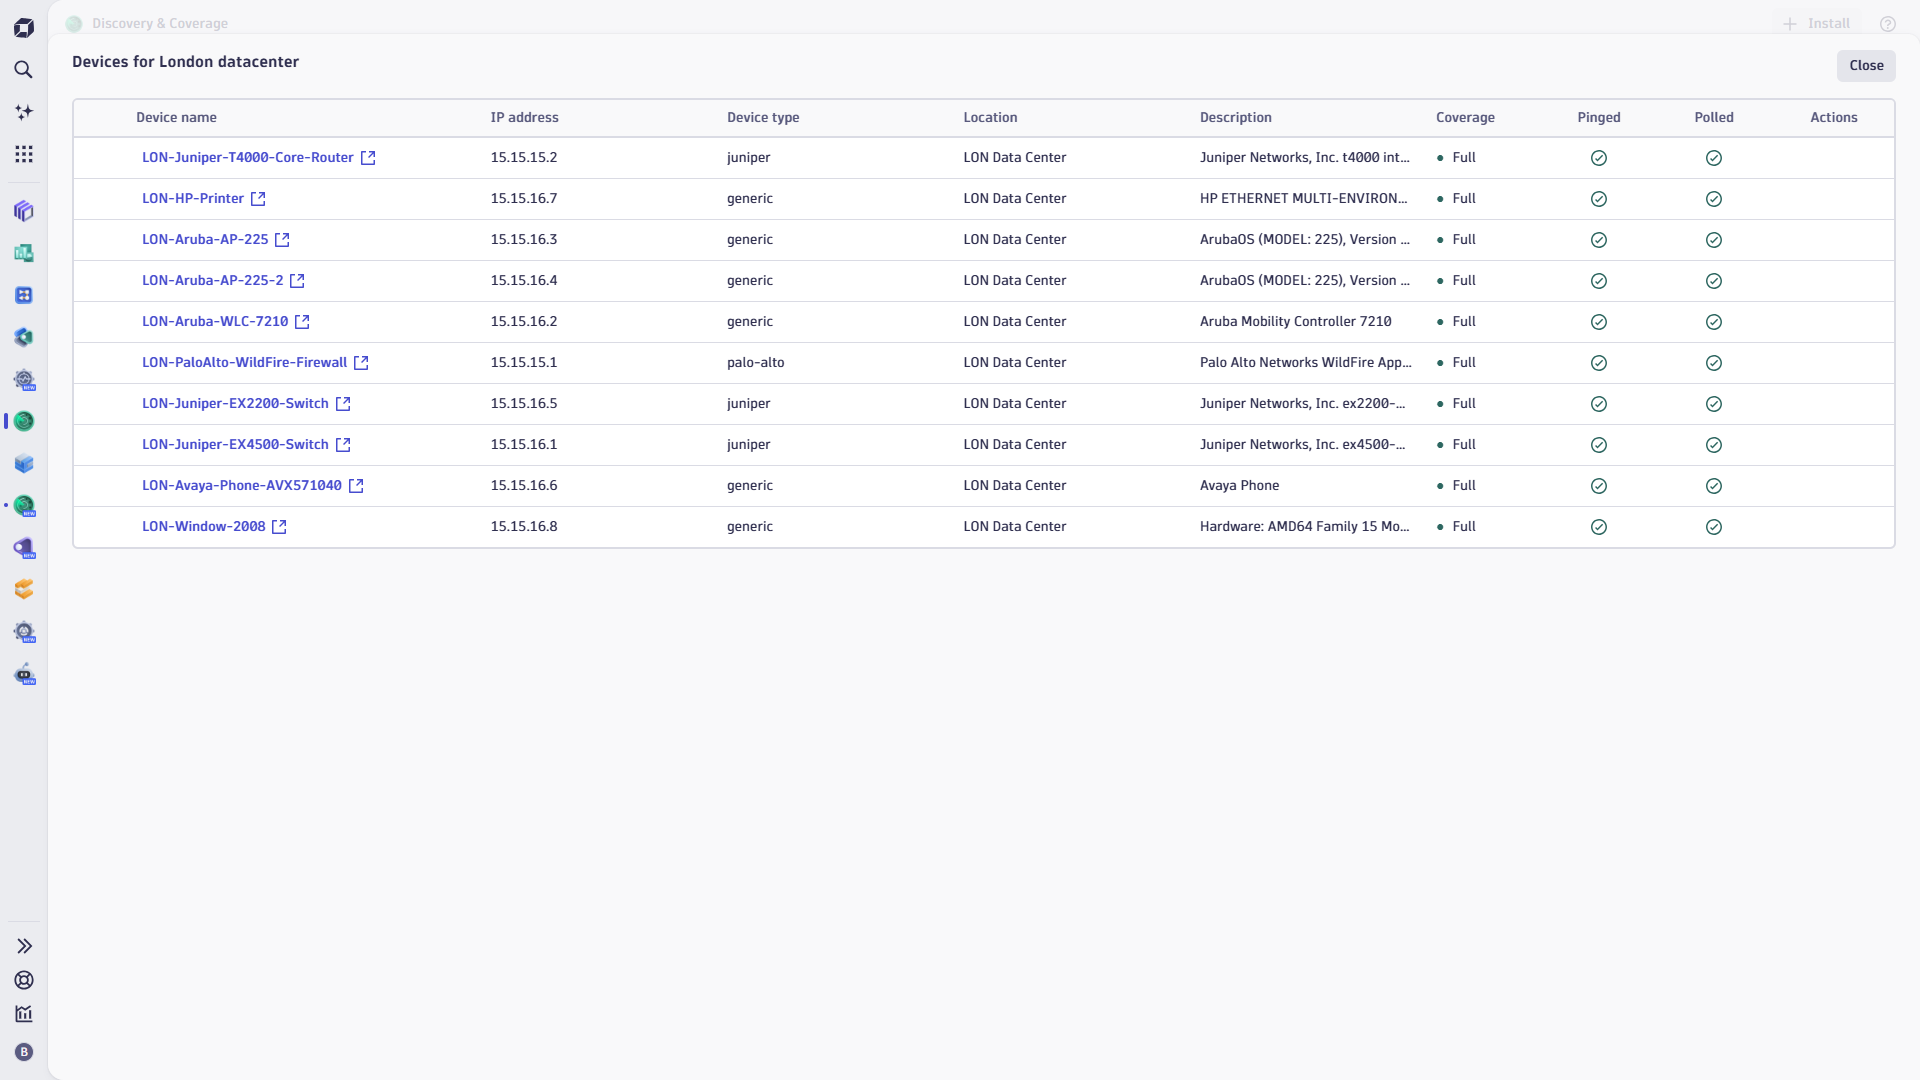
Your discovered devices appear in the Infrastructure and Operations app as network devices, with essential properties automatically populated. Dynatrace and vendor-provided extensions offered in Dynatrace Hub can enhance the observability level and insights of your individual devices. Further, you’re automatically notified when predefined thresholds are exceeded or when anomalies are detected.
Your network devices will function as part of an integrated network, not as standalone entities. For Dynatrace SaaS customers, network devices are readily available in Grail and can be queried using Dynatrace Query Language (DQL) to create value-added insights in the Davis Anomaly Detection app or to create automations and workflows, such as auto-generated tickets for external systems or notifications sent to teams via Slack or PagerDuty.
Get started with network device autodiscovery in Dynatrace
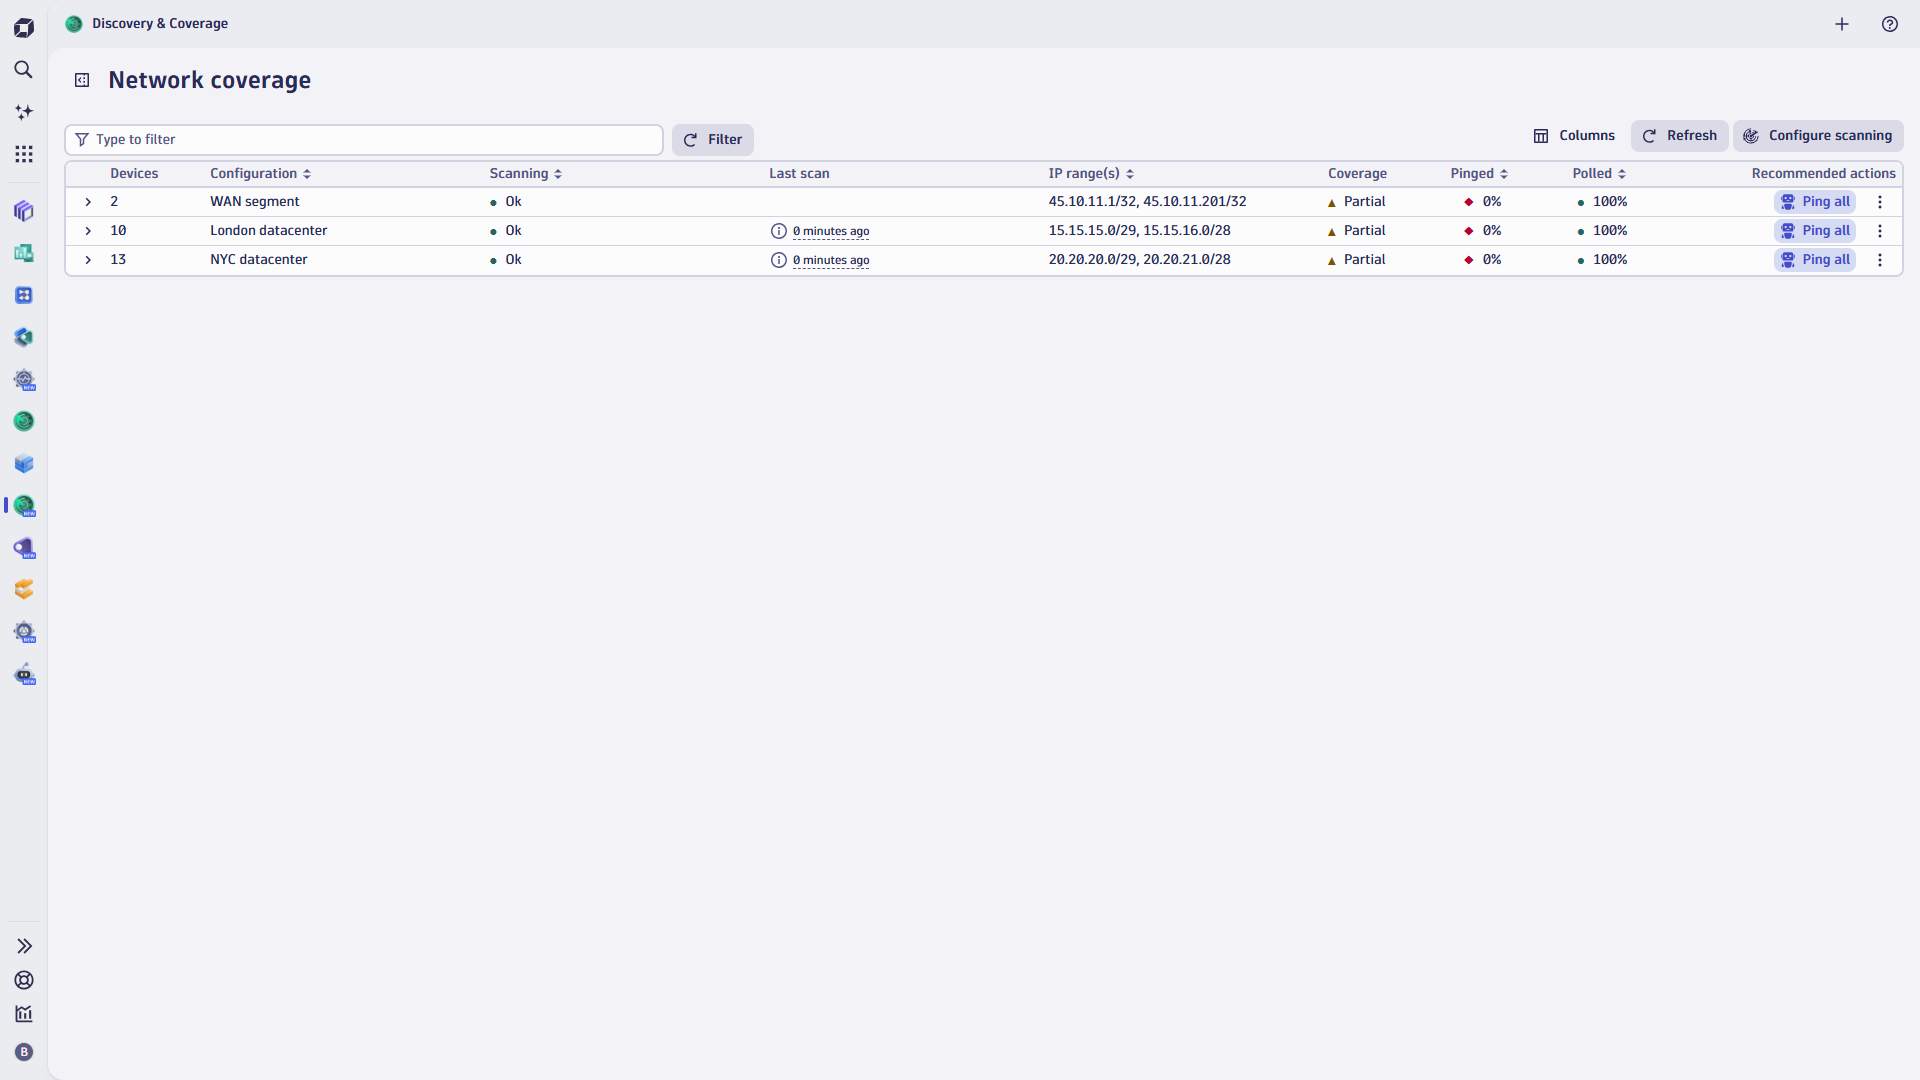
The SNMP autodiscovery capability is provided by the Discovery & Coverage app. Open the app, navigate to the Network coverage tab, and select Configure scanning.
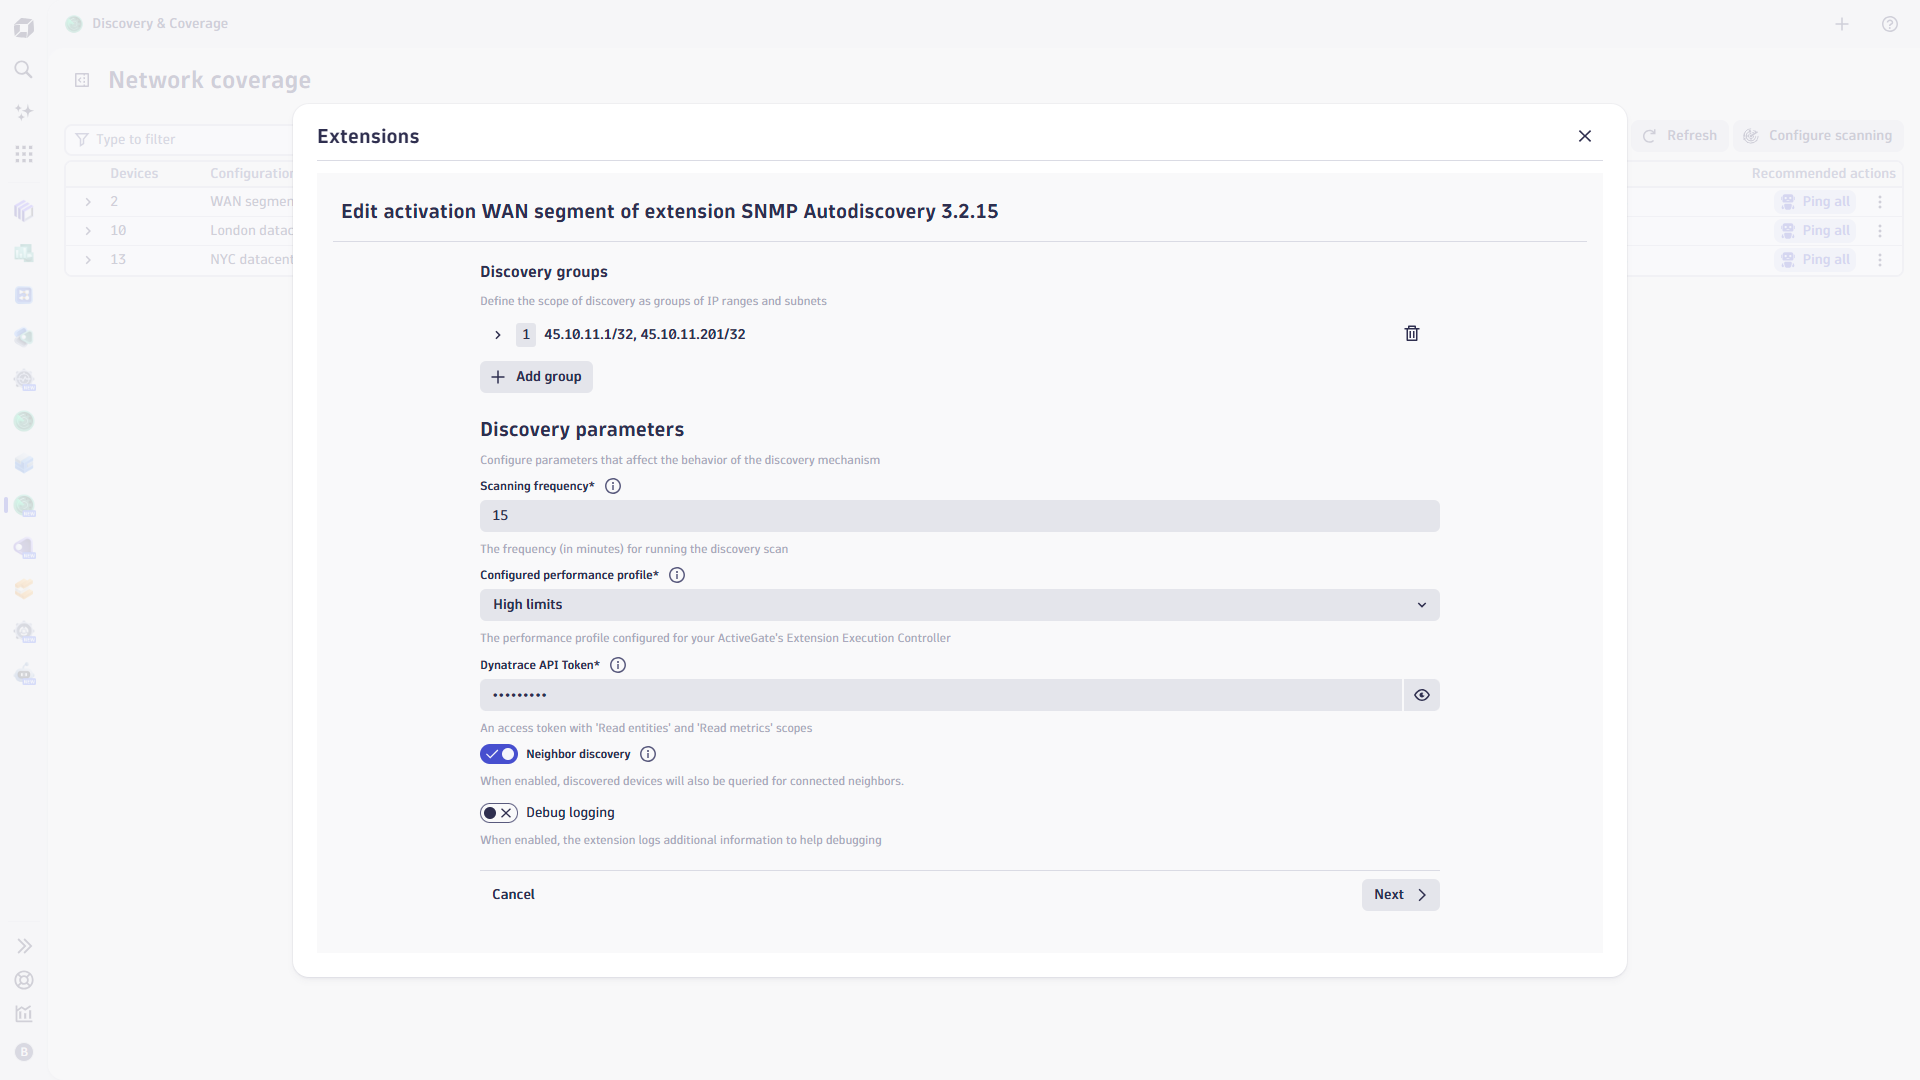
Once a configuration is activated, the discovery process begins.
The SNMP Autodiscovery extension regularly scans your IPv4 and IPv6 address lists, ranges, or subnets for devices with SNMP agents. If devices with matching SNMP parameters are present, they will be added to the environment.
Coverage reports for each device configuration provide an overview of the level of observability for each discovered device, answering questions such as: Is each device polled with the correct extension? Or, is the Network Availability Monitor installed on the management interface?
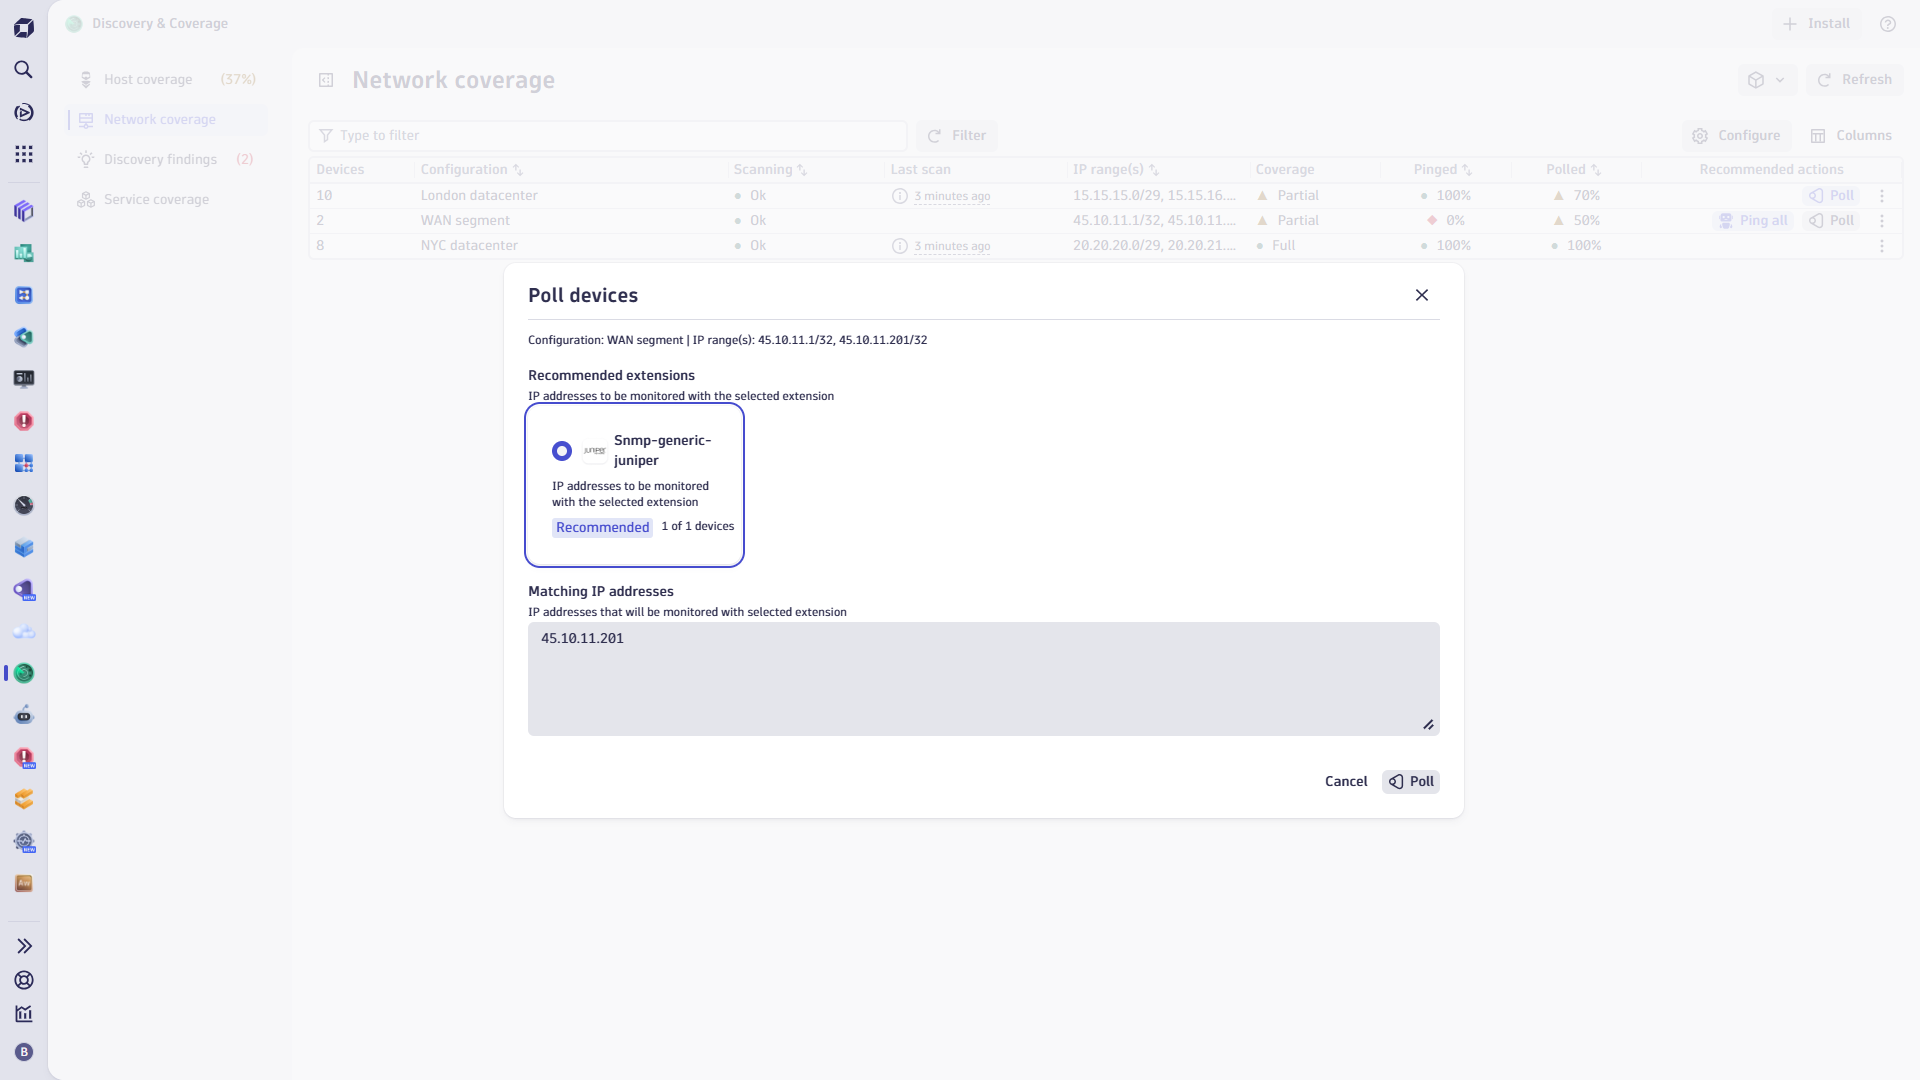
The Discovery & Coverage app allows you to add a device type-matching extension in bulk. The Poll icon opens the following windows, enabling the specific extensions with one select.
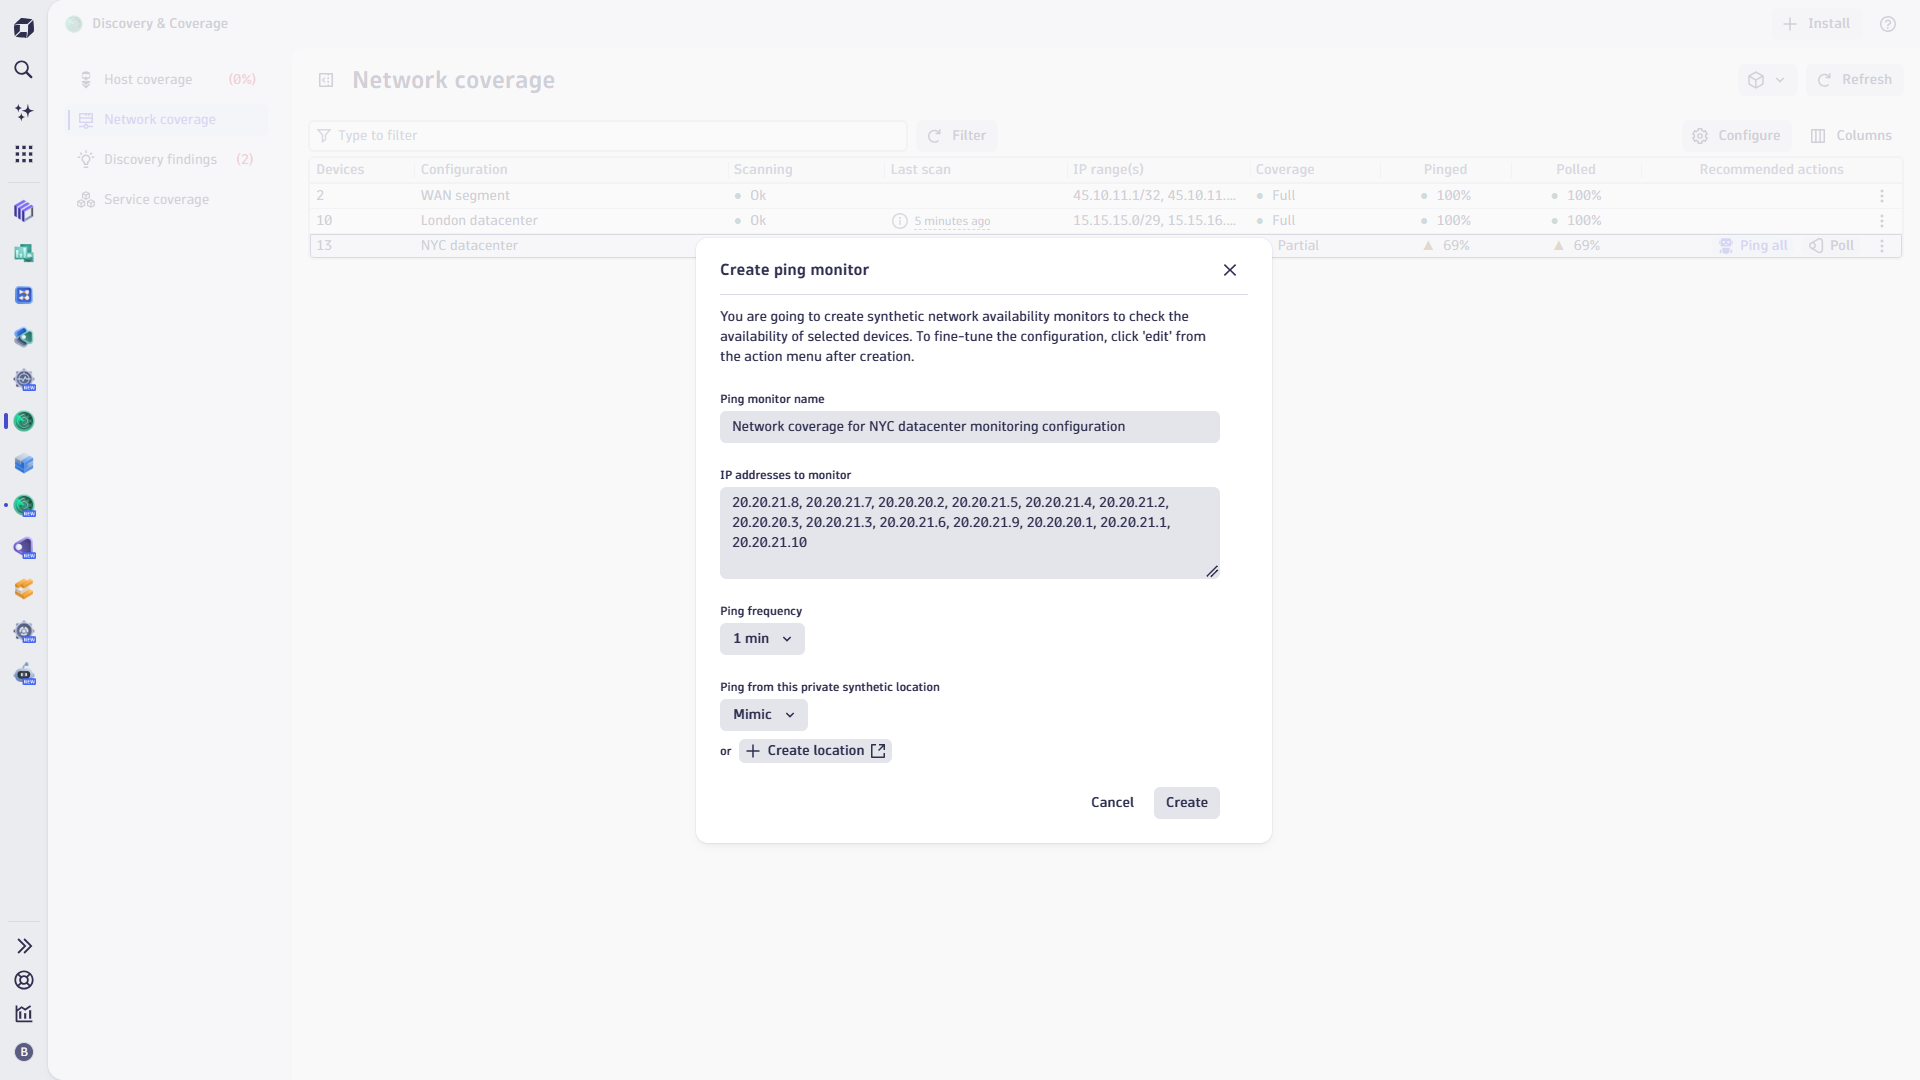
Additionally, you can centrally configure Network Availability Monitors (NAM) to continuously probe the health and availability of your devices. This ranges from simple ICMP ping tests to advanced probes, depending on your requirements and setup.
Take the first step to simplifying device onboarding
SNMP network device autodiscovery is a powerful tool for network administrators. It simplifies network management, improves efficiency, and allows for easy scalability. By leveraging this feature, organizations today ensure their networks are always accurately represented and observed.
Remember, a well-managed network with thorough observability and health monitors is the backbone of any successful organization. So, embrace the power of SNMP autodiscovery and take your network management to the next level!
If you have already deployed network observability using the extension apps, you need to download and open the Discovery & Coverage app. By configuring autodiscovery, you’ll ensure that no part of your network remains unattended and that you’ve configured the right level of observability in your environment. From now on, the Dynatrace network device onboarding process is greatly simplified and accelerated.
If you’re not yet a Dynatrace customer, consider starting a free trial, opening the Discovery & Coverage app, and navigating to the Network coverage tab. You can then immediately discover SNMP devices in one of your environment’s IP networks and add the right level of observability to the devices.


Looking for answers?
Start a new discussion or ask for help in our Q&A forum.
Go to forum