
The following is a response we received to one of our newsletters.
If you want to share your own Dynatrace success story, we would love to hear about it.
Enjoy!
Hi Martin,
there is no email address on the Dynatrace.com webpage, so your email-address from the periodic newsletter is the only one I have.
I run a small software developing company with less than 10 developers in Linz/Austria. The server being monitored offers e-commerce services to approximately 30 customers and hosts a quite heterogeneous collection of software services. Here in Austria we have a saying “Aus jedem Dorf einen Hund” (editor’s note: freely interpreted as “a little bit of everything”), technically speaking the machine is running IIS, Apache, Tomcat, Elasticsearch (ES), Logstash, MongoDB, PervasiveSQL, some “mature” web applications implemented in vanilla ASP and currently 12 tomcat instances. OS is Windows Server with 32 GB of RAM.
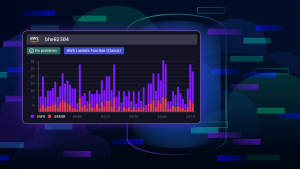
When we installed Dynatrace a few weeks ago, it immediately complained about Elasticsearch having too high GC times – we simply ignored it. The primary reason for ignoring the information that Dynatrace was very new and we’ve used ES for eight months without any problems. The other reason might have been that we’ve been doing our business for more than 10 years, all the services including ES performed – so no reason to think something could be wrong.
One day, my developer informed me, that the Elasticsearch did not respond anymore and he strongly disadvised to perform the scheduled deployment because without Elasticsearch we would not be able to monitor the health of our applications and their log statements in realtime.
Fortunately it was a Friday – so I had the whole weekend to deal with the issue. Saturday morning was dedicated to Elasticsearch. I tried to find out what’s wrong with this service. What I’ve learned the last years is that if you cannot solve a problem within 2 hours, you won’t solve it the next 10 hours unless you change your approach. So I remembered the Dynatrace message regarding the GC times. The rest was easy. GC is mostly related to low memory – so after optimizing the memory configuration of the system and re-enabling the functionality of our monitoring software we noticed less memory consumption, less CPU usage and ES was working again.
Good job Dynatrace.
Regards
Paul


Looking for answers?
Start a new discussion or ask for help in our Q&A forum.
Go to forum