
If you’ve ever set up an Apache HTTP server you know firsthand that configuring servers for optimum performance is a cumbersome process that depends on numerous parameters. So, how do you know if your server needs fine-tuning? Lots of great “Top 10 tuning tips” articles and “How to” guides can be found on the web to assist you in tweaking such performance issues. I’ll cover the basics for you here.
To be clear, my goal is not to start a discussion along the lines of “why don’t you replace your Apache with Nginx?” This is because there are simply so many Apache servers in operation currently that won’t be replaced anytime soon.
Track your server load
If you want to perform serious performance tuning, you need to measure basic performance indicators within real-world load scenarios. This means you need to ensure that your web server receives enough requests during testing so that you can measure the impact of requests on basic metrics like CPU, memory, and network traffic.
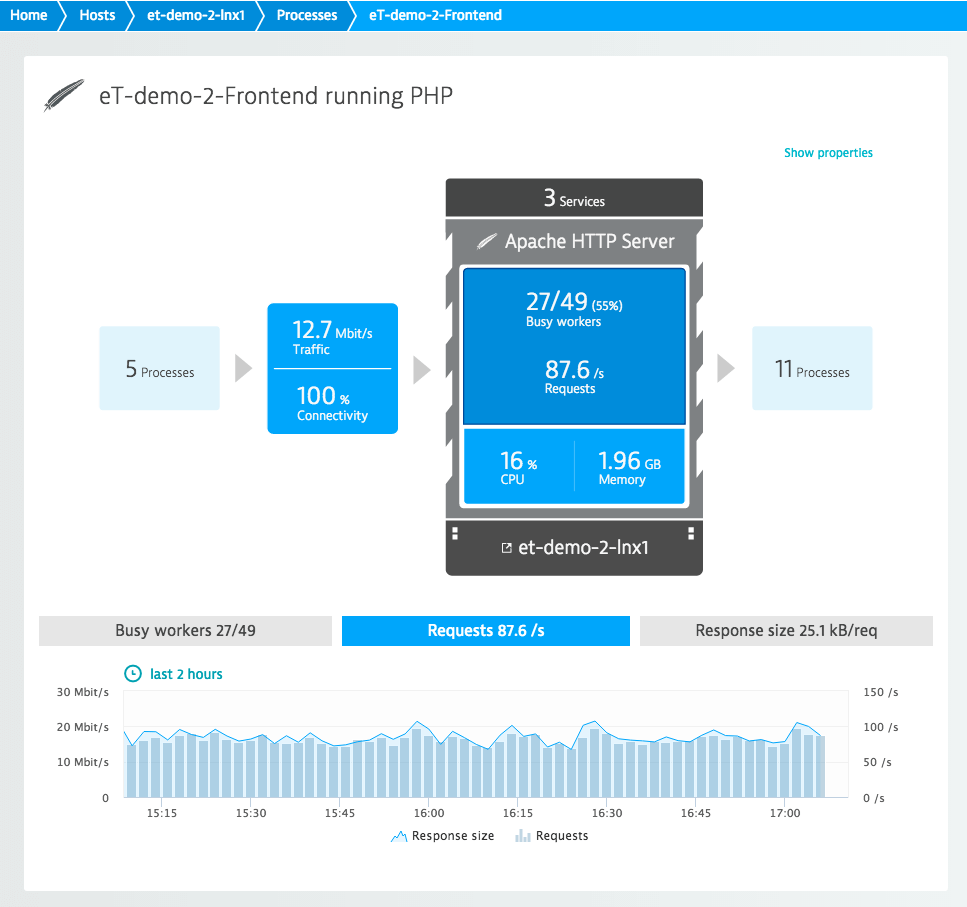
For this article, we set up an Apache HTTP server for use with a basic load of 80-100 requests per second (average 87.6 requests/second). This setting induces adequate CPU, memory, and network load for testing purposes.
Scaling with workers
The most important attribute of performance tuning is scalability. For Apache web servers, this means taking a look at the worker threads (or forked processes in the case of non-threaded servers). Increasing the amount of threads or processes allows you to manage higher loads, but it comes at the expense of memory (this is particularly important for forked processes). The more threads and processes you have, the more memory is consumed.
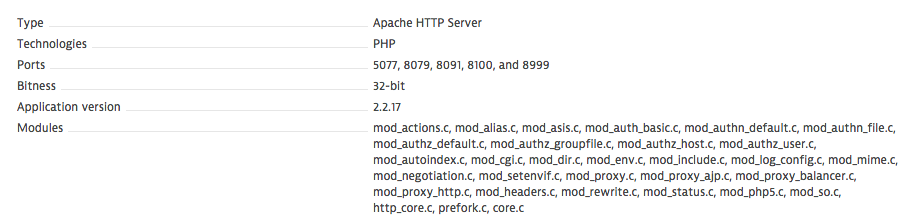
Apache’s default parameters for threads are:
StartServers 5 MinSpareServers 5 MaxSpareServers 10 MaxRequestWorkers 150 MaxConnectionsPerChild 0
The MaxRequestWorkers parameter dictates the maximum number of workers (processes or threads) that can handle Apache requests simultaneously. Refer to the Apache documentation for more information on this directive.
How many workers do you need?
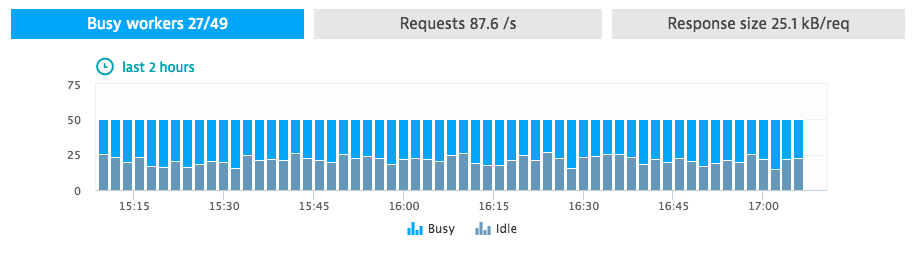
In our example, Apache instantiated 49 workers (only 27 busy workers, 22 idle workers).
With this number of instantiated workers, Apache can handle almost 160 requests per second without increasing the number of workers. Assuming the number of requests and the CPU time are linearly dependent, this leads to CPU consumption of about 30%.
However, the default configuration would allow 150 workers (about three times as many workers as Apache instantiated in our example). If you do the math, you come up with an estimate of about 90% CPU saturation resulting from requests from 150 workers. This is too high, so to be on the safe side, you should decrease the MaxRequestWorkers setting to about 120.
Dynamic vs. static requests
The actual impact on CPU may be higher depending on the nature of the requests. Are the requests dynamic, CPU/RAM intensive requests, or are they static disk/caching intensive requests?
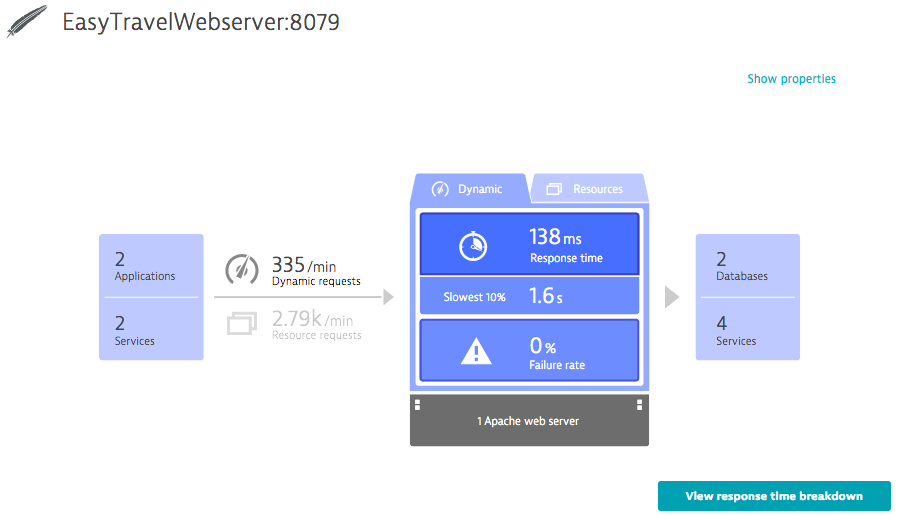
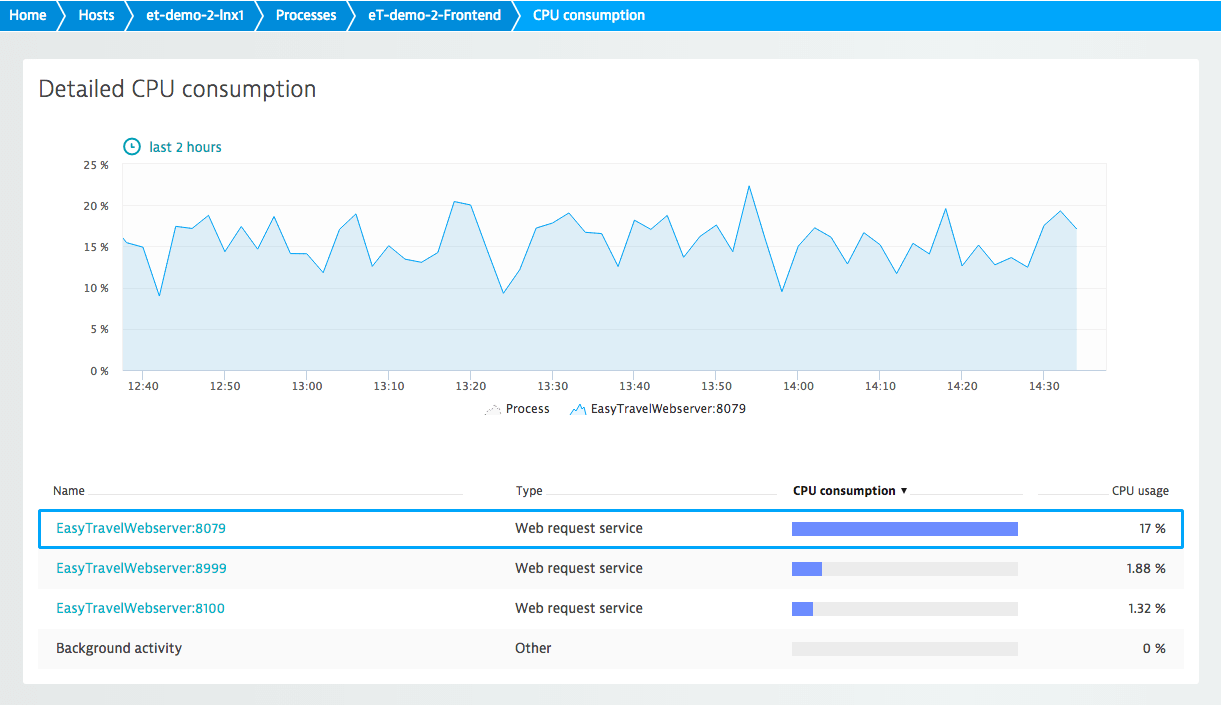
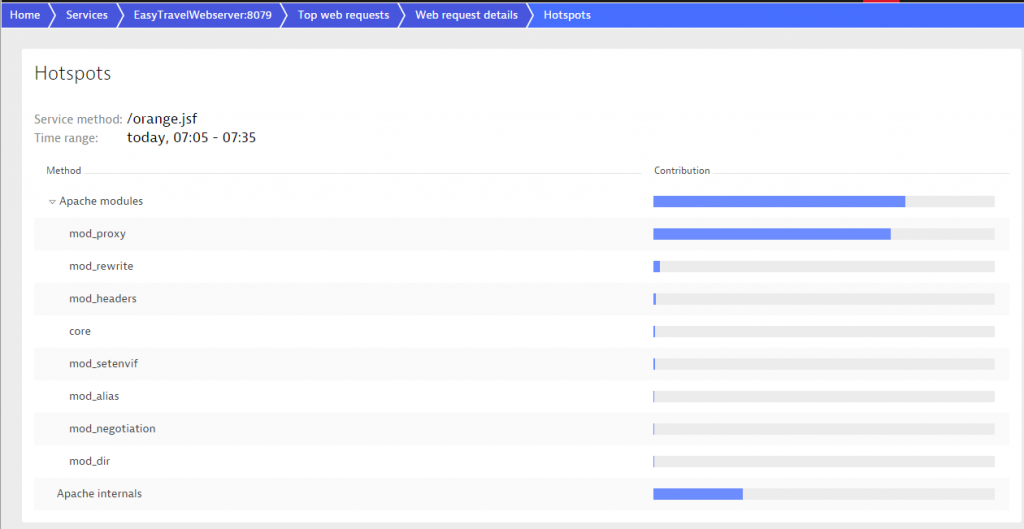
The service consuming the most CPU runs on port 8079. It has 335 dynamic requests per minute and 2,790 static requests per minute. With respect to CPU, the most potential for optimization lies within the algorithms that serve the dynamic requests. I’ll explore this topic further in a future blog post as this goes beyond Apache configuration and into code-level performance tuning.
For performance optimization of static requests, Apache provides caching modules.
Caching resources for requests: excursus
Various modules that are dedicated to caching commonly requested content exist in order to make subsequent requests faster. These are particularly helpful in making static requests faster. I’ll only provide some basic information on this topic here—configuring caching modules for Apache takes longer than 7 minutes.
- HTTP caching uses features of the HTTP protocol to minimize network traffic between the web server and browser and thereby reduces workload at the server end. The cacheability of the content (i.e., requested resources) is managed by the
mod_cachemodule, which builds up a three-state cache (i.e., fresh, stale, and non existent) for cacheable requests/response pairs. Use themod_expiresmodule to fine-tune the amount of time a resource should be considered fresh. This enables you to leverage the local browser cache by making use of themax-agedirective or theExpiresheader for caching in HTTP. - Key-value caching provides an object cache that is often used to cache SSL sessions and authentication details. The object cache can be made available server-wide or datacenter-wide.
- File caching enables you to preload a slew of frequently used static files into memory upon server startup and prevents the server from loading the same files from disk on each request. In environments with slow file systems, file caching allows you to improve performance. The module
mod_file_cacheis still experimental and requires you to restart your server each time you want to update a static file. This is a serious drawback, so use this module with care.
Review enabled modules
To save memory, review the list of modules that are loaded by default with your server processes and remove unnecessary modules.
To save more CPU time and optimize response time further, review the list of modules that are consulted for each request. The mod_rewrite module is one you should take a close look at. Unnecessarily complex regular expression rules can take quite some time to evaluate. Also, make sure all your rewrite rules are actually required and utilized.
Monitor your web server with Dynatrace
Continuously monitor Apache web server performance from both the key server-metrics’ perspective and the application perspective to gain insights into the backend. This enables you to ensure that your web server performs as expected in both low- and high-traffic scenarios. Also consider monitoring from the frontend, within your customers’ browsers. For details on this approach, take a look at Dynatrace Real User Monitoring.


Looking for answers?
Start a new discussion or ask for help in our Q&A forum.
Go to forum