

By default, a Kubernetes cluster allows any pod to reach any other pod. NetworkPolicy objects can restrict that traffic, but only if they are defined and enforced by the cluster’s networking layer. Without these policies, a web-serving workload can connect to a database even if it has no reason to access it.
Previous posts in this series focused on container-level misconfigurations. Part 2 covered privileged containers and dangerous capabilities, while Part 3 covered host namespace sharing and missing resource limits. But hardening a container doesn’t change what it can reach: a pod stripped of every privilege can still route to every database in the cluster.
This post moves from container hardening to network reachability. We use Kimera, an open-source Kubernetes security testing toolkit maintained by Dynatrace, to assess, exploit, remediate, and enforce Kubernetes security controls in authorized demo environments. Starting with one compromised workload, we show how an attacker can obtain a valid user session. Along the way, Dynatrace Kubernetes Security Posture Management (KSPM) identifies the missing network policies, while Smartscape shows the service calls involved in the application-mediated attack path. We then use Kimera to apply NetworkPolicy controls and test whether they block that path.
The Kubernetes networking model
The Kubernetes networking model is built on three requirements:
- Every pod gets its own IP address with no network address translation (NAT) within the cluster.
- All pods can communicate with all other pods.
- Node agents can reach all pods on their node.
Container Network Interface (CNI) plugins implement these requirements, deciding how pod networking is configured and, critically, whether network policies are enforced at all.
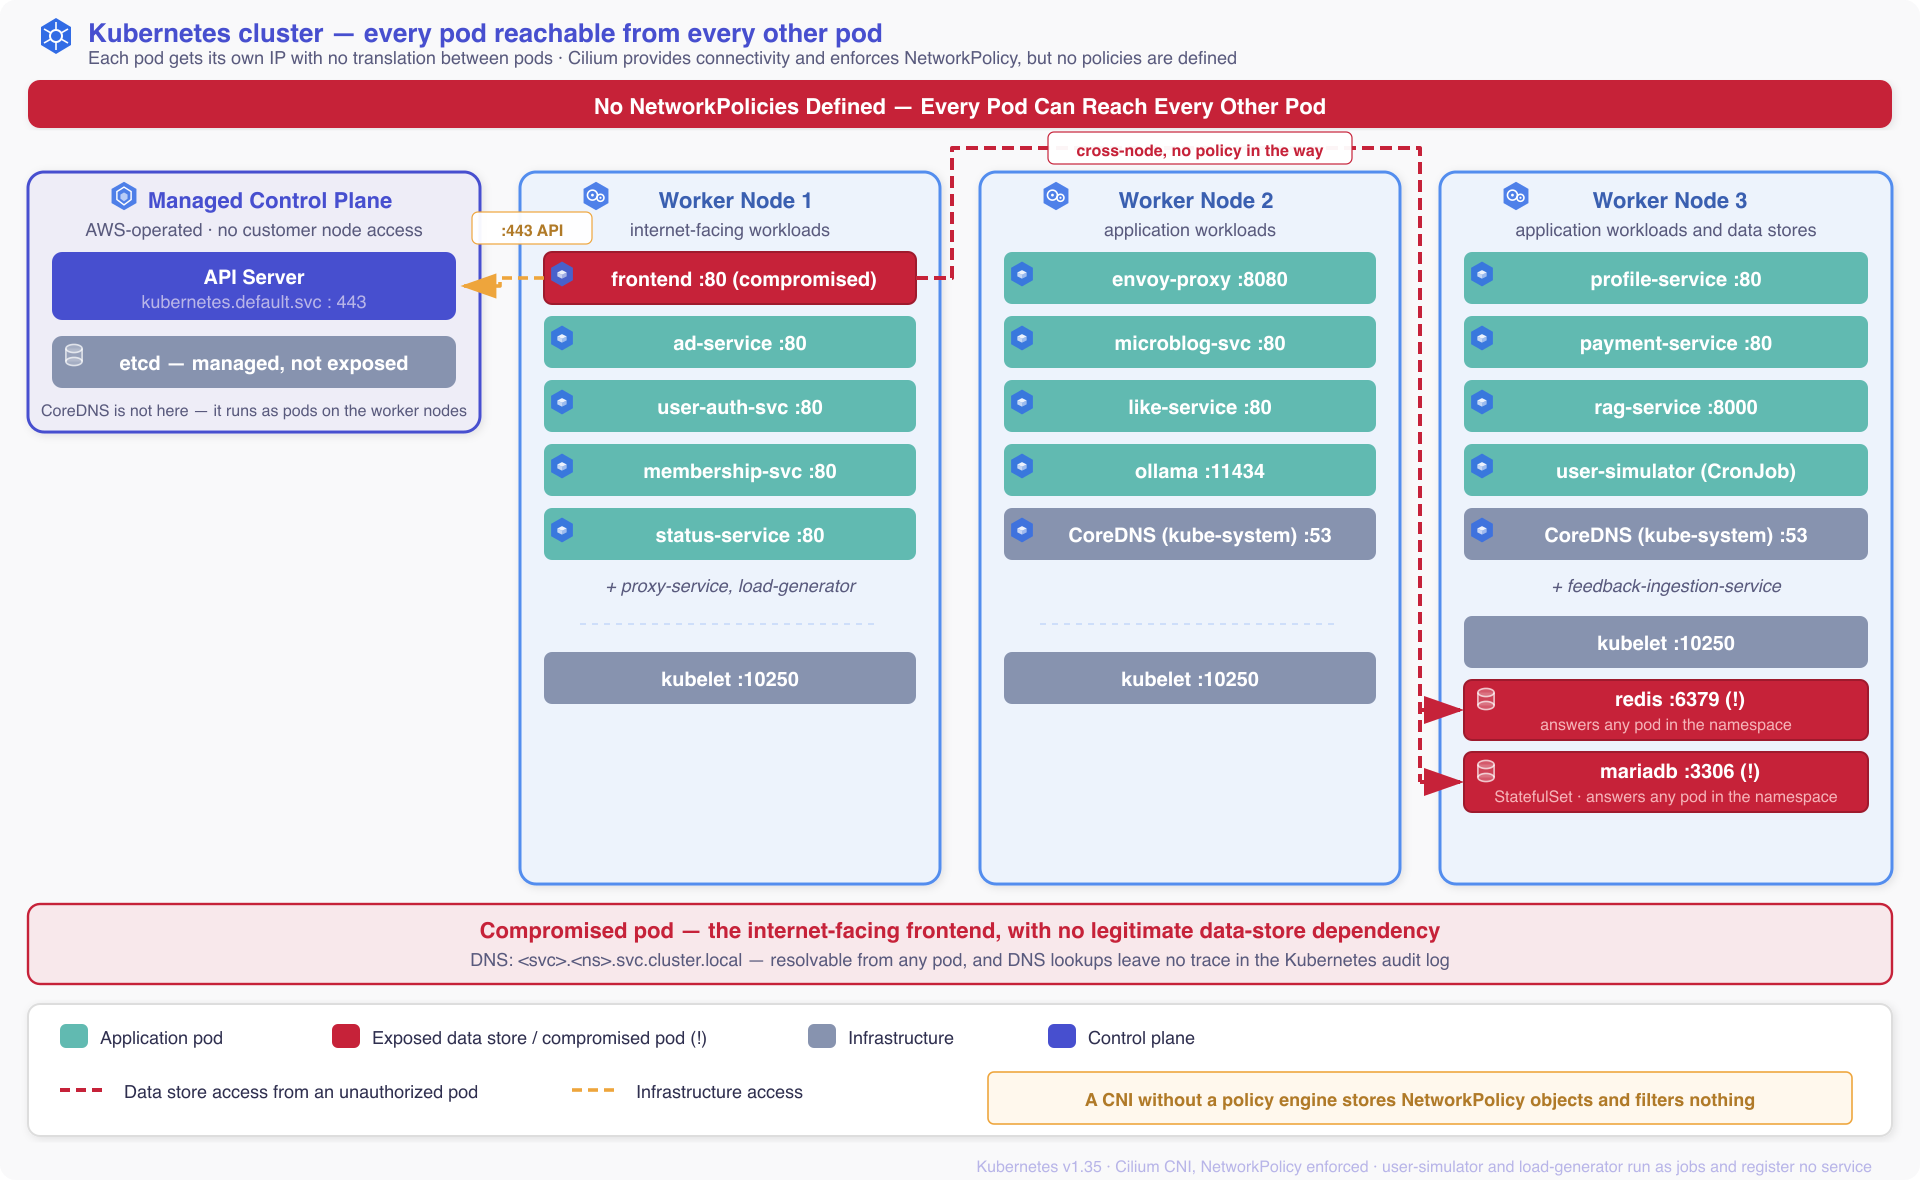
The CNI gives each node a slice of a cluster-wide address range and encapsulates traffic between nodes. This results in a flat overlay in which every pod is directly reachable from every other pod.
An attacker who understands the network topology can use the flat network to reach other workloads. Kubernetes can make that topology easy to discover: CoreDNS registers services under predictable names, so a pod that knows the naming convention can resolve other services. Depending on the cluster configuration, those lookups can also reach neighboring namespaces. CoreDNS resolves names; network and platform controls determine who may connect.
Demo environment
Our demonstration uses Dynatrace’s Unguard application, a deliberately vulnerable microservices application. Unguard provides the services and application-level vulnerabilities; Kimera runs the checks, attack techniques, and remediation steps against the Kubernetes cluster. Unguard runs 16 services in a single namespace (see Figure 1), including:
- A MariaDB instance
- A Redis instance
- The services that authenticate users and take payments
- Public-facing workloads that under ideal conditions should not communicate with any of these.
Before testing an attack, we use Kimera to check which protections are already in place. The command below reports each workload’s security context and the namespace’s NetworkPolicy count. For this demonstration, we focus on the policy count:
$ uv run kimera -n unguard verify
❌ No NetworkPolicies in namespace unguard
The namespace has no NetworkPolicies, which is the default state of a new namespace and still appears in some real-world deployments. The NSA and CISA Kubernetes Hardening Guidance, the CIS Kubernetes Benchmark, and the OWASP Kubernetes Top 10 each name missing network policies as a common Kubernetes misconfiguration. In Dynatrace Kubernetes Security Posture Management (KSPM), which continuously checks Kubernetes resources against security and compliance controls, the same issue appears as DORA-67974: Ensure that all Namespaces have network policies defined.
The value of one compromised pod
Attack Context: In this scenario, the attacker controls one internet-facing pod but doesn’t yet know what else runs in the namespace. In a misconfigured cluster the Kubernetes platform itself can supply that information. The DNS naming convention is public, and since no credentials are required for DNS resolution, CoreDNS can resolve service names for workloads that can query it.
We treat the frontend as the compromised workload because internet-facing pods often provide the initial foothold for an adversary. A single command runs the reconnaissance and reachability test an attacker would likely try:
$ uv run kimera -n unguard exploit missing-network-policies --mode demo The first tests ask CoreDNS what exists:
[EXPLOIT] Test 1: DNS service enumeration
   FOUND: unguard-mariadb -> 10.100.42.232
   FOUND: unguard-redis -> 10.100.202.211
   FOUND: unguard-user-auth-service -> 10.100.238.87
   ...
[*] Total services discovered: 16
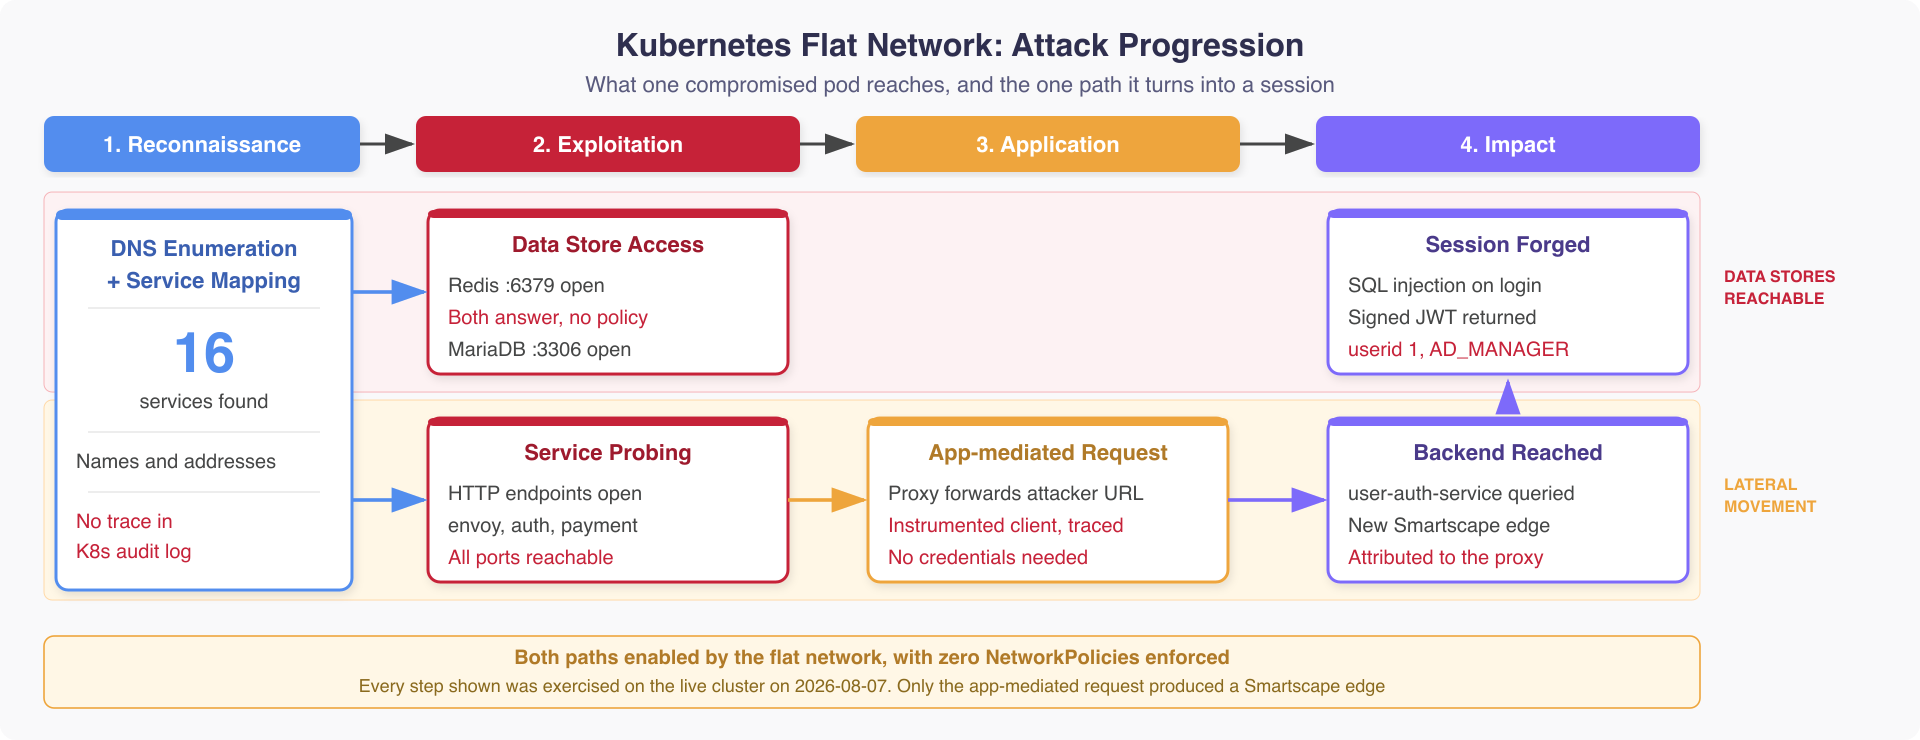
From the compromised frontend pod, Kimera discovers 16 services and returns their names and IP addresses. By default, Kubernetes audit logs do not record DNS queries, so this discovery step may leave no obvious trace in cluster audit data.
After discovering the services, we test which destinations the compromised pod can contact: the 16 services, the Kubernetes API server, and cluster DNS. Kimera discovers that all of them respond:
[EXPLOIT] Test 2: Data store accessibility
   MySQL/MariaDB (unguard-mariadb:3306) -> OPEN
   Redis (unguard-redis:6379) -> OPEN

[EXPLOIT] Test 3: Lateral movement to application services
   unguard-user-auth-service:80 -> OPEN
   unguard-payment-service:80 -> OPEN
   ...

[EXPLOIT] Test 4: Infrastructure access
   kubernetes.default.svc.cluster.local:443 -> REACHABLE
   kube-dns.kube-system.svc.cluster.local:53 -> REACHABLE
The frontend has no legitimate reason to talk to the database, the cache, or the Kubernetes API server, yet all three answered its requests
The confused deputy
Attack Context: We assume the attacker has no valid database credentials and therefore cannot query MariaDB directly. Instead, the attacker looks for an application path that will make the request on their behalf. The application makes that request using its own identity and authority, even though the attacker has neither. This is a form of the confused deputy problem.
In Unguard, proxy-service provides exactly such a path. It accepts a user-supplied URL and fetches that URL on the user’s behalf, including URLs that point to internal services. An attacker can therefore use it to reach user-auth-service via Kimera, even though that service would not otherwise be directly accessible to them.
user-auth-service authenticates users and has access to the underlying MariaDB tables. Its login route accepts credentials through query parameters and constructs the database lookup using string replacement. The Unguard source code explicitly calls out the resulting vulnerability:
// vulnerable to sql injection because prepared statements are not used
const vulnerableQuery = database.checkUserExistsQuery.replace('?', `"${username}"`);
This SQL injection is an intentional vulnerability in Unguard, not a Kubernetes misconfiguration. The missing network restrictions make the vulnerable service reachable through this attack path.
The assembled query has three columns:
SELECT username, password_hash, id FROM users WHERE username = "<injected>" The login service uses bcrypt.compare to check the submitted password against the hash in the returned row. The UNION lets us supply that row, including a bcrypt hash for a password we choose. Submitting the matching password passes the check, and the service issues a token for the user ID we supplied. A separate query retrieves that user’s roles from the database.
We drive the whole thing through the proxy service, from the compromised frontend pod, using Kimera’s L7 technique, which issues an application-layer HTTP request from inside the chosen pod:
$ uv run kimera -n unguard technique run L7 --pod <frontend-pod> \
     --param url='http://unguard-proxy-service/?url=<encoded login URL with UNION payload>&header=x'

app-mediated request -> REACHABLE (HTTP 200)
     body: {"result":"successfully logged in!","jwt":"eyJ0eXAiOiJKV1QiLCJhbGciOiJSUzI1NiJ9..."}
Decoding the token gives us:
userid : 1
roles  : ['AD_MANAGER']
alg    : RS256
We now hold a validly signed session for user id 1 carrying that user’s real role, without ever learning their password and without opening a connection to the MariaDB database.
What Dynatrace shows us
Dynatrace KSPM scans the cluster on a schedule and flags namespaces with no network policies:
fetch security.events, from:-2h
| filter dt.system.bucket == "default_securityevents_builtin"
| filter event.type == "COMPLIANCE_FINDING"
| filter k8s.cluster.name == "<your-cluster>"
| filter k8s.namespace.name == "<your-namespace>"
| filter contains(lower(compliance.rule.title), "network policies defined")
| filter compliance.result.status.level != "NOT_RELEVANT"
| fieldsAdd check = compliance.rule.id, rule = compliance.rule.title,
     namespace = compliance.result.object.name,
     verdict = compliance.result.status.level
| fields check, rule, namespace, verdict
| dedup {check}
This filtered query clearly displays the issue: DORA-67974 fails for the namespace we tested. The finding means no NetworkPolicy objects are defined for that namespace, so Kubernetes’ default pod-to-pod connectivity remains open until policies are created and enforced.

Note: Scans run on a fixed schedule, so short windows can contain no scan at all and return an empty table.
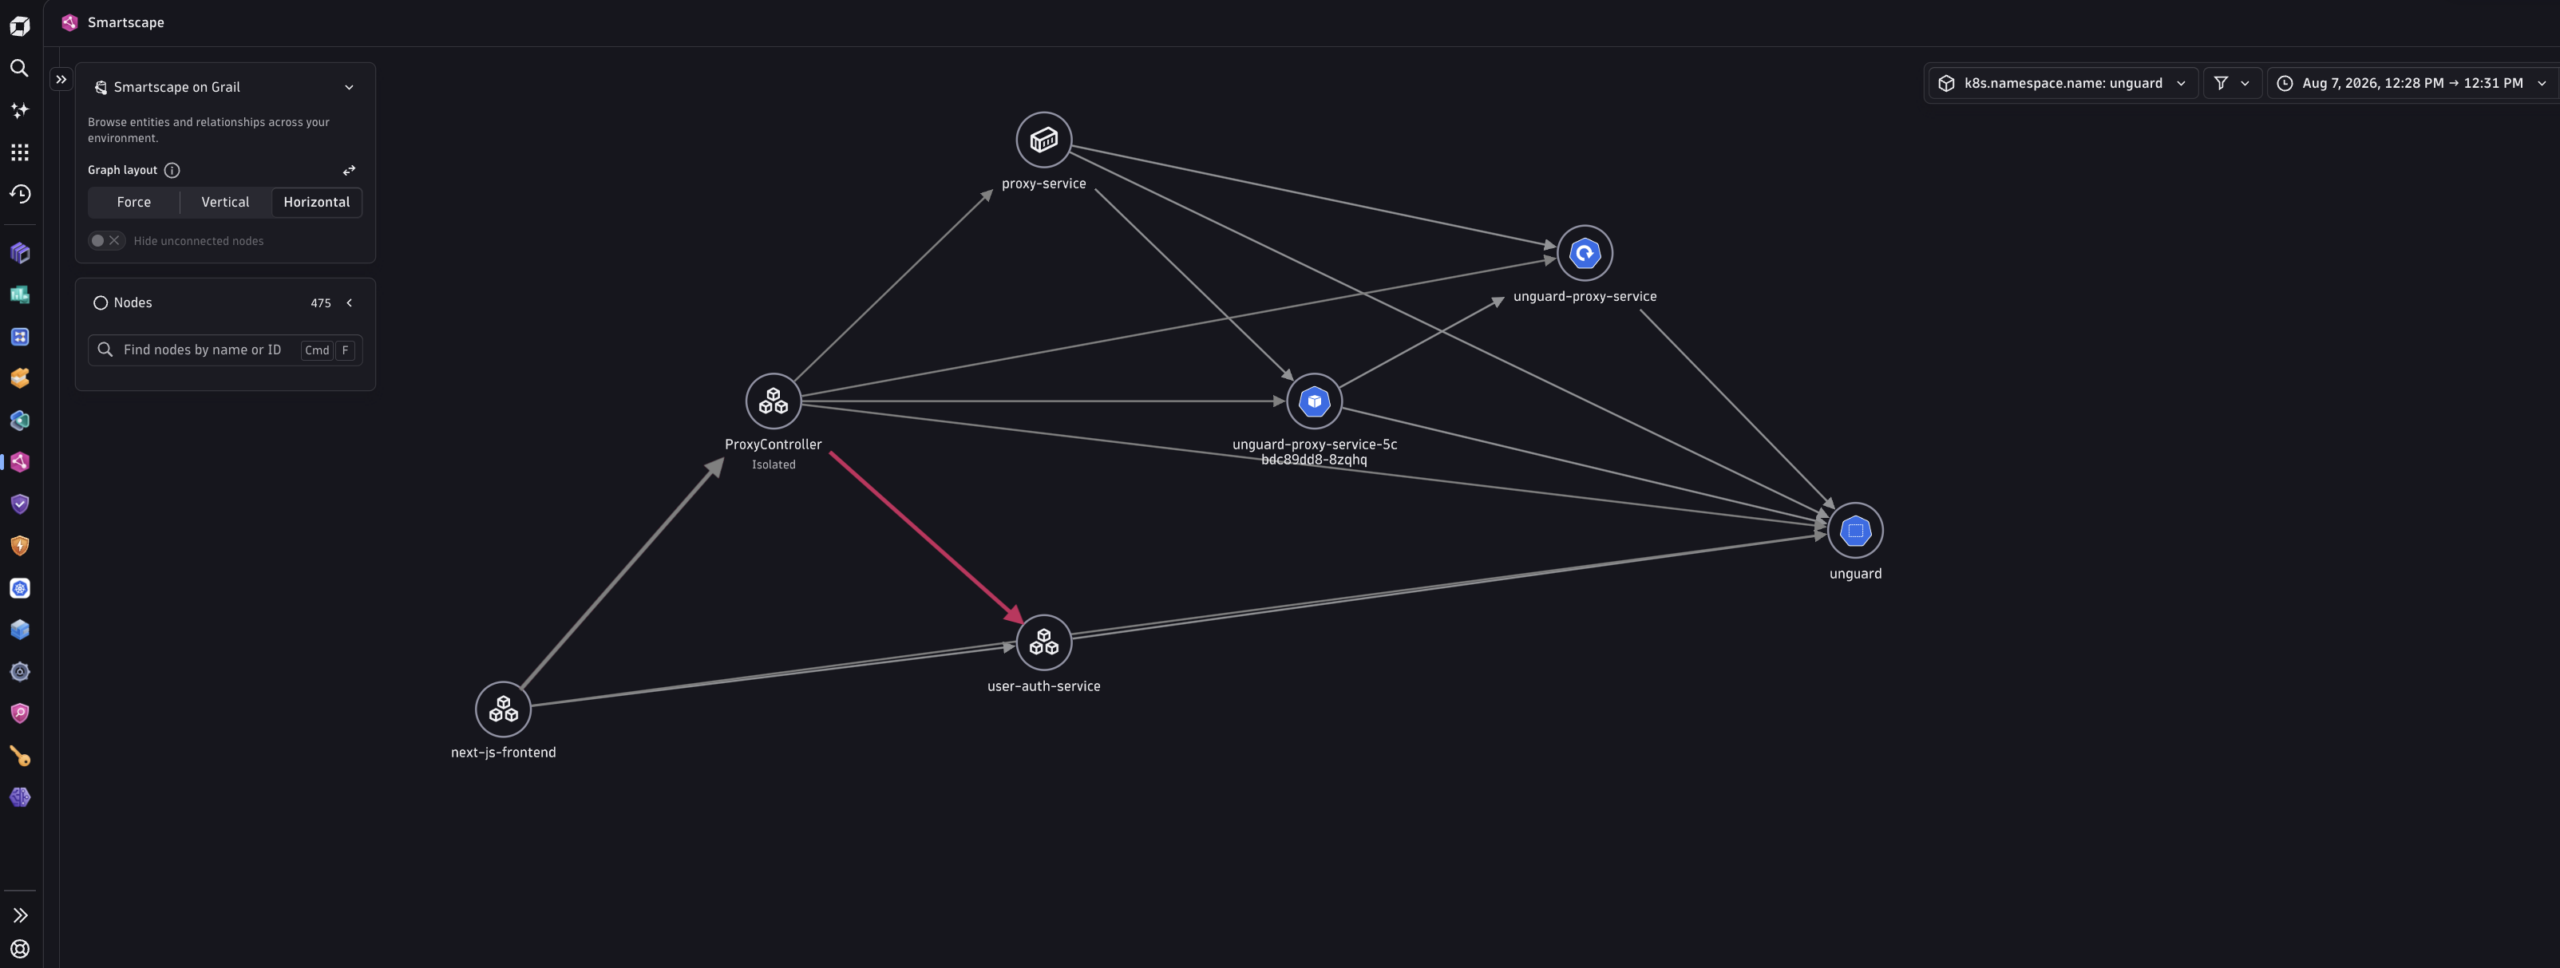
The attack path is visible in Dynatrace because the critical hop is made by proxy-service, an application process instrumented by Dynatrace OneAgent. Smartscape records observed service-to-service calls, so it can show when the proxy calls user-auth-service during the attack window.
smartscapeEdges calls, from:"<window-start>", to:"<window-end>"
| filter source_type == "SERVICE" and target_type == "SERVICE"
| fieldsAdd
     source_name = getNodeField(source_id, "name"),
     target_name = getNodeField(target_id, "name")
| fields source_name, target_name
| dedup {source_name, target_name}
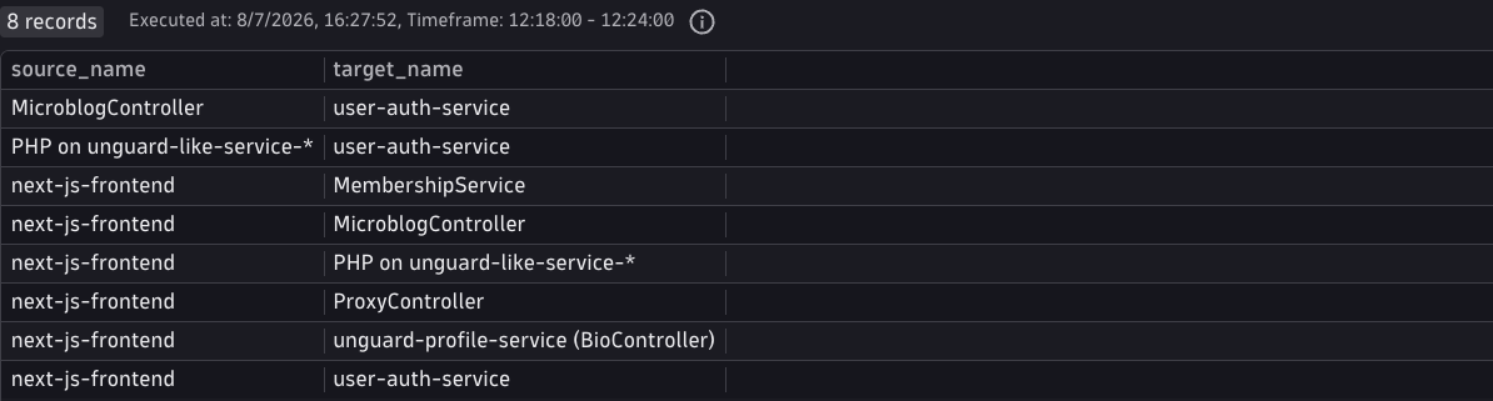
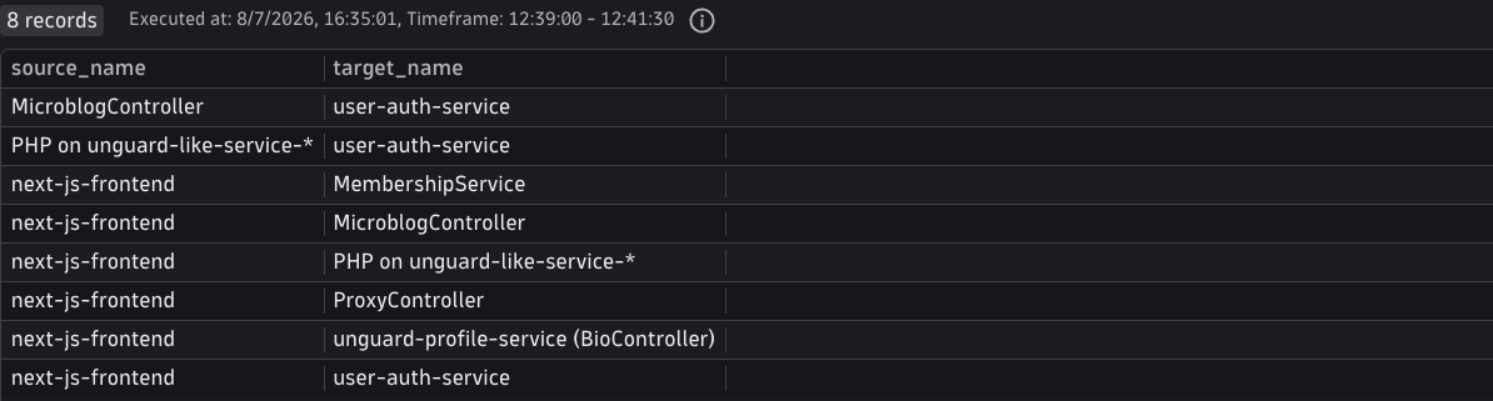
Over a window from before the attack started, the namespace shows eight edges, with no traffic originating from the proxy. Each one is ordinary application traffic, present whether or not an attack is underway.
The same query across the window in which we ran the attack returns one additional edge.
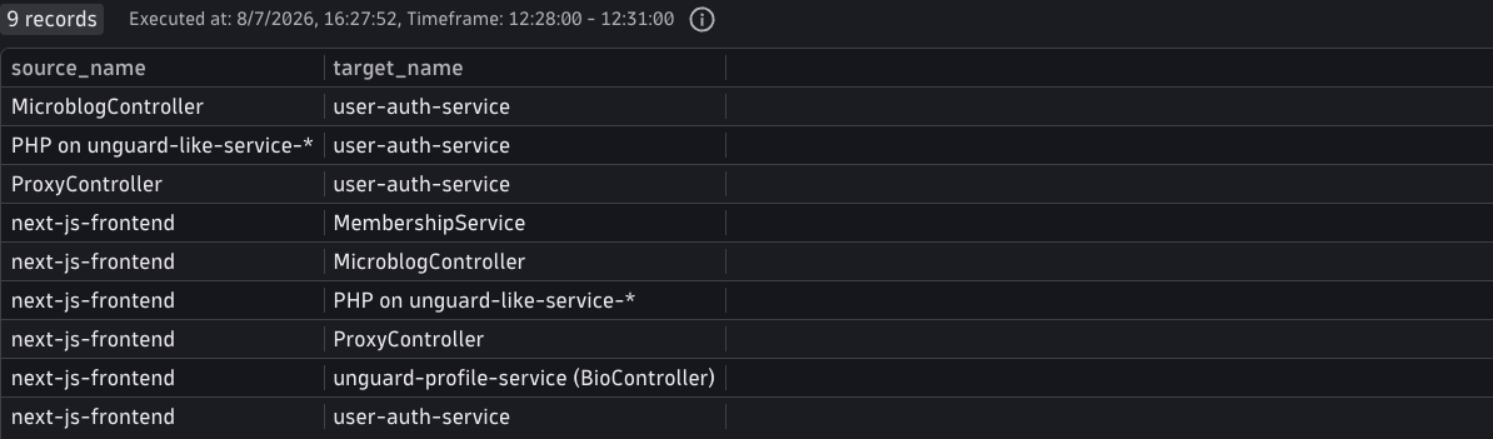
user-auth-service on the attacker’s behalf.Without the pre-attack window, the ninth edge looks like any other service call; the topology row alone does not say which edge belongs to the attack.
Smartscape also shows the attack visually. In this example, the attacker controls only the frontend. The proxy makes the second hop using its own application identity, carrying the attacker’s request to a backend service that the attacker should not be able to use through that path. This call appears as an edge because it comes from an instrumented application. The earlier shell-based probes ran inside a pod and produced neither a span nor a Smartscape edge.
KSPM reports findings against Kubernetes workloads, while Smartscape names services by application identity. That means the same workload can appear under two names: proxy-service in KSPM and ProxyController in Smartscape. To connect the configuration finding with the observed attack path, we join the KSPM findings with Smartscape edges from the attack window:
fetch security.events, from:"<scan-window-start>", to:"<scan-window-end>"
| filter dt.system.bucket == "default_securityevents_builtin"
| filter event.type == "COMPLIANCE_FINDING"
| filter k8s.cluster.name == "<your-cluster>"
| filter k8s.namespace.name == "<your-namespace>"
| filter compliance.result.status.level == "FAILED"
| filter startsWith(compliance.rule.id, "DORA")
| fieldsAdd join_key = 1
| join [
     smartscapeEdges calls, from:"<window-start>", to:"<window-end>"
     | filter source_type == "SERVICE" and target_type == "SERVICE"
     | fieldsAdd
         src_name = getNodeField(source_id, "name"),
         dest_name = getNodeField(target_id, "name"),
         join_key = 1
     | filter isNotNull(src_name)
   ], on:{left[join_key] == right[join_key]}, prefix:"rt."
| filter contains(lower(compliance.result.object.name), "proxy")
     and contains(lower(rt.src_name), "proxy")
| fieldsAdd rule = compliance.rule.id, finding = compliance.rule.title,
     source_service = rt.src_name, calls_target = rt.dest_name
| fields rule, finding, source_service, calls_target
| dedup {rule, finding, source_service, calls_target} 
Two controls come back against proxy-service: DORA-67954, Minimize access to create pods, and DOR_67955, Ensure the default service accounts are not actively used. In a compliance report these read as ordinary Role-Based Access Control (RBAC) and service-account findings, ranked by rule and not by what the workload did.
Closing the routes
The fix is a set of NetworkPolicy objects. These objects only work when the cluster’s CNI enforces them; on a plugin with no policy engine, the policies would exist, but traffic would still be allowed. For this demo, we use Cilium, so the policies below are enforced.
We now use Kimera to generate a defensive policy set from the paths reached during the exploit. In this demonstration, an LLM drafts the remediations using Dynatrace findings and topology data retrieved through the Model Context Protocol:
$ uv run kimera -n unguard generate --from-findings findings.json \
     --scope namespace --enrich dynatrace \
     --enrich-strategy targeted -o kimera-remediations.yaml

[INFO] Connected to DT MCP gateway (strategy: targeted)
[INFO] Strategy: targeted | Queries: 2 | KSPM findings: 1 | Smartscape edges: 9 | Total records: 12
[INFO] Remediation scope: namespace
Those nine Smartscape edges are the same set our topology query returned, attack hop included.
Kimera classifies every path before writing anything:
DENY (3)
   unguard-mariadb:3306 - undeclared MySQL/MariaDB access
   unguard-redis:6379 - undeclared Redis access
   kubernetes.default.svc.cluster.local:443 - destination outside the namespace

KEEP (10)
   unguard-user-auth-service:80 - declared in network_topology
   ... eight more declared dependencies
   kube-dns.kube-system.svc.cluster.local:53 - DNS, permitted by every policy

REVIEW (4)
   unguard-envoy-proxy:8080 - undeclared in-namespace destination
   ... three more undeclared in-namespace destinations
The user decides which dependencies are legitimate; Kimera does not infer them. Paths declared in the profile are classified as KEEP. REVIEW paths remain denied until the user approves them. We retain DNS access because blocking name resolution would break the workload without closing an attack path.
Applying the set creates 19 policies:
$ uv run kimera -n unguard apply kimera-remediations.yaml
[SUCCESS] Applied 19/19 resources from kimera-remediations.yaml
Verification
To verify the fix, we re-run the exact command used in the attack. Repeating it every 20 seconds during the verification window helps distinguish a blocked path from a path that simply happened to be idle:
$ uv run kimera -n unguard technique run L7 --pod <frontend-pod> --param url='<same URL>'
app-mediated request -> UNREACHABLE
The chain breaks at user-auth-service because its ingress rule excludes proxy-service. The rule permits only the frontend, ad-service, like-service, and microblog-service. These four callers are declared in the profile’s network_topology and retain access to authenticate users. The other 11 workloads lose access.
The same policy set gives proxy-service an egress rule, because it still has to fetch external URLs, which is part of its intended behavior in Unguard. That rule permits 0.0.0.0/0 but excludes private IP ranges—10.0.0.0/8, 172.16.0.0/12, 192.168.0.0/16—and the cloud metadata address 169.254.169.254/32. Excluding private ranges closes the variant where the same SSRF targets a pod IP instead of a service name, since the pod network sits inside those ranges. The rule doesn’t restrict which external host the proxy may be pointed at.
| Probe from the compromised pod | Without Network Isolation | With Network Isolation |
| SSRF through proxy to user-auth-service | REACHABLE (200) | UNREACHABLE |
| proxy-service fetching an external URL | REACHABLE (200) | REACHABLE (200) |
| user-auth-service, called directly by a declared caller | REACHABLE (200) | REACHABLE (200) |
| mariadb:3306 | OPEN | UNREACHABLE |
Topology over a window after the policies took effect shows our attack edge gone and the eight ordinary application edges unchanged, including the frontend’s own call to the proxy:
KSPM reflects the policy change on the next scan. Pinning the rule id and reading three consecutive scans shows the transition from failed to passed:
fetch security.events, from:"<scan-window-start>", to:"<scan-window-end>"
| filter dt.system.bucket == "default_securityevents_builtin"
| filter event.type == "COMPLIANCE_FINDING"
| filter k8s.cluster.name == "<your-cluster>"
| filter k8s.namespace.name == "<your-namespace>"
| filter compliance.rule.id == "DORA-67974"
| fields timestamp, scan.id, compliance.result.status.level
| sort timestamp desc
The compliance control passes on the next scan:

Figure 9. DORA-67974 across three consecutive scans, moving to PASSED on the first scan after the policies were applied.
NetworkPolicy blocks the confused deputy path but does not fix the application’s SQL injection vulnerability. The frontend remains a declared caller of user-auth-service, so the injection may still work through a permitted path. The policy reduces the number of workloads that can reach the authentication service from 15 to four. Fixing the vulnerability still requires changes to the application code.
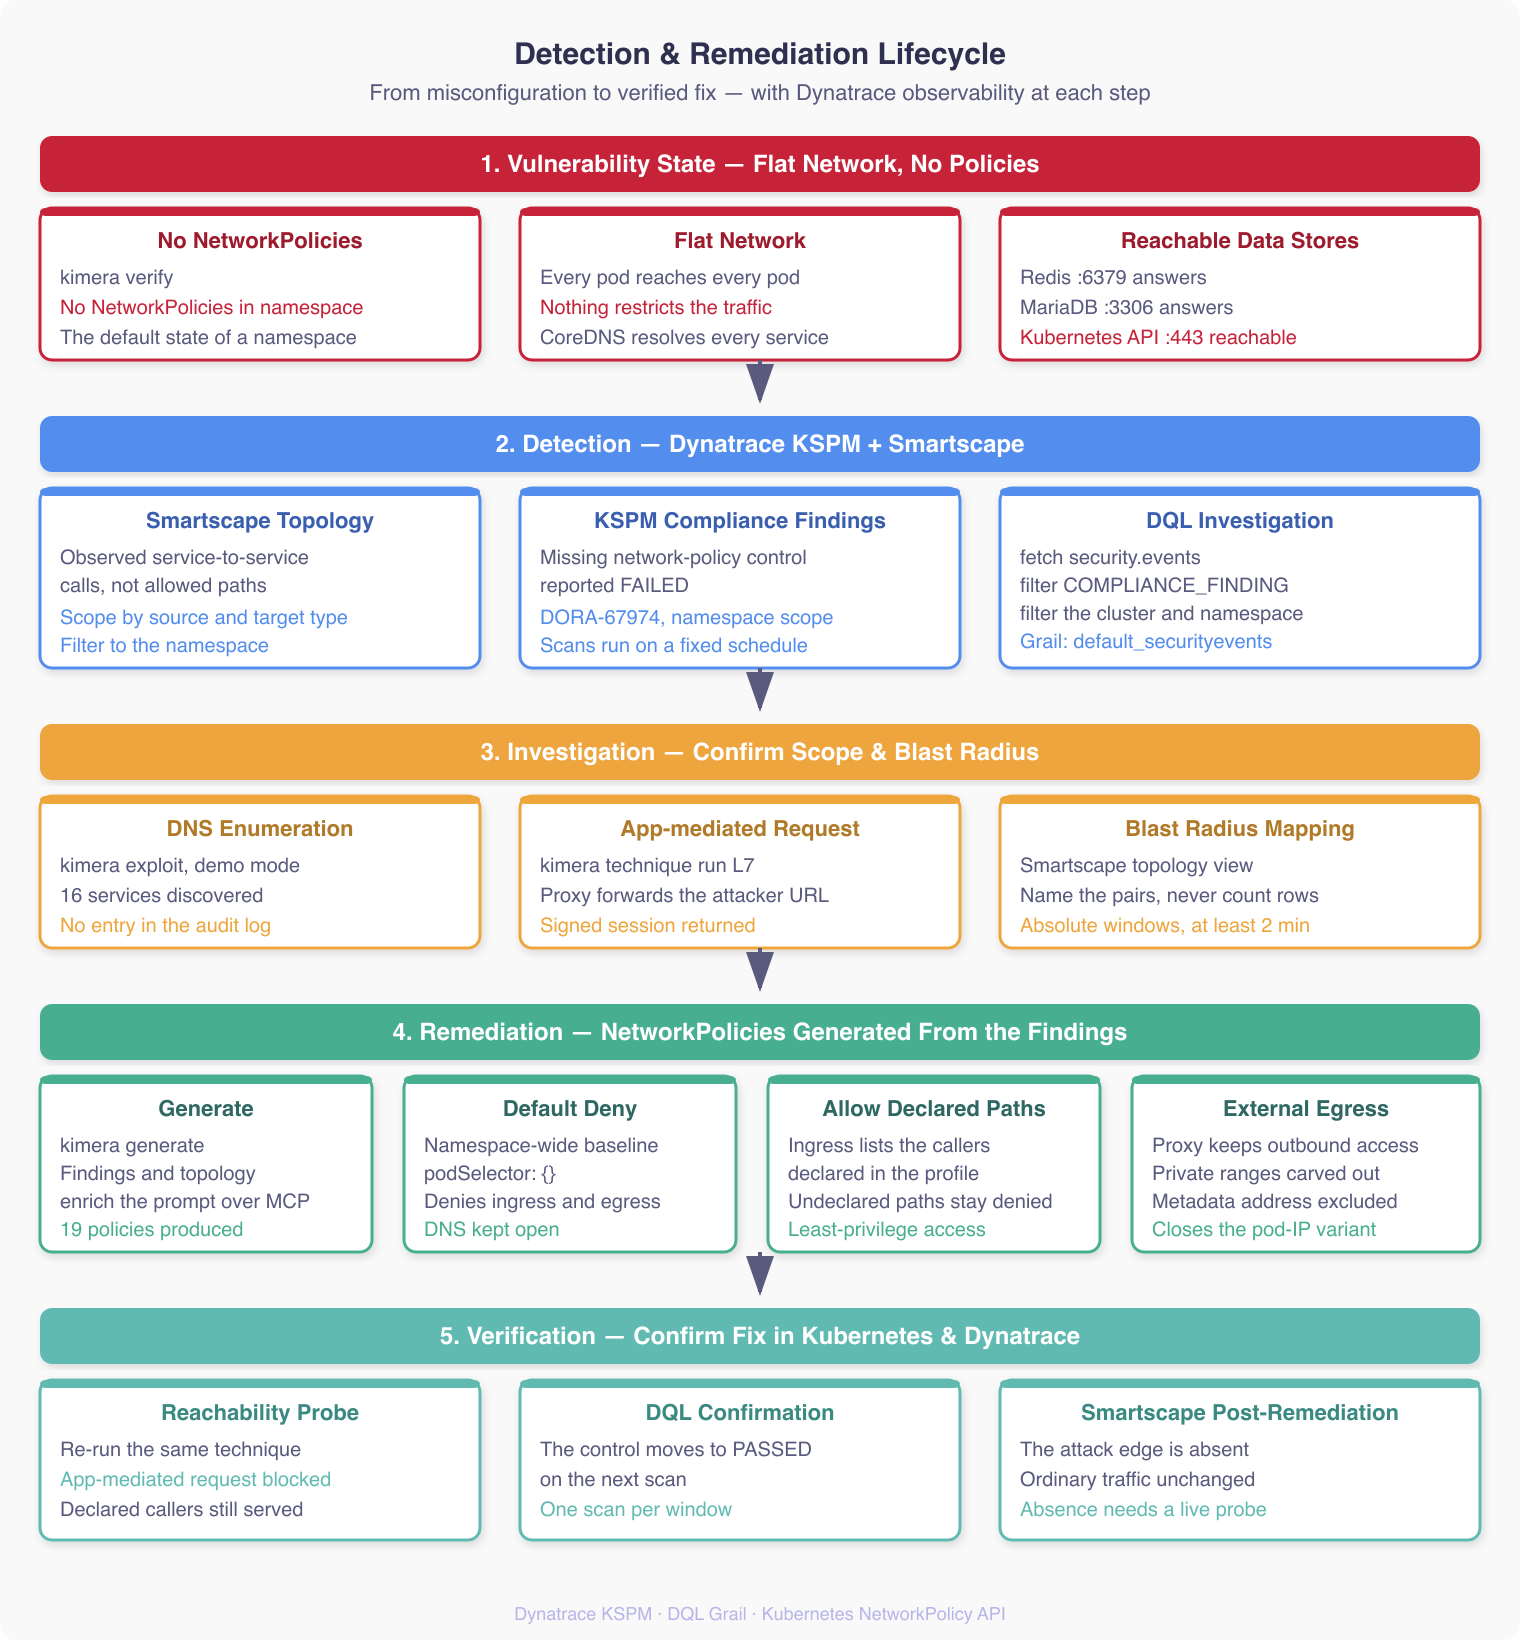
The whole sequence, from the missing control to the verified fix, runs through five stages as shown below:
Key takeaways
- Kubernetes networking defaults to full connectivity, and DNS enumeration of every service leaves no entry in the Kubernetes audit log.
- Reachability alone did not get us a session. Turning it into one required an application that would fetch a URL on request and a backend with an application-level vulnerability.
- Movement carried by an instrumented application shows up in topology, while a shell an attacker starts inside a pod does not, so we confirmed the block with a direct reachability probe.
- A compliance control can ask whether policies are defined without stating if the namespace is actually segmented.
Next steps
- Audit your namespaces. Run the KSPM query from earlier against your own namespaces, with two changes: drop the k8s.namespace.name filter so it covers every namespace, and dedup on {check, namespace} so each namespace reports separately. Any namespace returning FAILED on DORA-67974, or on the CIS 5.3.2 variant of the same control, has no
NetworkPolicydefined. - Review the series so far. Network segmentation complements the container hardening from Part 3 and the workload controls from Part 2. These controls form a security baseline when used together; none is sufficient on its own.
- Next up: RBAC. The flat network is how attackers move laterally. Overly permissive roles and bindings are how they escalate vertically; from a single pod to cluster-admin. Part 5 of this series will cover that kill chain.
The techniques demonstrated in this post are for educational purposes only. Always obtain proper authorization before testing security controls in any environment. Additional Resources

Looking for answers?
Start a new discussion or ask for help in our Q&A forum.
Go to forum